| Param | Original file | Final file |
|---|---|---|
| Filename | modeM0/AS1A12_018T01_9000005488_39502cztM0_level2.fits | modeM0/AS1A12_018T01_9000005488_39502cztM0_level2_quad_clean.evt |
| Size (bytes) | 297,898,560 | 94,063,680 |
| Size | 284.1 MB | 89.7 MB |
| Events in quadrant A | 2,966,001 | 630,987 |
| Events in quadrant B | 2,404,399 | 650,785 |
| Events in quadrant C | 2,594,911 | 621,020 |
| Events in quadrant D | 2,642,443 | 568,999 |
| Mode SS | |||
|---|---|---|---|
| Quadrant | BADHDUFLAG | Total packets | Discarded packets |
| A | 0 | 110 | 0 |
| B | 0 | 110 | 0 |
| C | 0 | 110 | 0 |
| D | 0 | 110 | 0 |
| Mode M0 | |||
|---|---|---|---|
| Quadrant | BADHDUFLAG | Total packets | Discarded packets |
| A | 0 | 12446 | 3 |
| B | 0 | 10908 | 2 |
| C | 0 | 11084 | 2 |
| D | 0 | 11729 | 2 |
| Mode M9 | |||
|---|---|---|---|
| Quadrant | BADHDUFLAG | Total packets | Discarded packets |
| A | 0 | 24 | 0 |
| B | 0 | 24 | 0 |
| C | 0 | 24 | 0 |
| D | 0 | 25 | 0 |
| Quadrant | Total seconds | Saturated seconds | Saturation percentage |
|---|---|---|---|
| A | 5378 | 30 | 0.557828% |
| B | 5378 | 5 | 0.092971% |
| C | 5378 | 9 | 0.167348% |
| D | 5378 | 46 | 0.855337% |
Noise dominated data is calculated using 1-second bins in cleaned event files. If a bin has >2000 counts, and if more than 50% of those come from <1% of pixels, then it is considered to be noise-dominated and hence unusable.
| Quadrant | # 1 sec bins | Bins with >0 counts | Bins with >2000 counts | High rate bins dominated by noise | Noise dominated (total time) | Noise dominated (detector-on time) | Marked lightcurve |
|---|---|---|---|---|---|---|---|
| A | 7201 | 5379 | 16 | 16 | 0.22% | 0.30% | 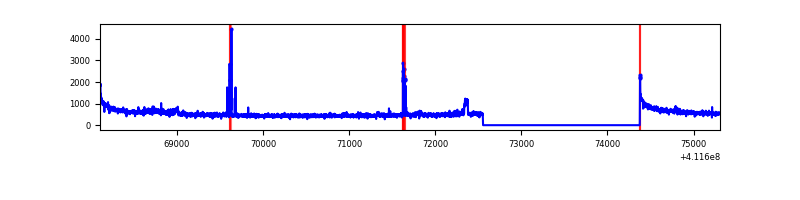 |
| B | 7201 | 5379 | 0 | 0 | 0.00% | 0.00% | 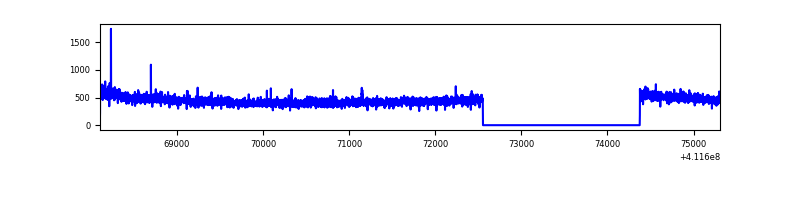 |
| C | 7201 | 5379 | 3 | 3 | 0.04% | 0.06% | 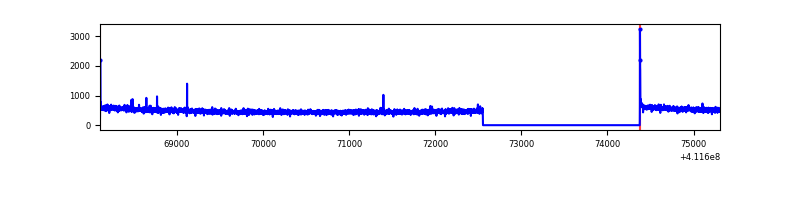 |
| D | 7201 | 5379 | 31 | 31 | 0.43% | 0.58% | 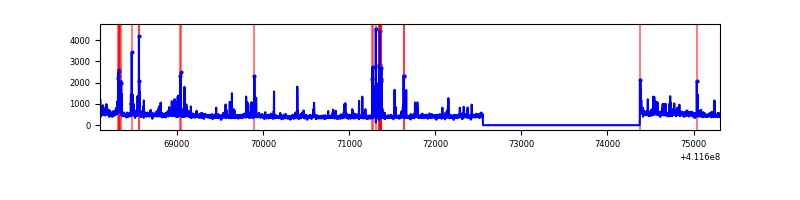 |
Top three noisy pixels from each quadrant. If the there are fewer than three noisy pixels in the level2.evt file, extra rows are filled as -1
| Pixel properties | Quadrant properties | ||||||
|---|---|---|---|---|---|---|---|
| Quadrant | DetID | PixID | Counts | Sigma | Mean | Median | Sigma |
| A | 10 | 83 | 447664 | 3674.74 | 599 | 588 | 121.7 |
| A | 6 | 10 | 73264 | 597.36 | 599 | 588 | 121.7 |
| A | 15 | 174 | 70264 | 572.7 | 599 | 588 | 121.7 |
| B | 0 | 213 | 19823 | 167.24 | 601 | 584 | 115.0 |
| B | 0 | 230 | 14576 | 121.63 | 601 | 584 | 115.0 |
| B | 12 | 111 | 14273 | 119.0 | 601 | 584 | 115.0 |
| C | 15 | 214 | 225689 | 1633.98 | 596 | 601 | 137.8 |
| C | 3 | 233 | 19168 | 134.78 | 596 | 601 | 137.8 |
| C | 0 | 10 | 15738 | 109.88 | 596 | 601 | 137.8 |
| D | 13 | 249 | 153802 | 1065.31 | 591 | 576 | 143.8 |
| D | 12 | 227 | 56422 | 388.27 | 591 | 576 | 143.8 |
| D | 2 | 249 | 50581 | 347.66 | 591 | 576 | 143.8 |
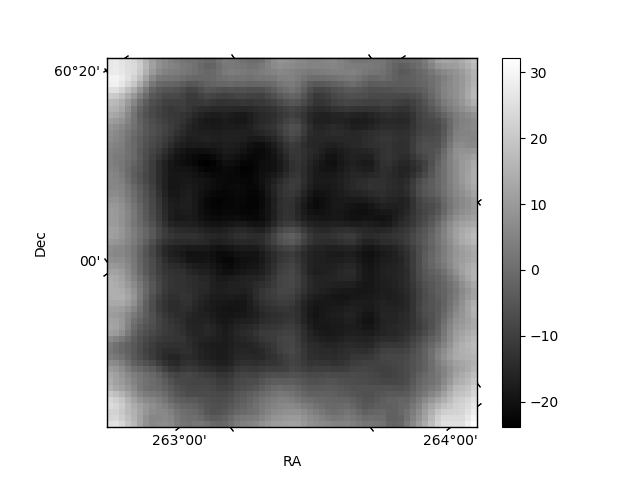
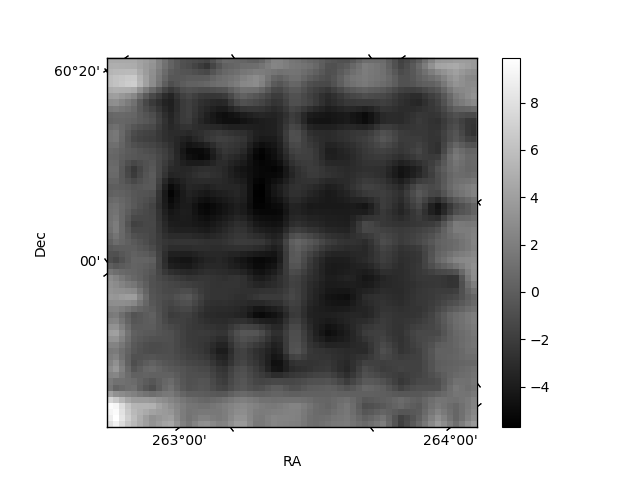
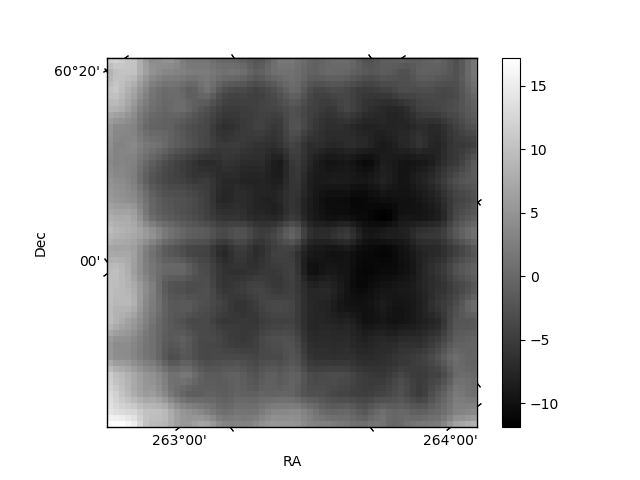
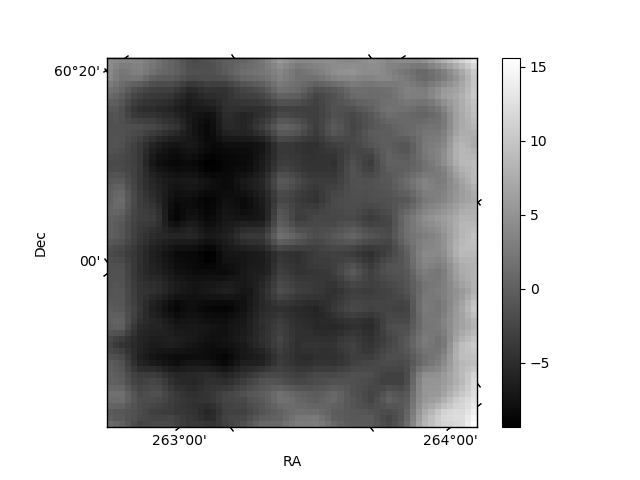
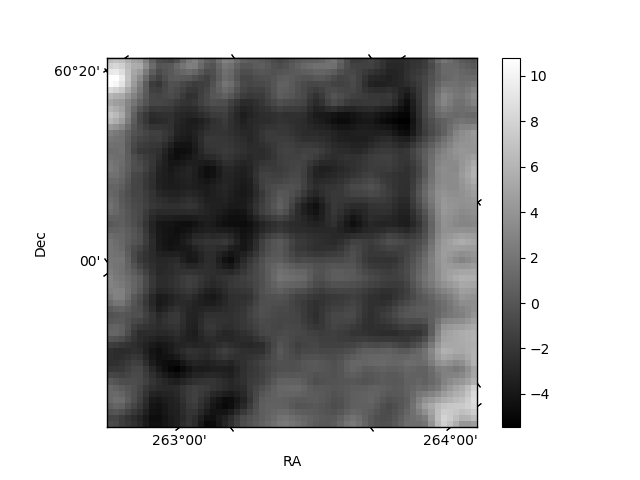
Histogram calculated using DETX and DETY for each event in the final _common_clean file
| Quadrant A | 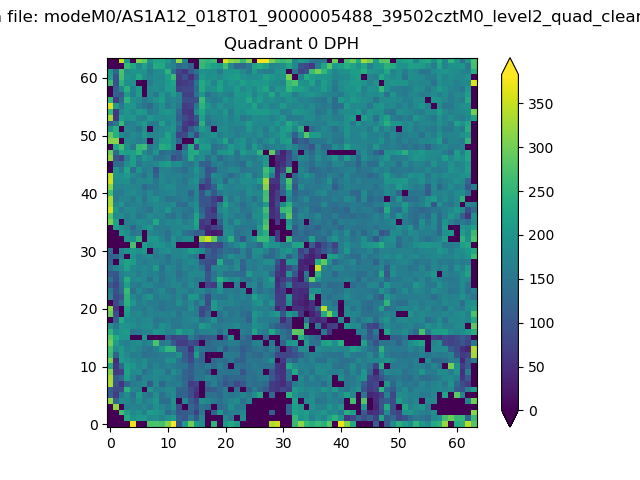 |
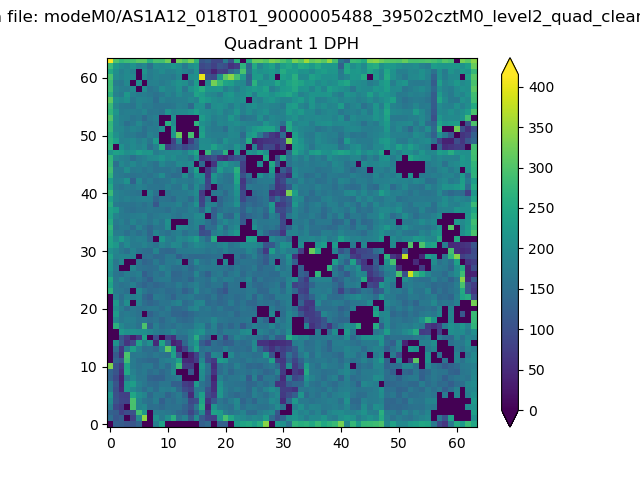 |
Quadrant B |
|---|---|---|---|
| Quadrant D | 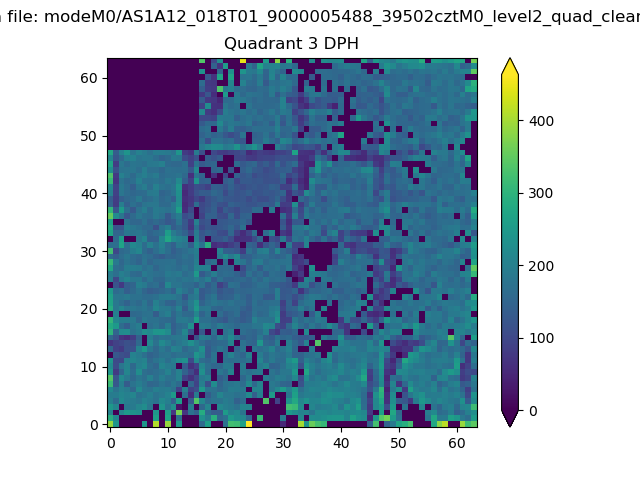 |
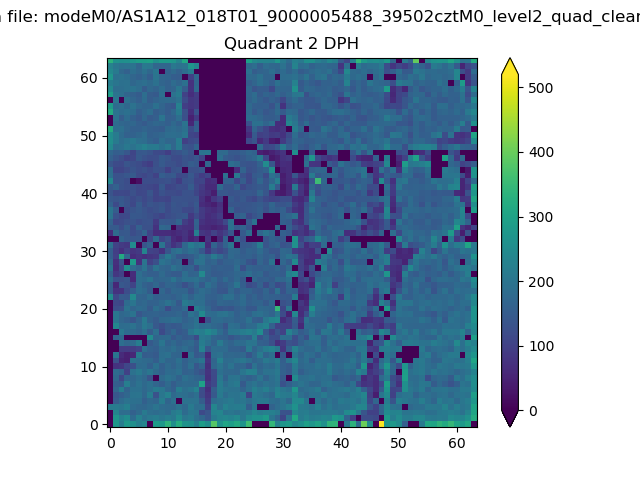 |
Quadrant C |
| Plot type | Count rate plots | Images |
|---|---|---|
| Comparison with Poisson distribution Blue bars denote a histogram of data divided into 1 sec bins. Red curve is a Poisson curve with rate = median count rate of data. |
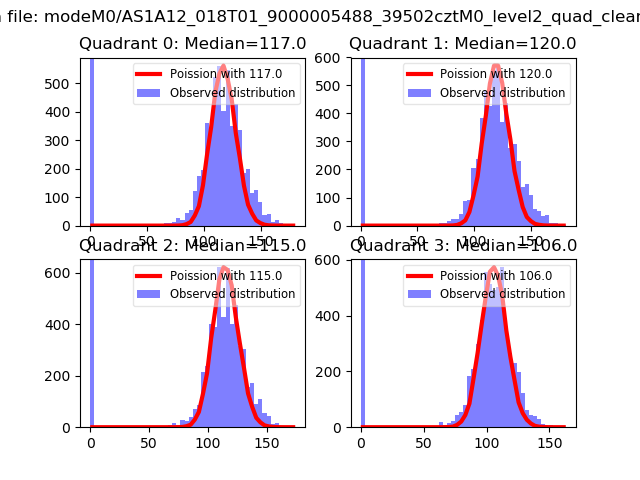 |
 |
| Quadrant-wise count rates Data is divided into 100 sec bins |
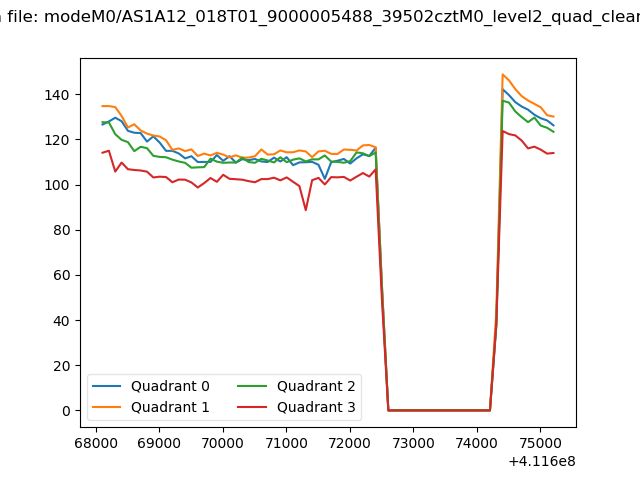 |
|
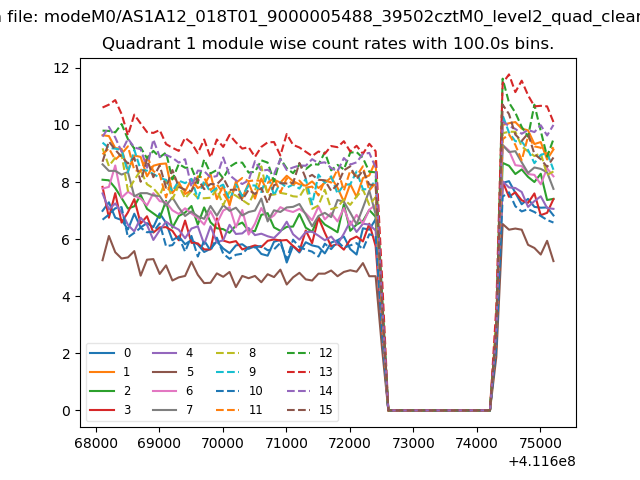
| Module-wise count rates for Quadrant A Data is divided into 100 sec bins |
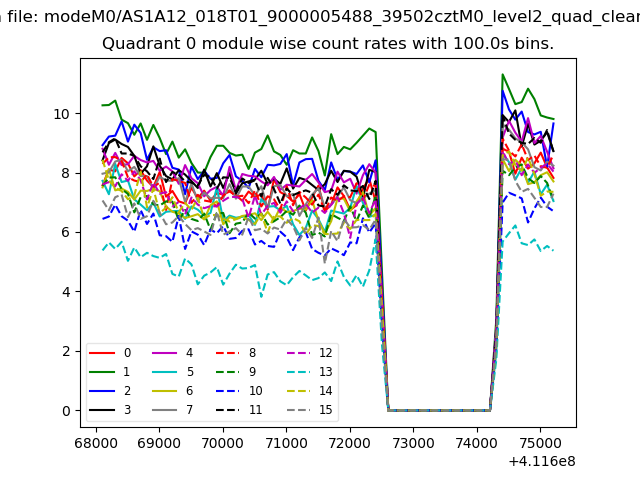 |
 |
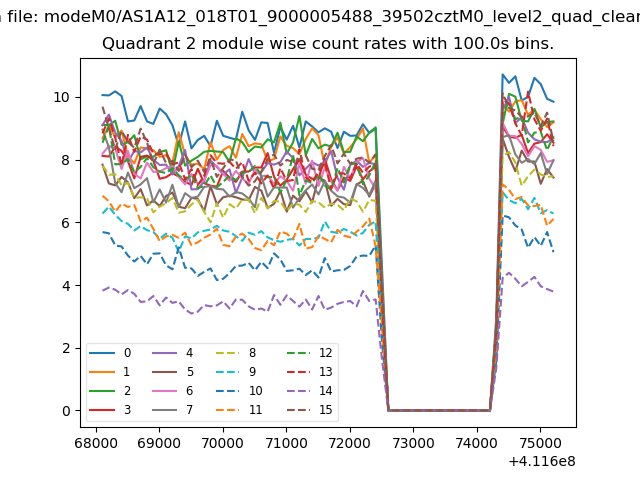
| Module-wise count rates for Quadrant B Data is divided into 100 sec bins |
 |
 |
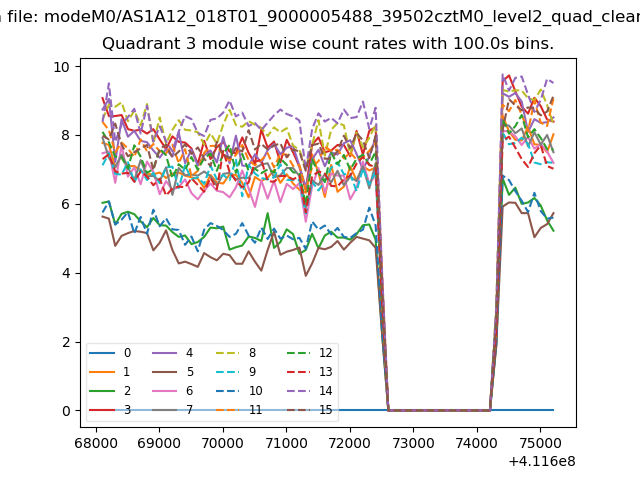
| Module-wise count rates for Quadrant C Data is divided into 100 sec bins |
 |
 |
| Module-wise count rates for Quadrant D Data is divided into 100 sec bins |
 |
 |
| Parameter | Plot |
|---|---|
| CZT HV Monitor | 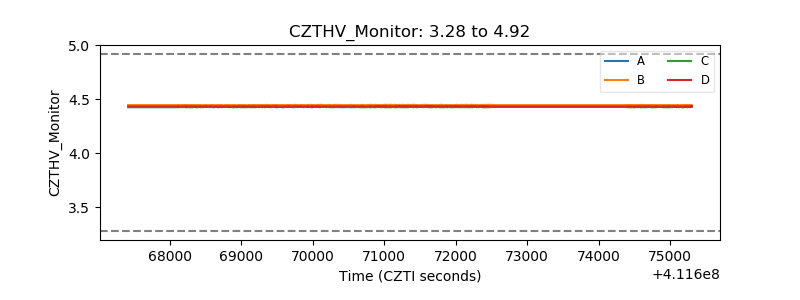 |
| D_VDD | 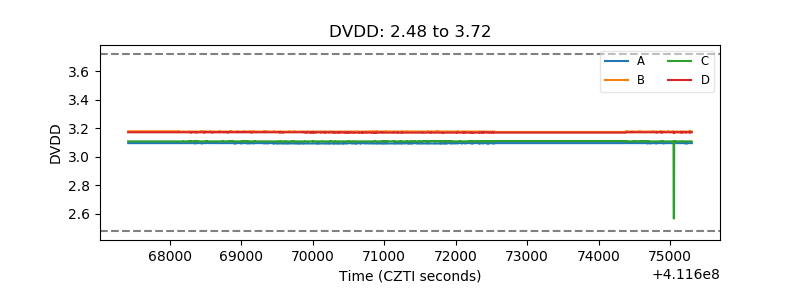 |
| Temperature 1 | 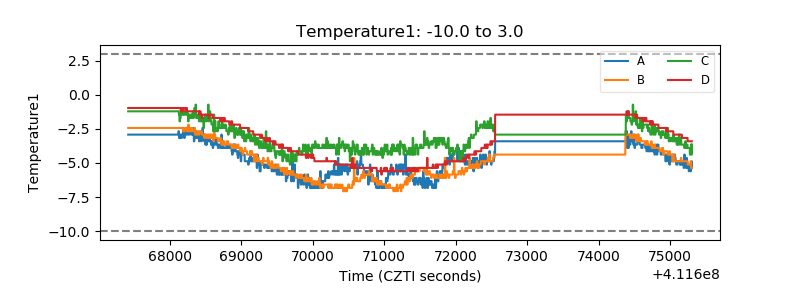 |
| Veto HV Monitor |  |
| Veto LLD | 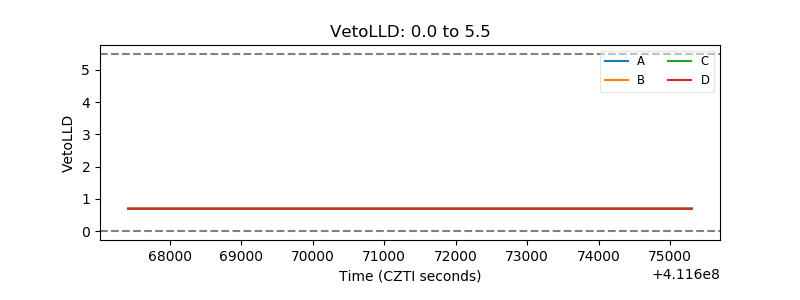 |
| Alpha Counter | 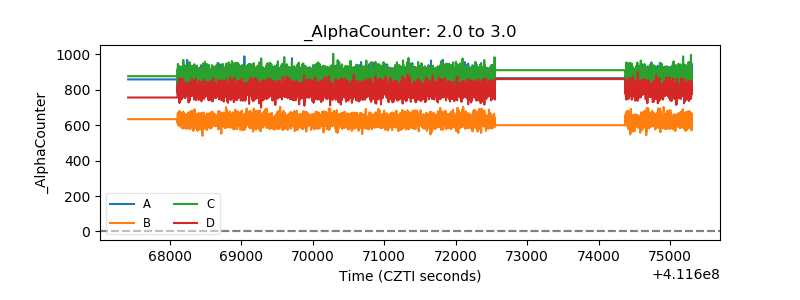 |
| _CPM_Rate | 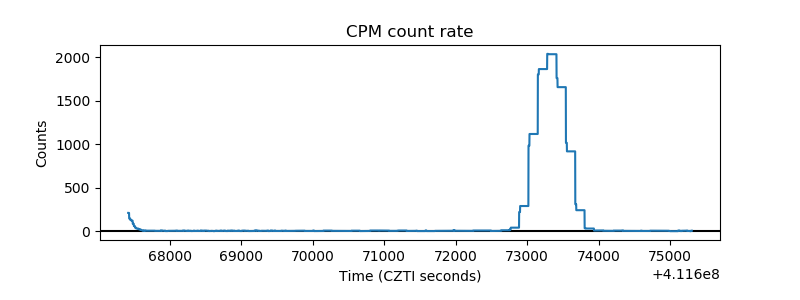 |
| CZT Counter | 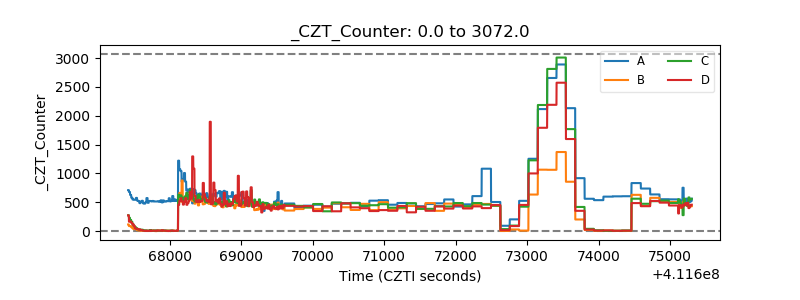 |
| +2.5 Volts monitor | 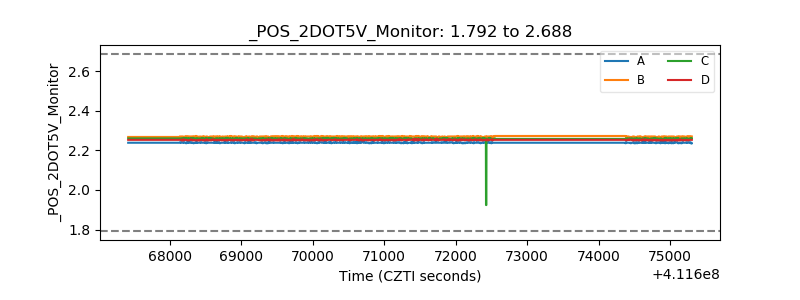 |
| +5 Volts monitor | 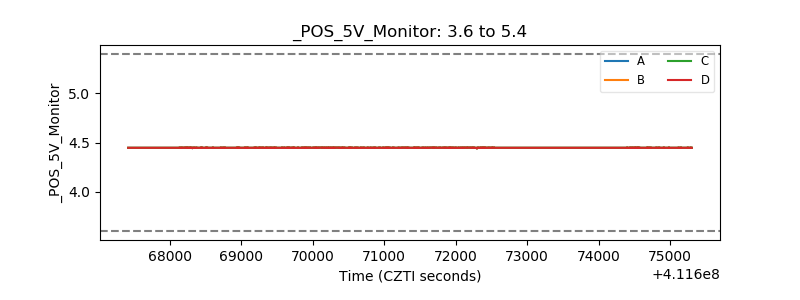 |
| _ROLL_ROT | 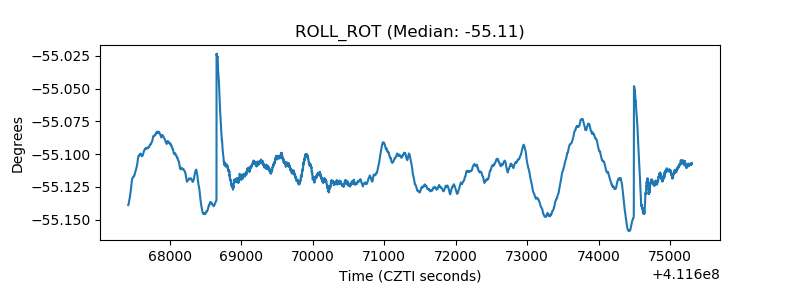 |
| _Roll_DEC | 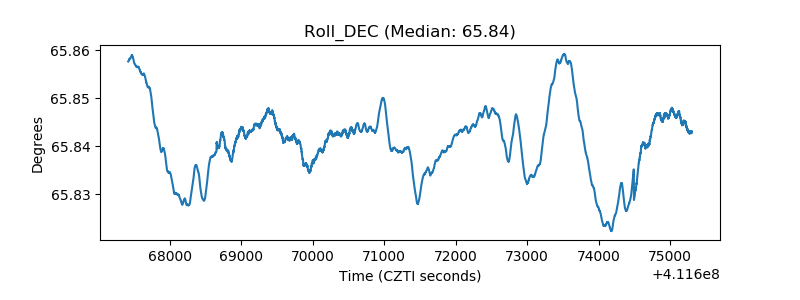 |
| _Roll_RA | 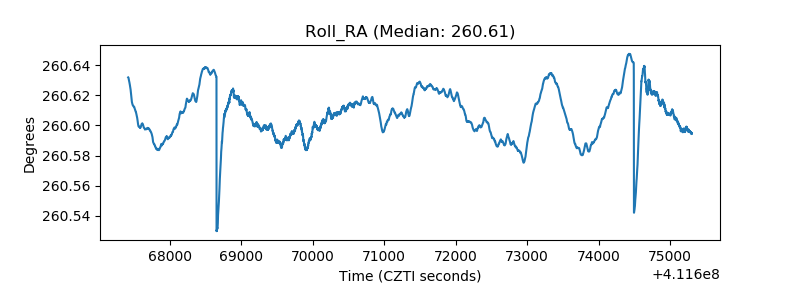 |
| Veto Counter | 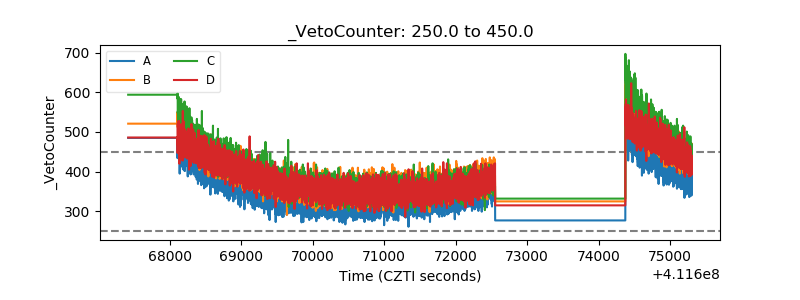 |