| Param | Original file | Final file |
|---|---|---|
| Filename | modeM0/AS1A12_018T01_9000005488_39503cztM0_level2.fits | modeM0/AS1A12_018T01_9000005488_39503cztM0_level2_quad_clean.evt |
| Size (bytes) | 534,870,720 | 165,309,120 |
| Size | 510.1 MB | 157.7 MB |
| Events in quadrant A | 5,011,717 | 1,112,407 |
| Events in quadrant B | 4,146,382 | 1,145,629 |
| Events in quadrant C | 4,518,941 | 1,099,315 |
| Events in quadrant D | 5,392,278 | 996,708 |
| Mode SS | |||
|---|---|---|---|
| Quadrant | BADHDUFLAG | Total packets | Discarded packets |
| A | 0 | 192 | 0 |
| B | 0 | 192 | 0 |
| C | 0 | 192 | 0 |
| D | 0 | 192 | 0 |
| Mode M0 | |||
|---|---|---|---|
| Quadrant | BADHDUFLAG | Total packets | Discarded packets |
| A | 0 | 20961 | 3 |
| B | 0 | 18918 | 2 |
| C | 0 | 19354 | 2 |
| D | 0 | 22875 | 2 |
| Mode M9 | |||
|---|---|---|---|
| Quadrant | BADHDUFLAG | Total packets | Discarded packets |
| A | 0 | 38 | 0 |
| B | 0 | 38 | 0 |
| C | 0 | 38 | 0 |
| D | 0 | 38 | 0 |
| Quadrant | Total seconds | Saturated seconds | Saturation percentage |
|---|---|---|---|
| A | 9398 | 34 | 0.361779% |
| B | 9398 | 7 | 0.074484% |
| C | 9398 | 16 | 0.170249% |
| D | 9398 | 167 | 1.776974% |
Noise dominated data is calculated using 1-second bins in cleaned event files. If a bin has >2000 counts, and if more than 50% of those come from <1% of pixels, then it is considered to be noise-dominated and hence unusable.
| Quadrant | # 1 sec bins | Bins with >0 counts | Bins with >2000 counts | High rate bins dominated by noise | Noise dominated (total time) | Noise dominated (detector-on time) | Marked lightcurve |
|---|---|---|---|---|---|---|---|
| A | 13194 | 9400 | 20 | 20 | 0.15% | 0.21% | 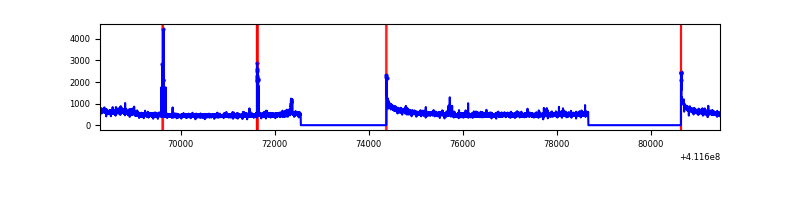 |
| B | 13194 | 9400 | 0 | 0 | 0.00% | 0.00% | 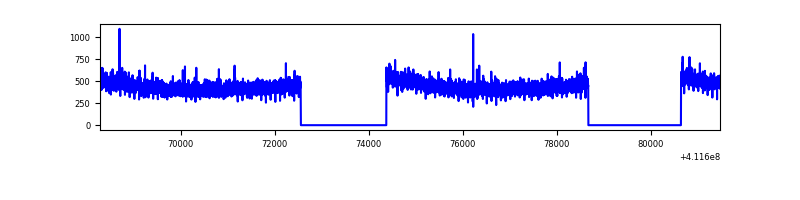 |
| C | 13194 | 9400 | 4 | 4 | 0.03% | 0.04% | 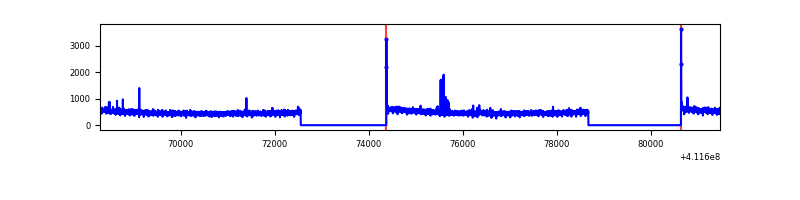 |
| D | 13194 | 9400 | 137 | 137 | 1.04% | 1.46% | 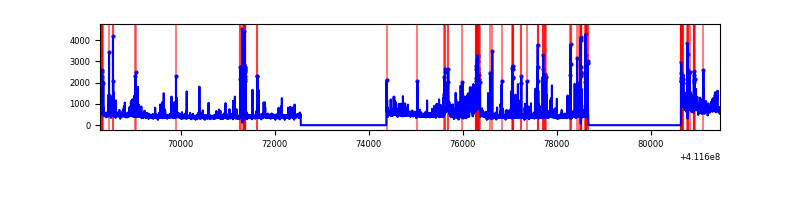 |
Top three noisy pixels from each quadrant. If the there are fewer than three noisy pixels in the level2.evt file, extra rows are filled as -1
| Pixel properties | Quadrant properties | ||||||
|---|---|---|---|---|---|---|---|
| Quadrant | DetID | PixID | Counts | Sigma | Mean | Median | Sigma |
| A | 10 | 83 | 666494 | 3185.61 | 1042 | 1021 | 208.9 |
| A | 6 | 10 | 153428 | 729.57 | 1042 | 1021 | 208.9 |
| A | 15 | 174 | 82200 | 388.6 | 1042 | 1021 | 208.9 |
| B | 12 | 111 | 24635 | 120.1 | 1047 | 1017 | 196.7 |
| B | 11 | 111 | 22426 | 108.87 | 1047 | 1017 | 196.7 |
| B | 14 | 111 | 21329 | 103.29 | 1047 | 1017 | 196.7 |
| C | 15 | 214 | 389255 | 1636.33 | 1037 | 1047 | 237.2 |
| C | 3 | 233 | 38592 | 158.26 | 1037 | 1047 | 237.2 |
| C | 0 | 10 | 22346 | 89.78 | 1037 | 1047 | 237.2 |
| D | 12 | 227 | 802342 | 3217.61 | 1022 | 994 | 249.1 |
| D | 13 | 249 | 331371 | 1326.54 | 1022 | 994 | 249.1 |
| D | 2 | 249 | 108401 | 431.27 | 1022 | 994 | 249.1 |
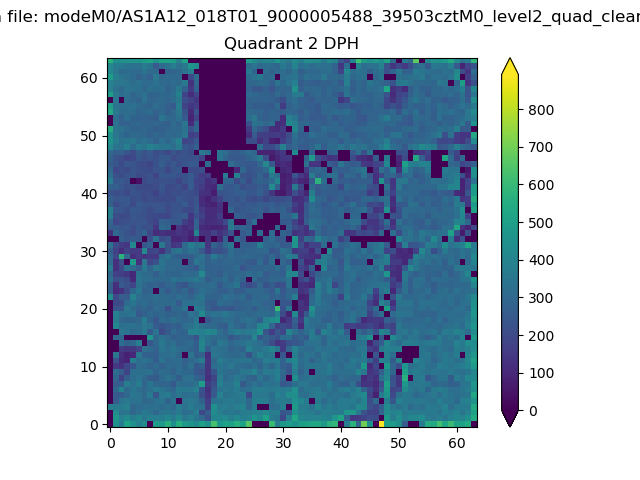
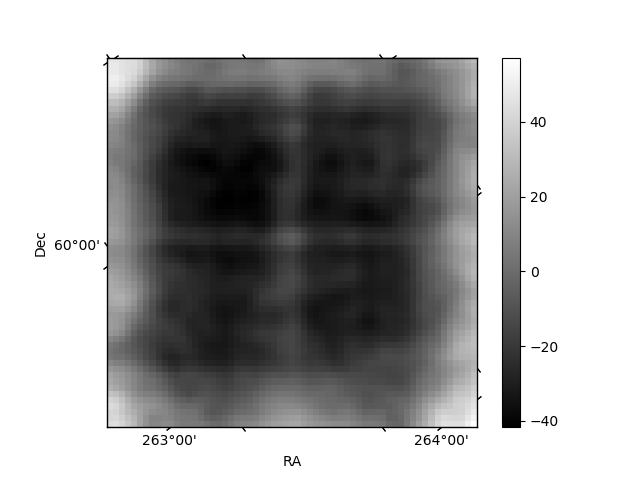
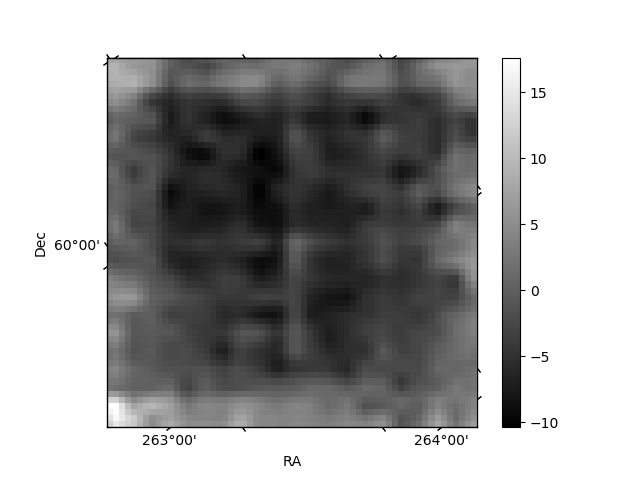
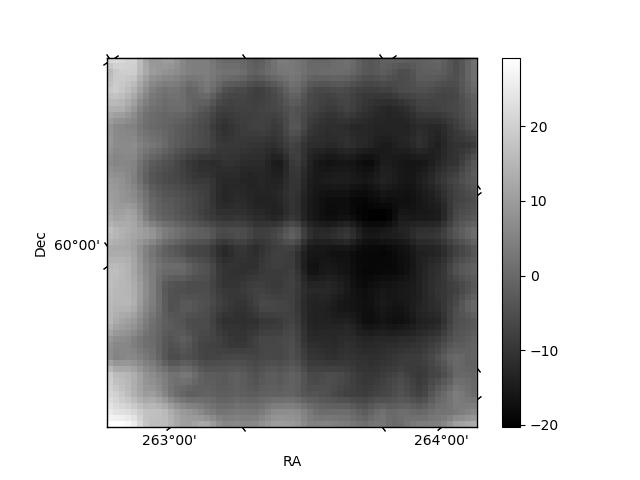
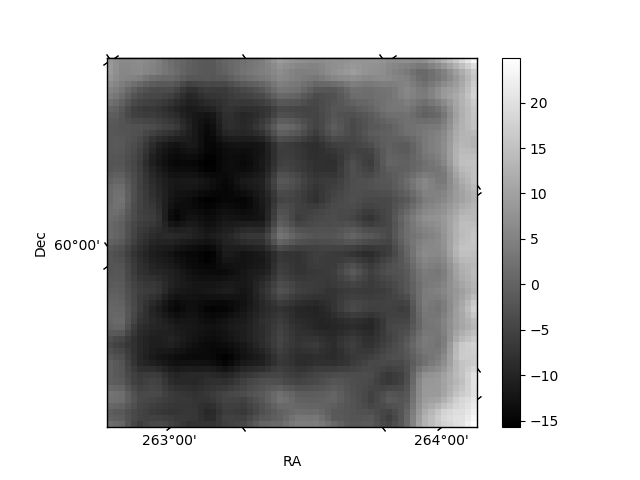
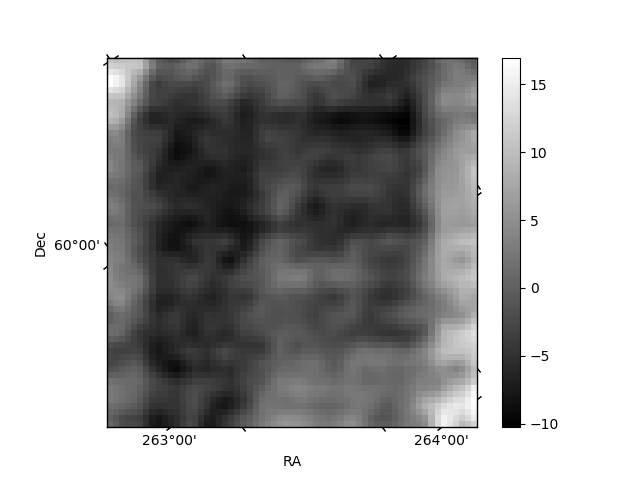
Histogram calculated using DETX and DETY for each event in the final _common_clean file
| Quadrant A | 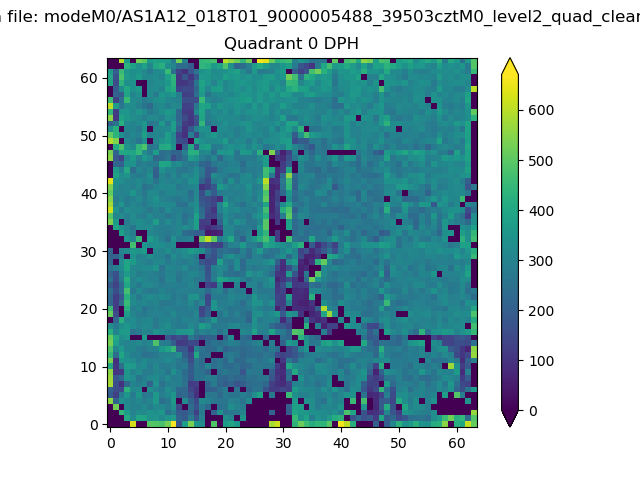 |
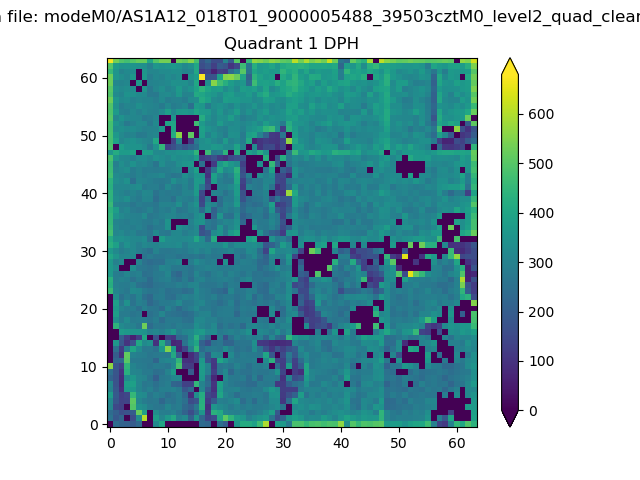 |
Quadrant B |
|---|---|---|---|
| Quadrant D | 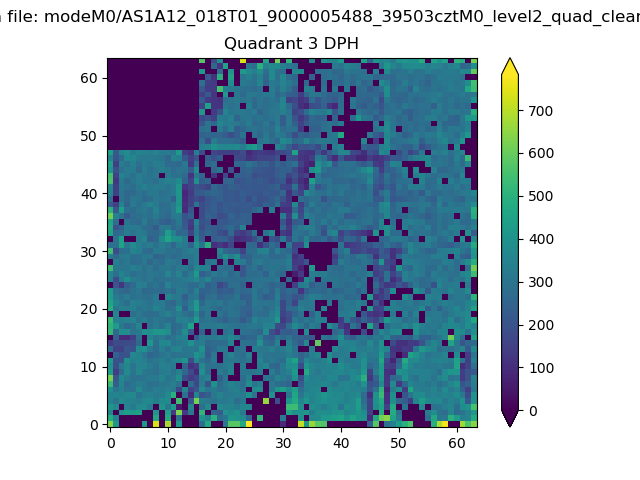 |
 |
Quadrant C |
| Plot type | Count rate plots | Images |
|---|---|---|
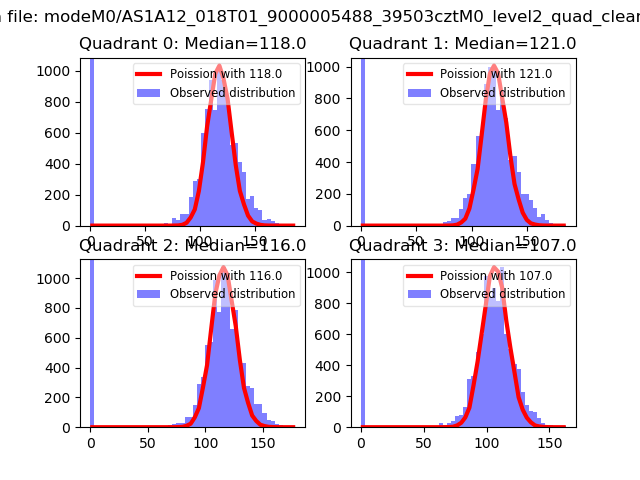
| Comparison with Poisson distribution Blue bars denote a histogram of data divided into 1 sec bins. Red curve is a Poisson curve with rate = median count rate of data. |
 |
 |
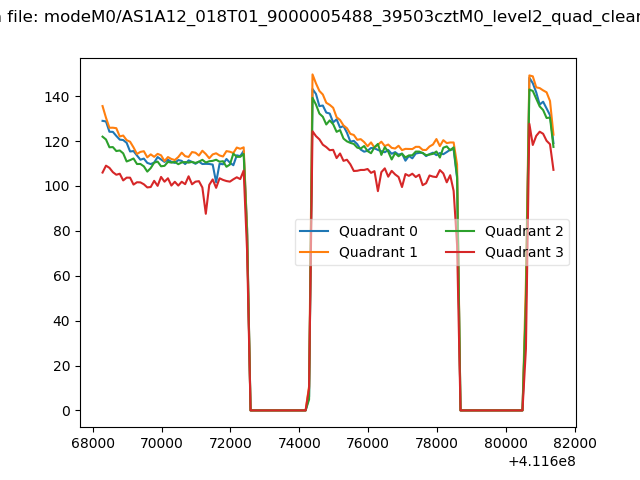
| Quadrant-wise count rates Data is divided into 100 sec bins |
 |
|
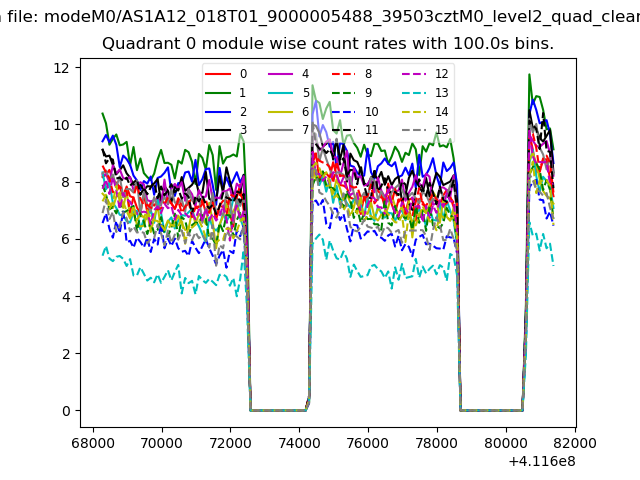
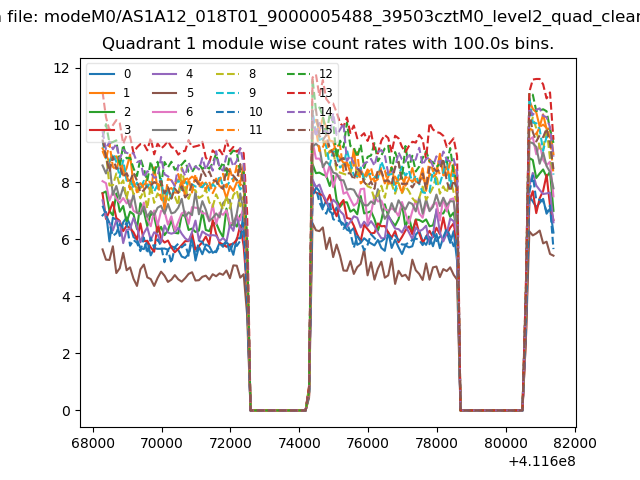
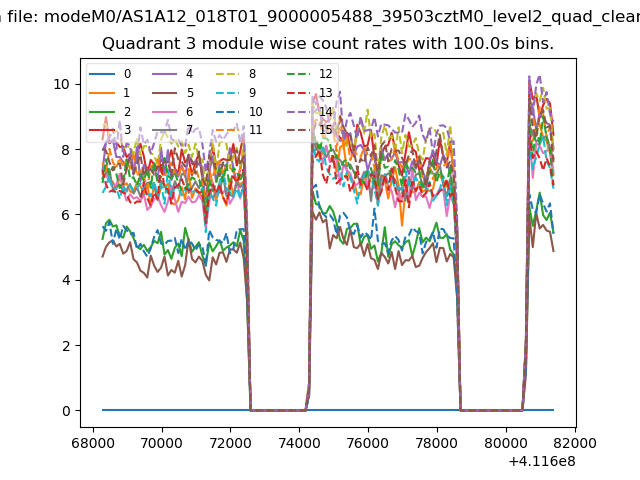
| Module-wise count rates for Quadrant A Data is divided into 100 sec bins |
 |
 |
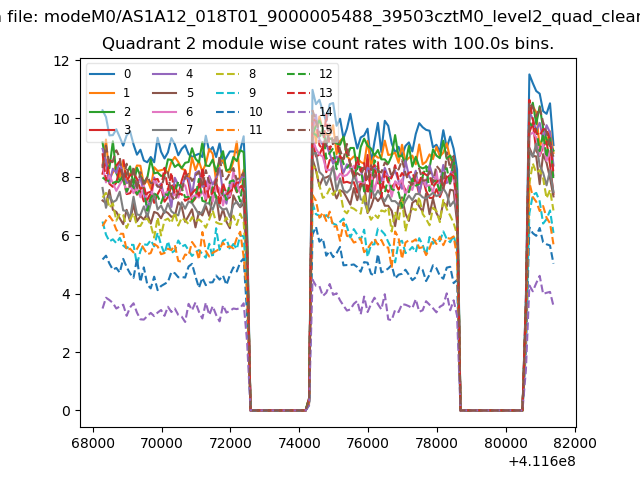
| Module-wise count rates for Quadrant B Data is divided into 100 sec bins |
 |
 |
| Module-wise count rates for Quadrant C Data is divided into 100 sec bins |
 |
 |
| Module-wise count rates for Quadrant D Data is divided into 100 sec bins |
 |
 |
| Parameter | Plot |
|---|---|
| CZT HV Monitor | 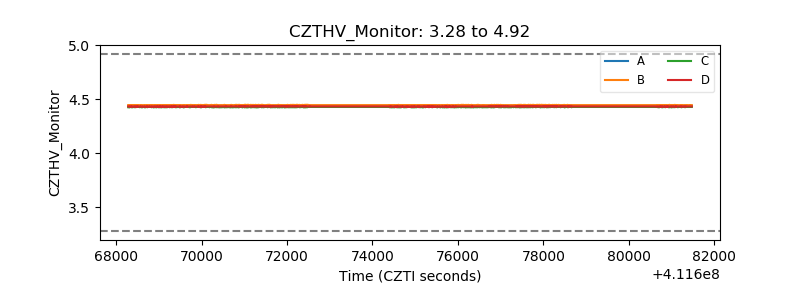 |
| D_VDD | 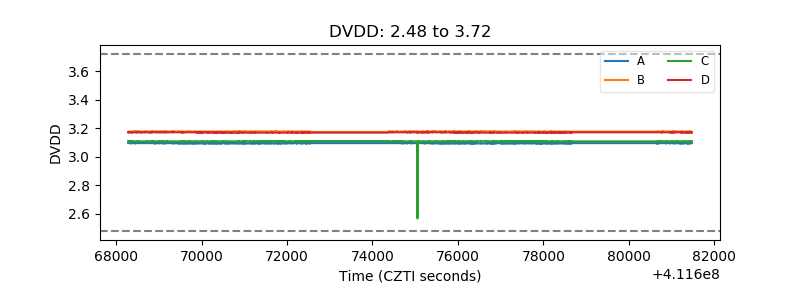 |
| Temperature 1 | 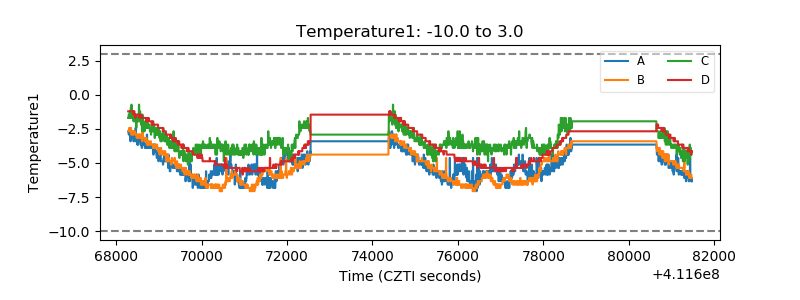 |
| Veto HV Monitor | 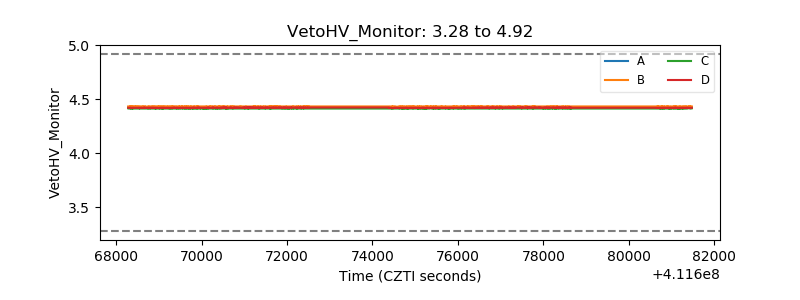 |
| Veto LLD | 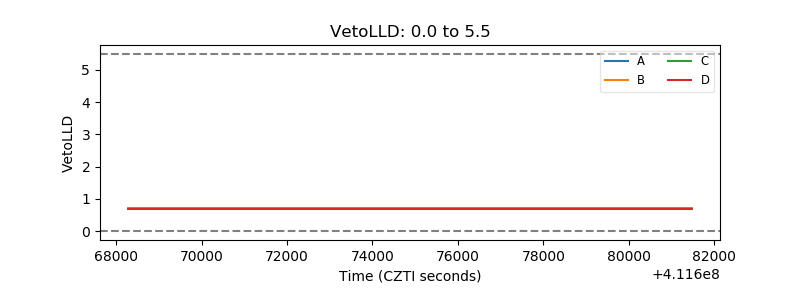 |
| Alpha Counter | 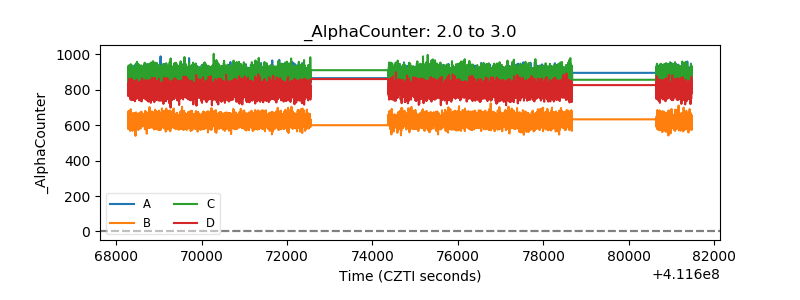 |
| _CPM_Rate | 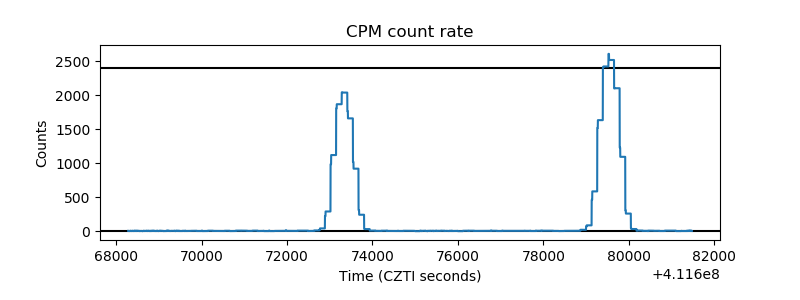 |
| CZT Counter | 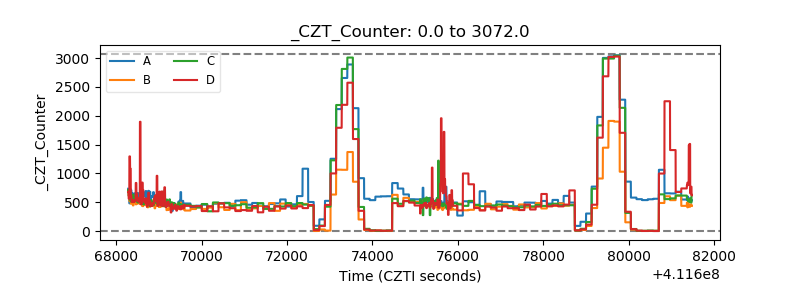 |
| +2.5 Volts monitor | 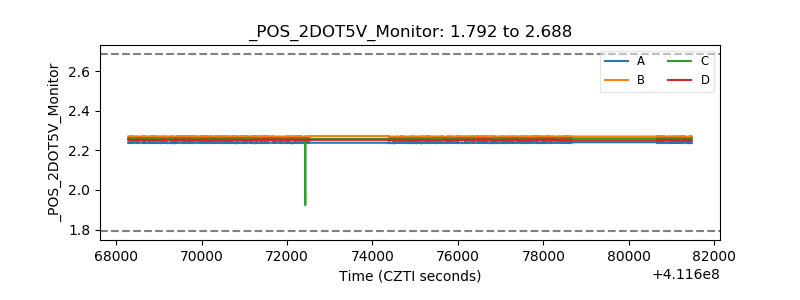 |
| +5 Volts monitor | 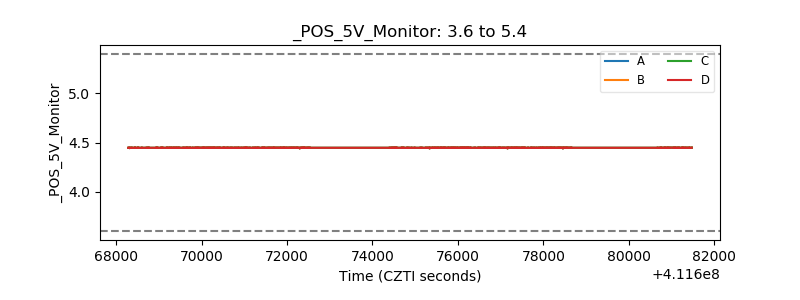 |
| _ROLL_ROT | 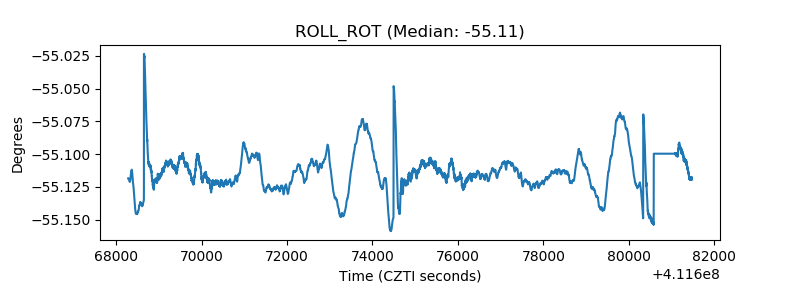 |
| _Roll_DEC | 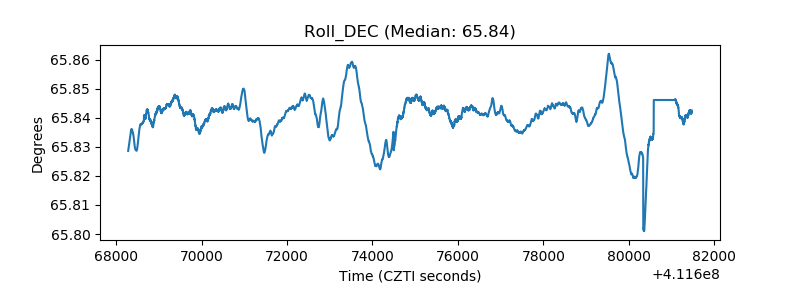 |
| _Roll_RA | 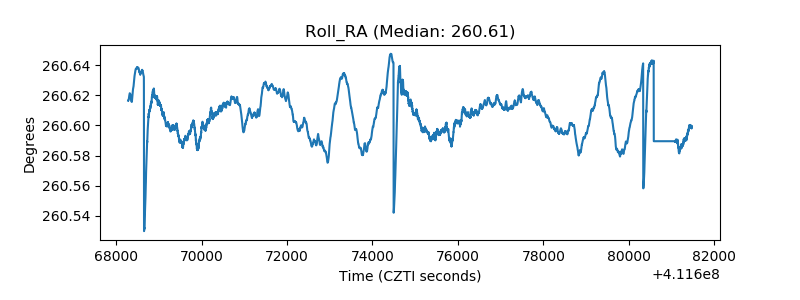 |
| Veto Counter | 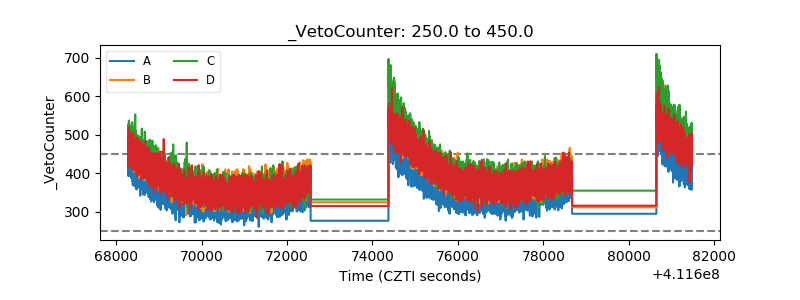 |