| Param | Original file | Final file |
|---|---|---|
| Filename | modeM0/AS1A12_018T01_9000005488_39504cztM0_level2.fits | modeM0/AS1A12_018T01_9000005488_39504cztM0_level2_quad_clean.evt |
| Size (bytes) | 320,621,760 | 91,010,880 |
| Size | 305.8 MB | 86.8 MB |
| Events in quadrant A | 2,824,524 | 613,881 |
| Events in quadrant B | 2,266,969 | 638,357 |
| Events in quadrant C | 2,437,163 | 615,079 |
| Events in quadrant D | 3,955,171 | 542,569 |
| Mode SS | |||
|---|---|---|---|
| Quadrant | BADHDUFLAG | Total packets | Discarded packets |
| A | 0 | 100 | 0 |
| B | 0 | 100 | 0 |
| C | 0 | 100 | 0 |
| D | 0 | 100 | 0 |
| Mode M0 | |||
|---|---|---|---|
| Quadrant | BADHDUFLAG | Total packets | Discarded packets |
| A | 0 | 11496 | 3 |
| B | 0 | 10070 | 2 |
| C | 0 | 10225 | 2 |
| D | 0 | 15054 | 2 |
| Mode M9 | |||
|---|---|---|---|
| Quadrant | BADHDUFLAG | Total packets | Discarded packets |
| A | 0 | 32 | 0 |
| B | 0 | 32 | 0 |
| C | 0 | 32 | 0 |
| D | 0 | 33 | 0 |
| Quadrant | Total seconds | Saturated seconds | Saturation percentage |
|---|---|---|---|
| A | 4937 | 21 | 0.425360% |
| B | 4937 | 4 | 0.081021% |
| C | 4937 | 6 | 0.121531% |
| D | 4937 | 246 | 4.982783% |
Noise dominated data is calculated using 1-second bins in cleaned event files. If a bin has >2000 counts, and if more than 50% of those come from <1% of pixels, then it is considered to be noise-dominated and hence unusable.
| Quadrant | # 1 sec bins | Bins with >0 counts | Bins with >2000 counts | High rate bins dominated by noise | Noise dominated (total time) | Noise dominated (detector-on time) | Marked lightcurve |
|---|---|---|---|---|---|---|---|
| A | 7000 | 4938 | 12 | 12 | 0.17% | 0.24% | 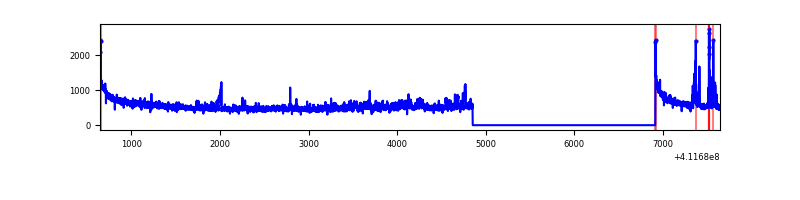 |
| B | 7000 | 4938 | 3 | 3 | 0.04% | 0.06% | 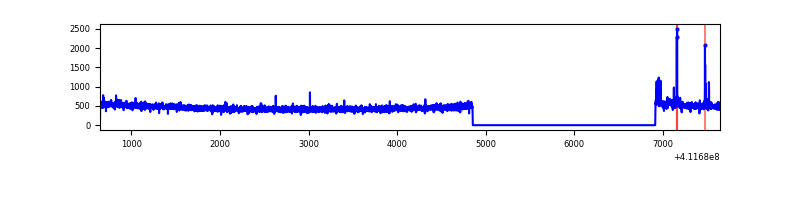 |
| C | 7000 | 4938 | 3 | 3 | 0.04% | 0.06% | 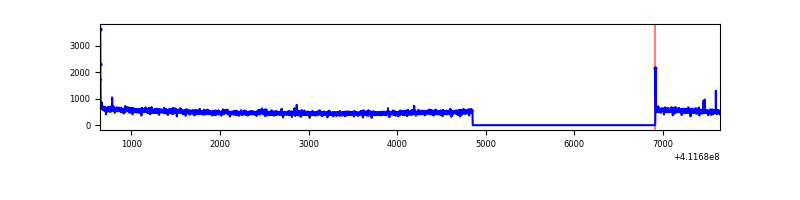 |
| D | 7000 | 4938 | 231 | 231 | 3.30% | 4.68% | 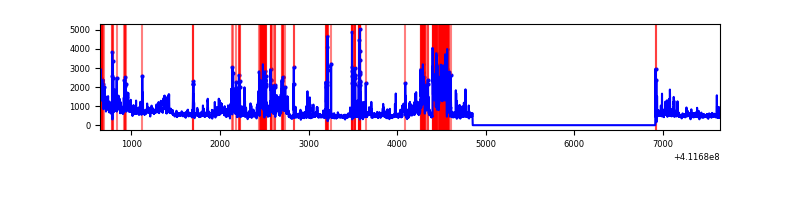 |
Top three noisy pixels from each quadrant. If the there are fewer than three noisy pixels in the level2.evt file, extra rows are filled as -1
| Pixel properties | Quadrant properties | ||||||
|---|---|---|---|---|---|---|---|
| Quadrant | DetID | PixID | Counts | Sigma | Mean | Median | Sigma |
| A | 10 | 83 | 407686 | 3574.89 | 562 | 552 | 113.9 |
| A | 6 | 10 | 144979 | 1268.16 | 562 | 552 | 113.9 |
| A | 9 | 143 | 60472 | 526.14 | 562 | 552 | 113.9 |
| B | 5 | 172 | 32214 | 298.24 | 566 | 553 | 106.2 |
| B | 12 | 111 | 12888 | 116.19 | 566 | 553 | 106.2 |
| B | 11 | 111 | 11968 | 107.53 | 566 | 553 | 106.2 |
| C | 15 | 214 | 208704 | 1615.39 | 560 | 566 | 128.8 |
| C | 3 | 233 | 25061 | 190.11 | 560 | 566 | 128.8 |
| C | 0 | 10 | 16616 | 124.57 | 560 | 566 | 128.8 |
| D | 12 | 227 | 653510 | 4907.76 | 545 | 531 | 133.1 |
| D | 2 | 249 | 422705 | 3173.04 | 545 | 531 | 133.1 |
| D | 12 | 0 | 359738 | 2699.78 | 545 | 531 | 133.1 |
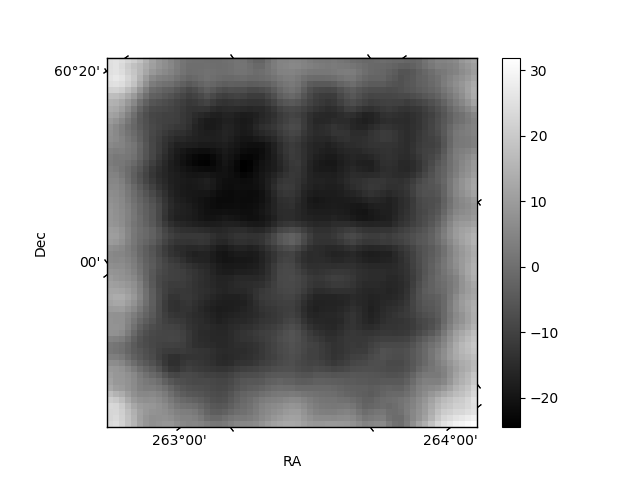
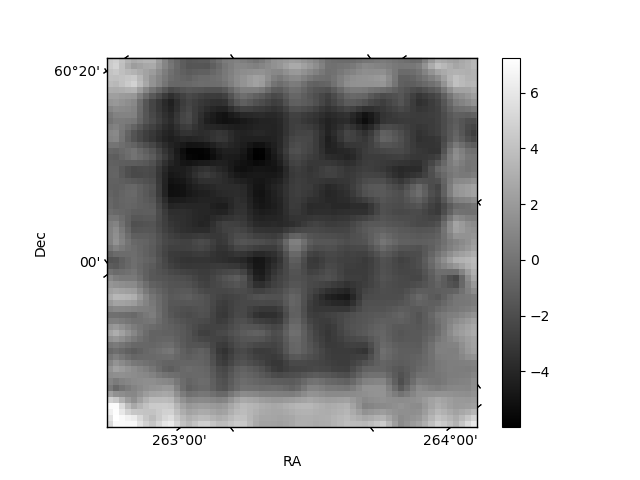
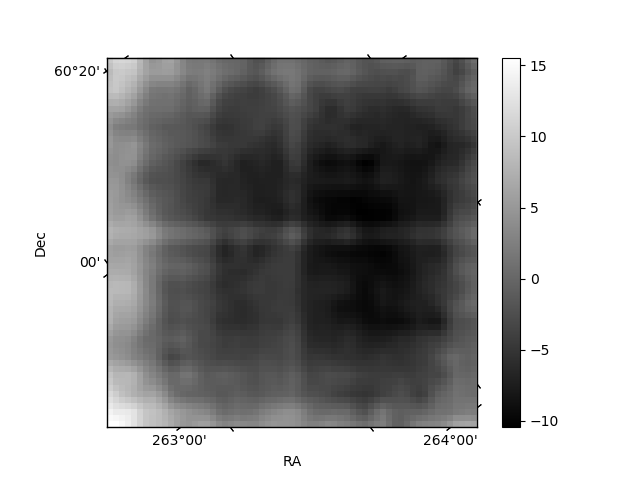
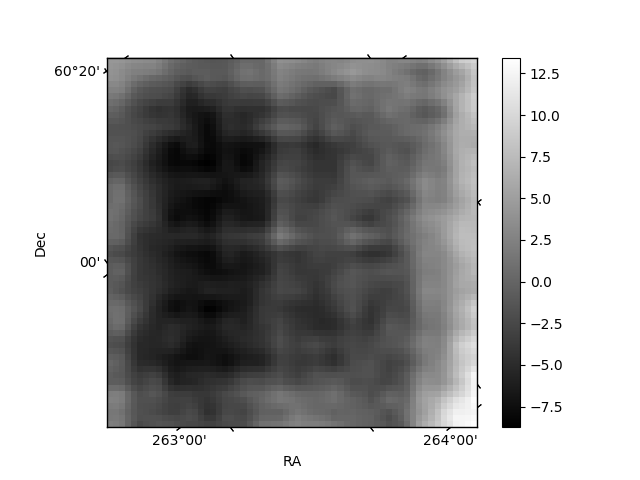
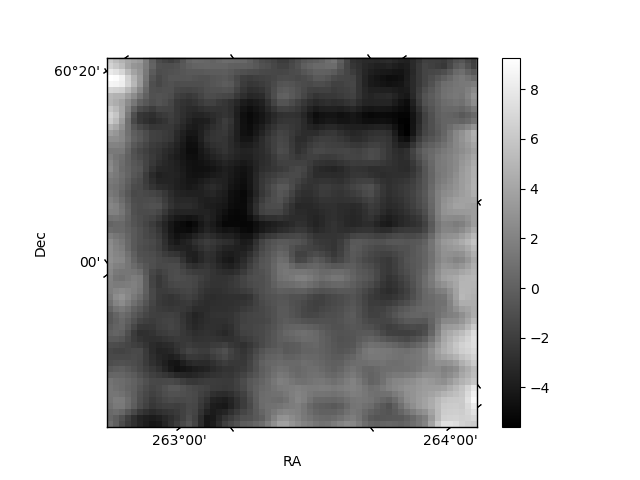
Histogram calculated using DETX and DETY for each event in the final _common_clean file
| Quadrant A | 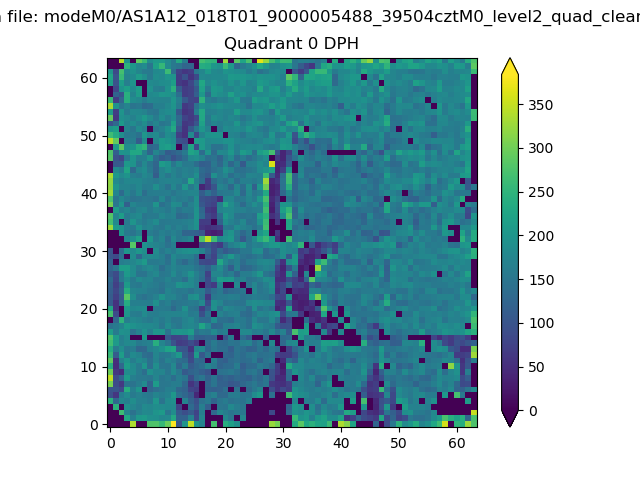 |
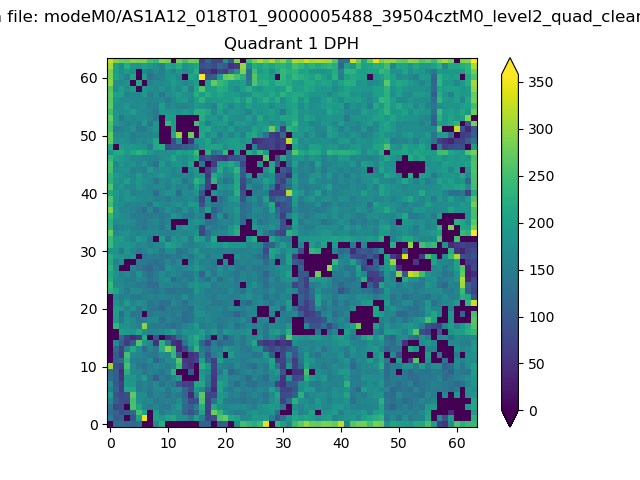 |
Quadrant B |
|---|---|---|---|
| Quadrant D | 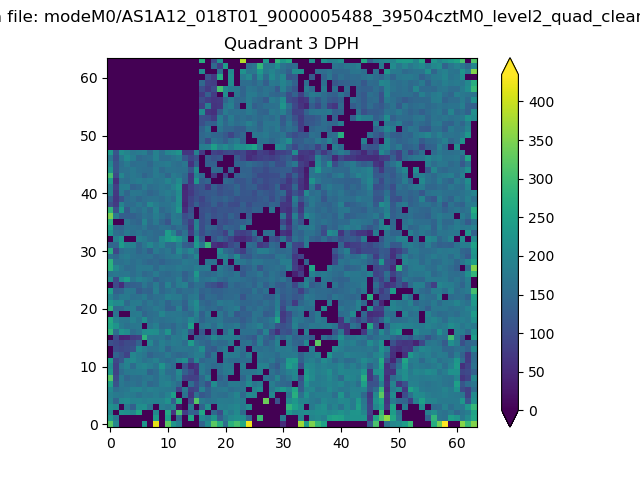 |
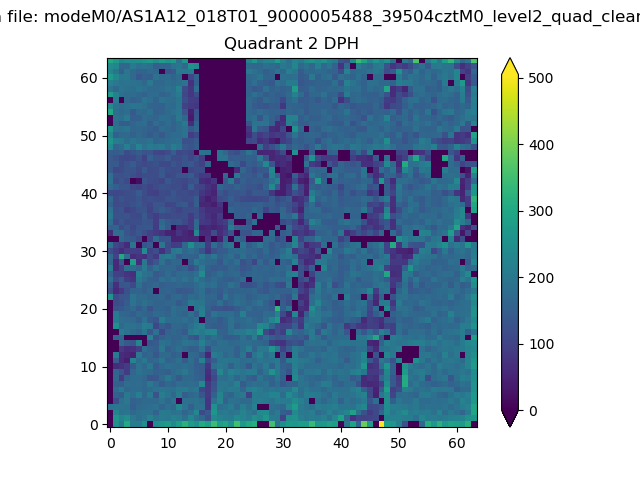 |
Quadrant C |
| Plot type | Count rate plots | Images |
|---|---|---|
| Comparison with Poisson distribution Blue bars denote a histogram of data divided into 1 sec bins. Red curve is a Poisson curve with rate = median count rate of data. |
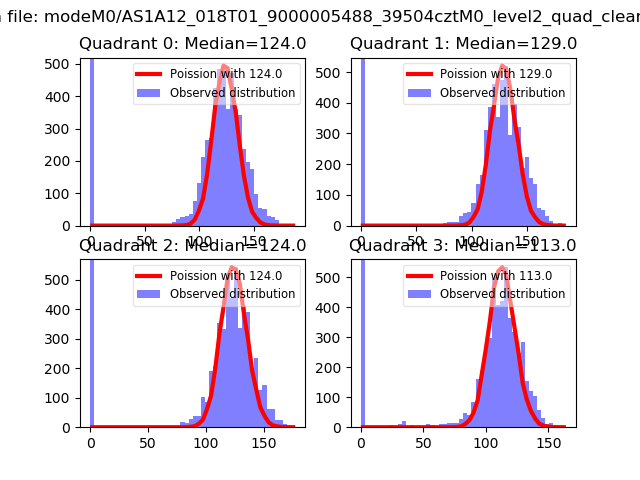 |
 |
| Quadrant-wise count rates Data is divided into 100 sec bins |
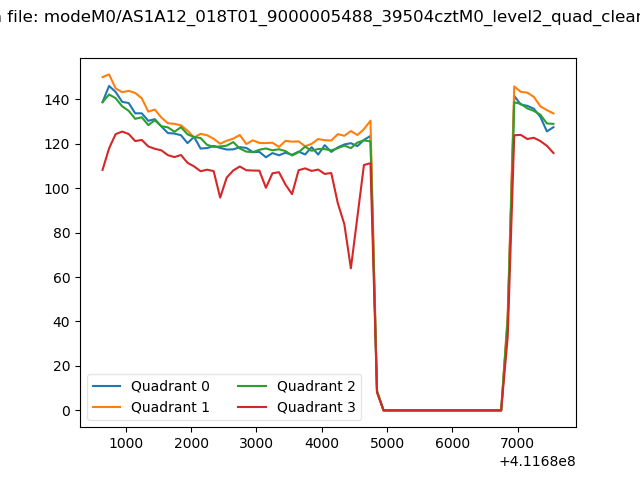 |
|
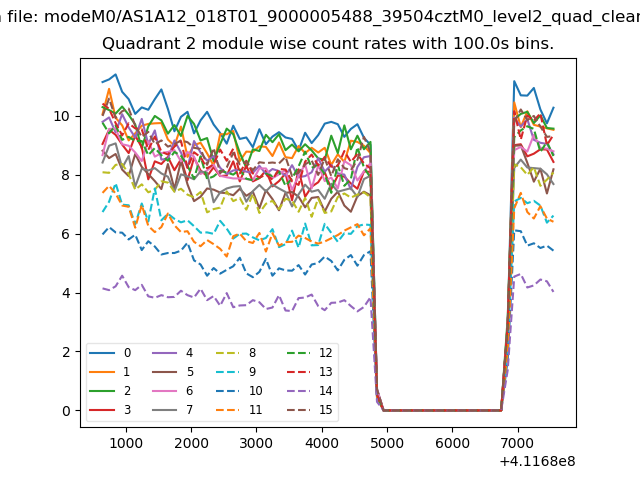
| Module-wise count rates for Quadrant A Data is divided into 100 sec bins |
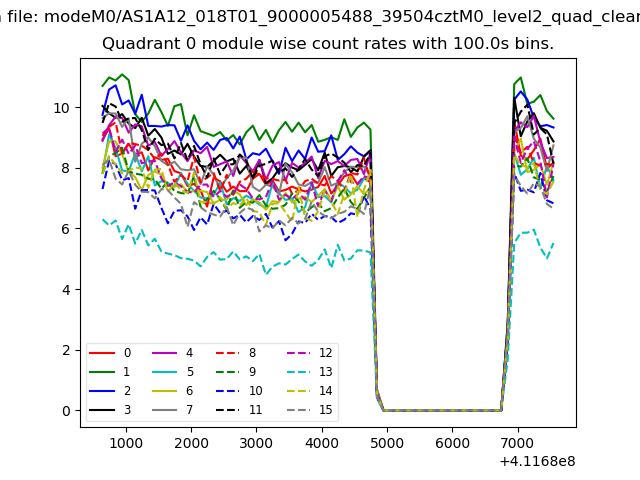 |
 |
| Module-wise count rates for Quadrant B Data is divided into 100 sec bins |
 |
 |
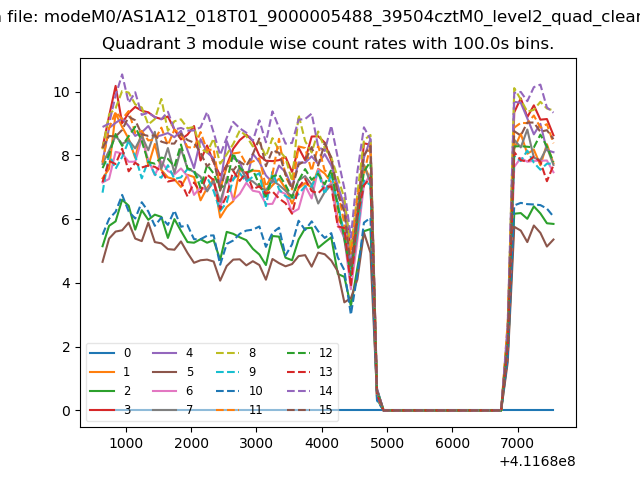
| Module-wise count rates for Quadrant C Data is divided into 100 sec bins |
 |
 |
| Module-wise count rates for Quadrant D Data is divided into 100 sec bins |
 |
 |
| Parameter | Plot |
|---|---|
| CZT HV Monitor |  |
| D_VDD | 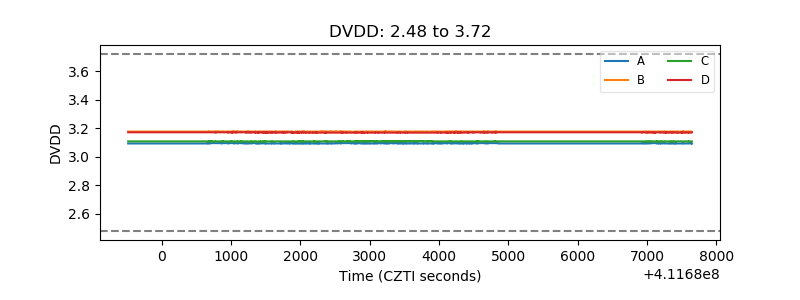 |
| Temperature 1 | 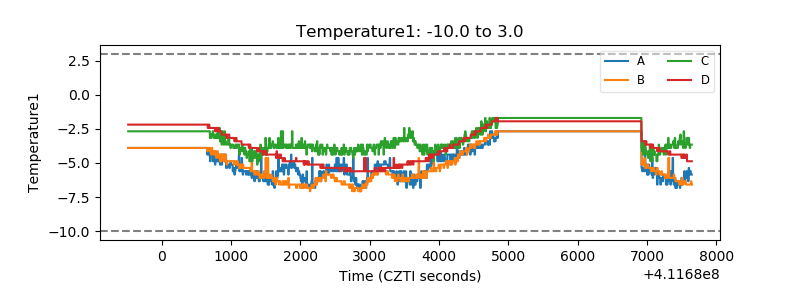 |
| Veto HV Monitor | 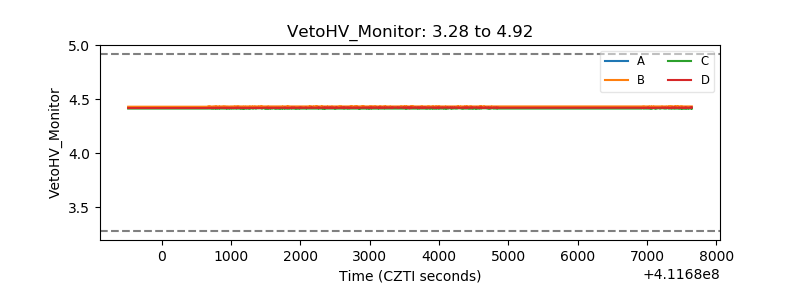 |
| Veto LLD | 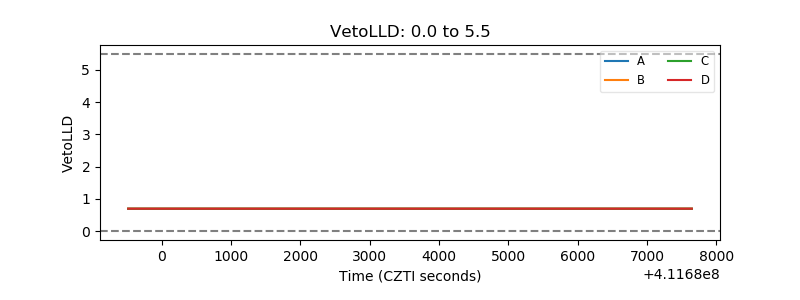 |
| Alpha Counter | 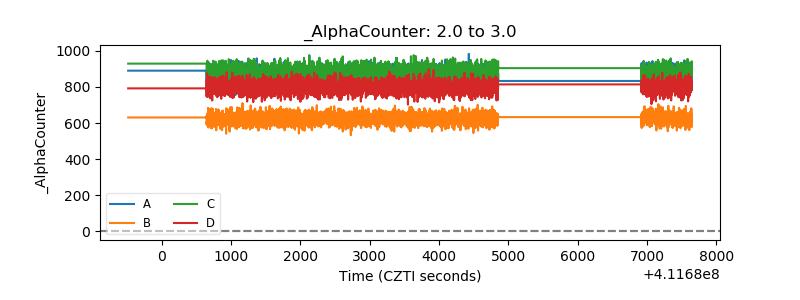 |
| _CPM_Rate | 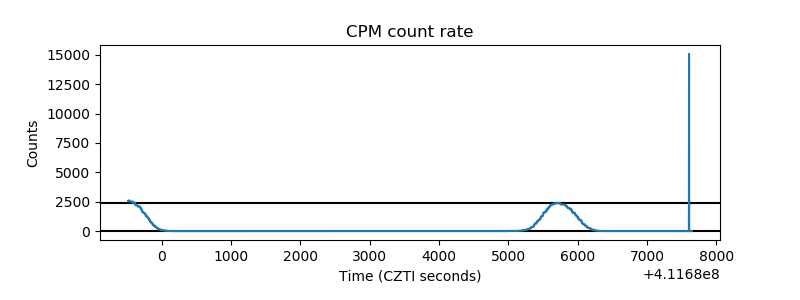 |
| CZT Counter | 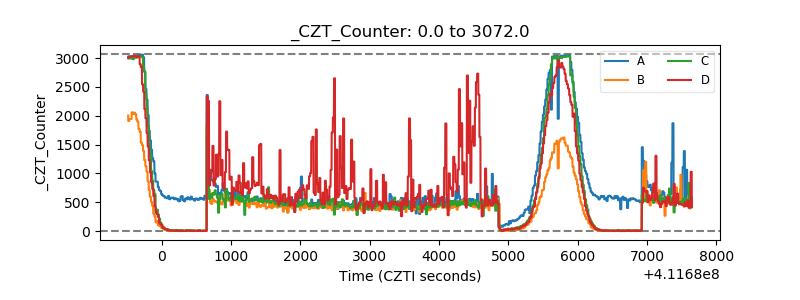 |
| +2.5 Volts monitor | 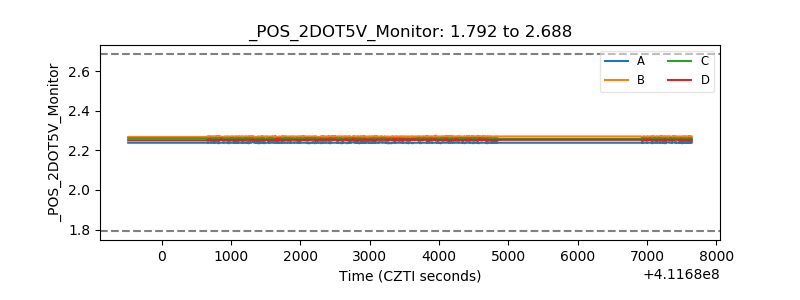 |
| +5 Volts monitor | 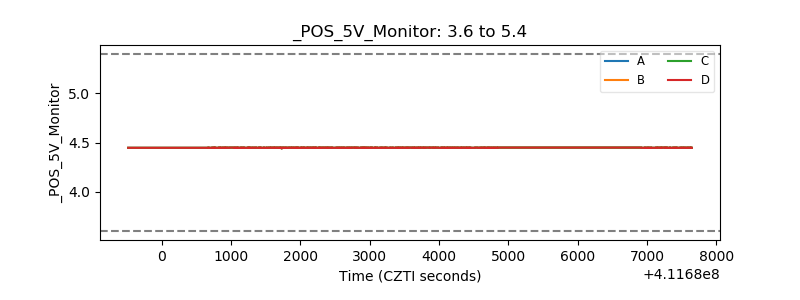 |
| _ROLL_ROT | 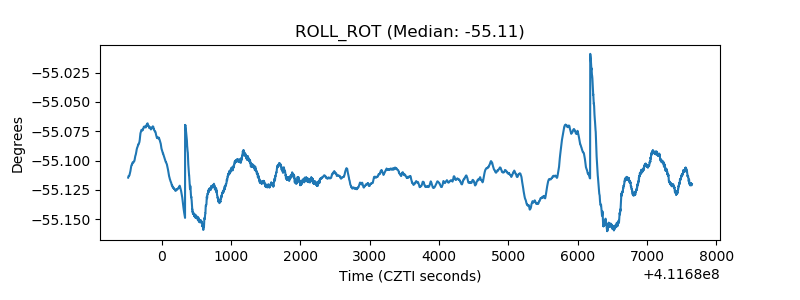 |
| _Roll_DEC | 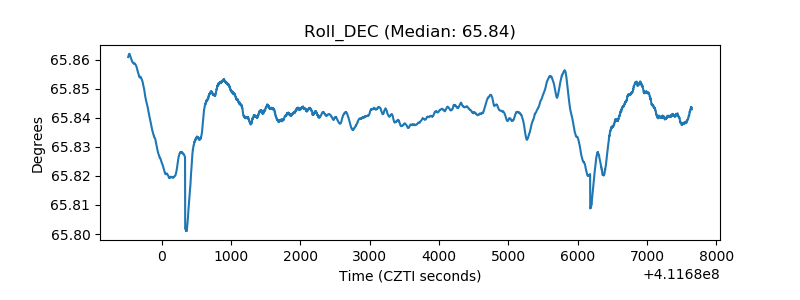 |
| _Roll_RA | 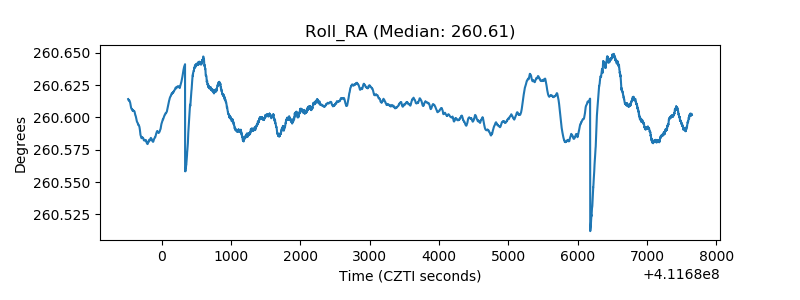 |
| Veto Counter | 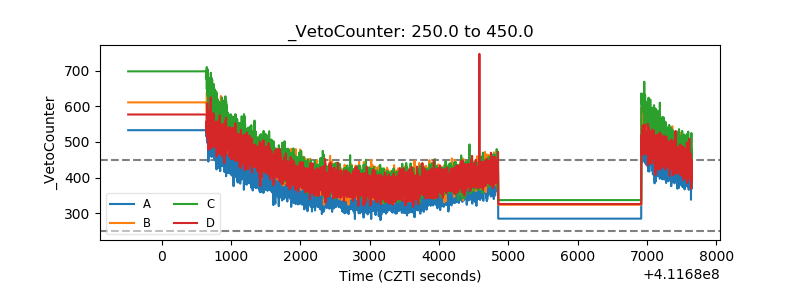 |