| Param | Original file | Final file |
|---|---|---|
| Filename | modeM0/AS1A12_018T01_9000005488_39505cztM0_level2.fits | modeM0/AS1A12_018T01_9000005488_39505cztM0_level2_quad_clean.evt |
| Size (bytes) | 307,402,560 | 85,815,360 |
| Size | 293.2 MB | 81.8 MB |
| Events in quadrant A | 2,650,138 | 582,210 |
| Events in quadrant B | 2,952,077 | 572,526 |
| Events in quadrant C | 2,605,823 | 581,413 |
| Events in quadrant D | 2,796,636 | 525,622 |
| Mode SS | |||
|---|---|---|---|
| Quadrant | BADHDUFLAG | Total packets | Discarded packets |
| A | 0 | 98 | 0 |
| B | 0 | 98 | 0 |
| C | 0 | 98 | 0 |
| D | 0 | 98 | 0 |
| Mode M0 | |||
|---|---|---|---|
| Quadrant | BADHDUFLAG | Total packets | Discarded packets |
| A | 0 | 10907 | 3 |
| B | 0 | 12061 | 2 |
| C | 0 | 10685 | 2 |
| D | 0 | 11742 | 2 |
| Mode M9 | |||
|---|---|---|---|
| Quadrant | BADHDUFLAG | Total packets | Discarded packets |
| A | 0 | 35 | 0 |
| B | 0 | 35 | 0 |
| C | 0 | 35 | 0 |
| D | 0 | 36 | 0 |
| Quadrant | Total seconds | Saturated seconds | Saturation percentage |
|---|---|---|---|
| A | 4799 | 20 | 0.416753% |
| B | 4799 | 326 | 6.793082% |
| C | 4799 | 53 | 1.104397% |
| D | 4799 | 114 | 2.375495% |
Noise dominated data is calculated using 1-second bins in cleaned event files. If a bin has >2000 counts, and if more than 50% of those come from <1% of pixels, then it is considered to be noise-dominated and hence unusable.
| Quadrant | # 1 sec bins | Bins with >0 counts | Bins with >2000 counts | High rate bins dominated by noise | Noise dominated (total time) | Noise dominated (detector-on time) | Marked lightcurve |
|---|---|---|---|---|---|---|---|
| A | 6952 | 4800 | 12 | 12 | 0.17% | 0.25% | 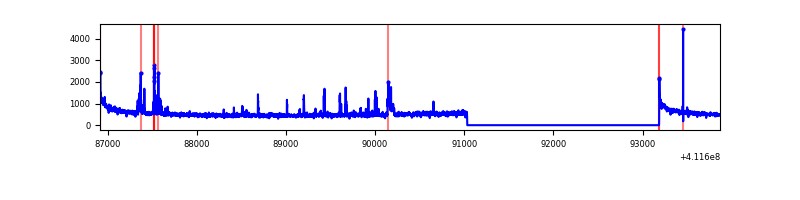 |
| B | 6952 | 4800 | 288 | 288 | 4.14% | 6.00% | 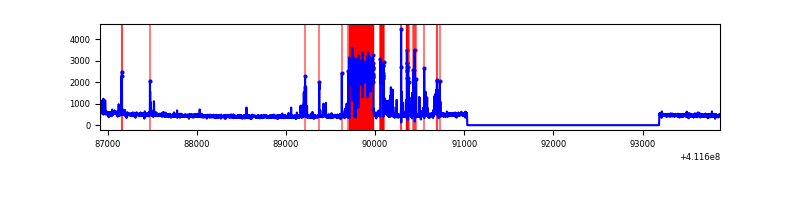 |
| C | 6952 | 4800 | 49 | 49 | 0.70% | 1.02% | 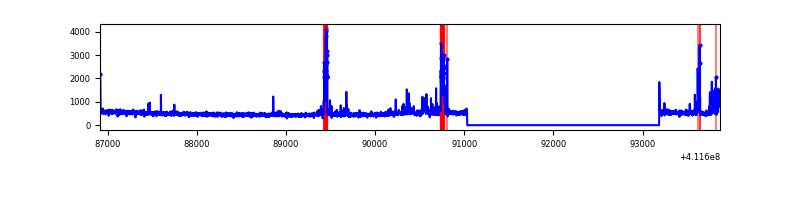 |
| D | 6952 | 4800 | 99 | 99 | 1.42% | 2.06% | 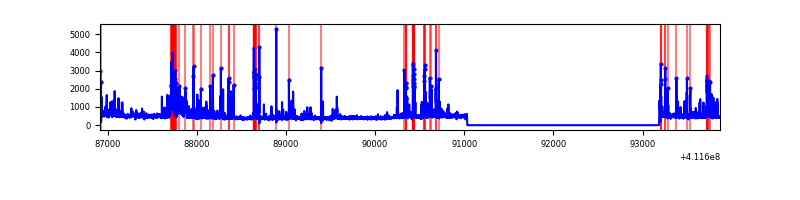 |
Top three noisy pixels from each quadrant. If the there are fewer than three noisy pixels in the level2.evt file, extra rows are filled as -1
| Pixel properties | Quadrant properties | ||||||
|---|---|---|---|---|---|---|---|
| Quadrant | DetID | PixID | Counts | Sigma | Mean | Median | Sigma |
| A | 10 | 83 | 395735 | 3690.41 | 532 | 524 | 107.1 |
| A | 2 | 79 | 61813 | 572.31 | 532 | 524 | 107.1 |
| A | 9 | 143 | 58000 | 536.7 | 532 | 524 | 107.1 |
| B | 5 | 172 | 884492 | 8955.42 | 524 | 510 | 98.7 |
| B | 12 | 111 | 12285 | 119.29 | 524 | 510 | 98.7 |
| B | 11 | 111 | 11260 | 108.91 | 524 | 510 | 98.7 |
| C | 9 | 187 | 319775 | 2623.82 | 527 | 531 | 121.7 |
| C | 15 | 214 | 202673 | 1661.38 | 527 | 531 | 121.7 |
| C | 3 | 233 | 13187 | 104.02 | 527 | 531 | 121.7 |
| D | 2 | 249 | 246756 | 1977.03 | 517 | 502 | 124.6 |
| D | 13 | 249 | 243154 | 1948.11 | 517 | 502 | 124.6 |
| D | 12 | 227 | 217047 | 1738.51 | 517 | 502 | 124.6 |
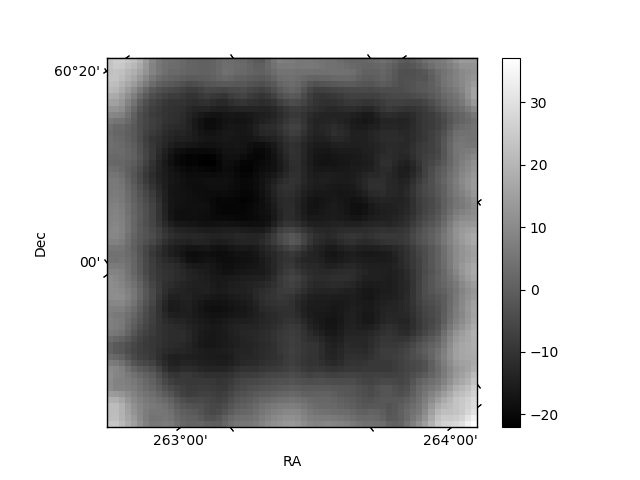
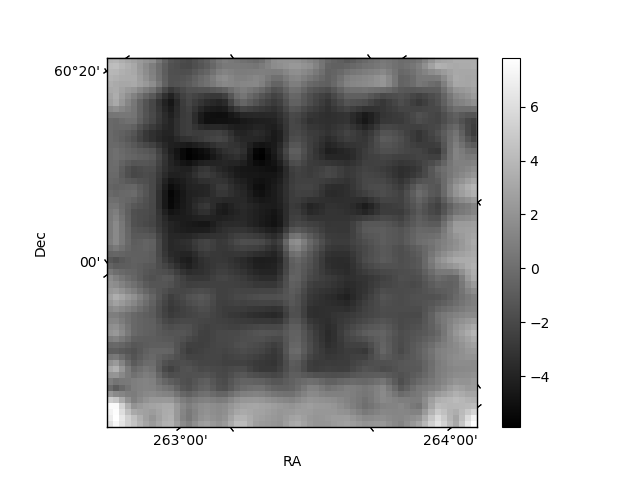
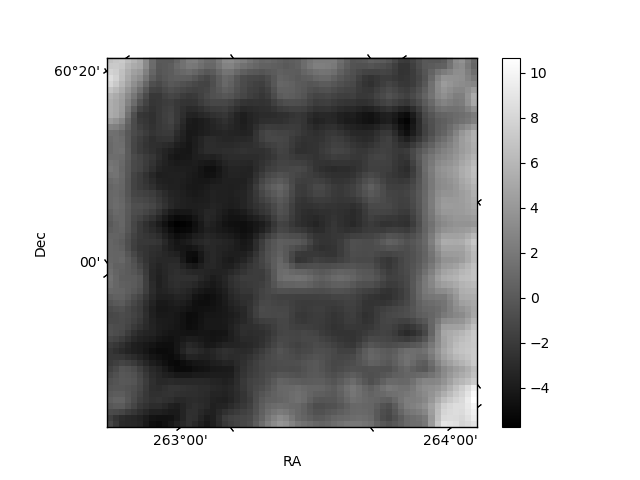
Histogram calculated using DETX and DETY for each event in the final _common_clean file
| Quadrant A | 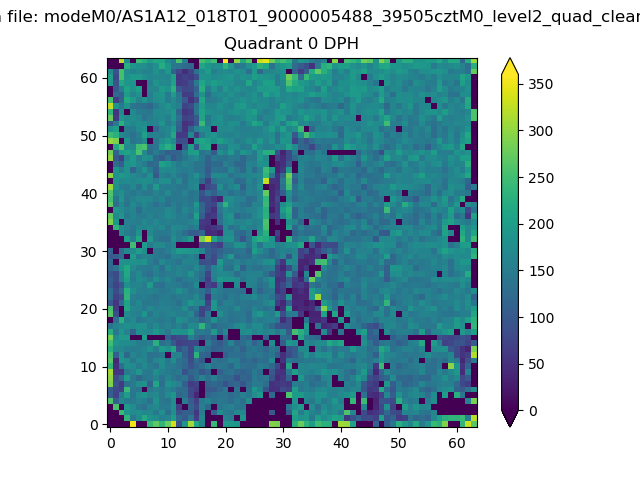 |
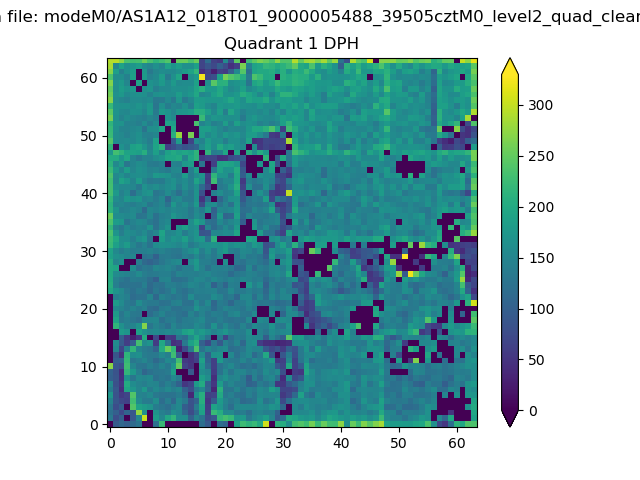 |
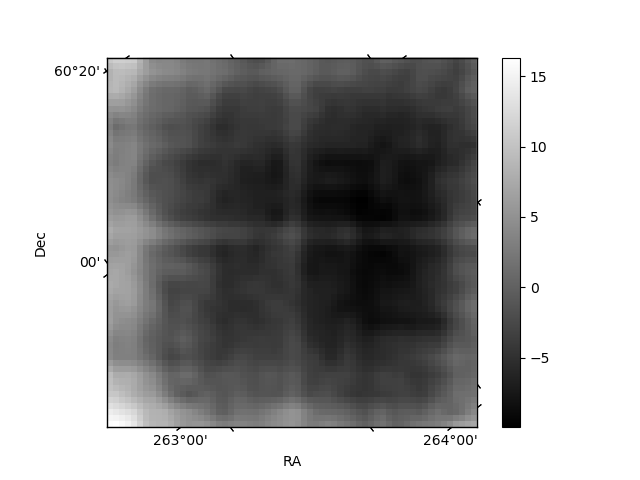
Quadrant B |
|---|---|---|---|
| Quadrant D | 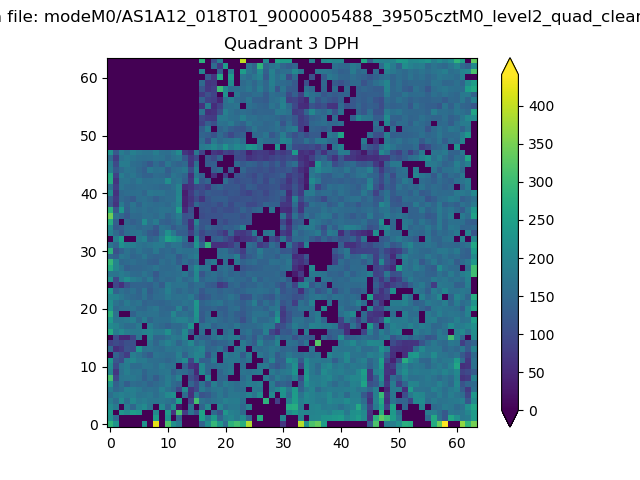 |
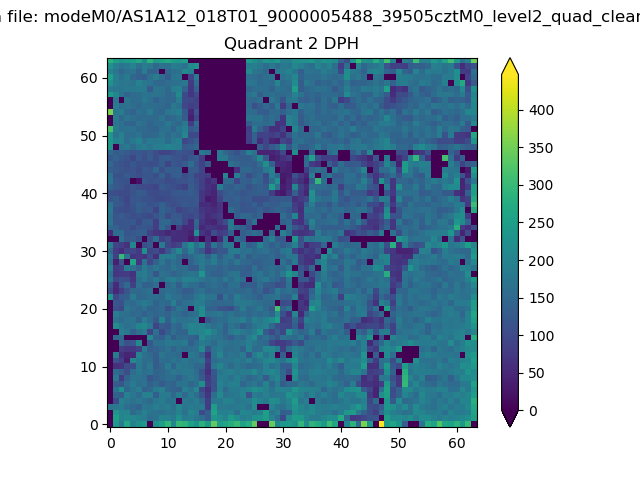 |
Quadrant C |
| Plot type | Count rate plots | Images |
|---|---|---|
| Comparison with Poisson distribution Blue bars denote a histogram of data divided into 1 sec bins. Red curve is a Poisson curve with rate = median count rate of data. |
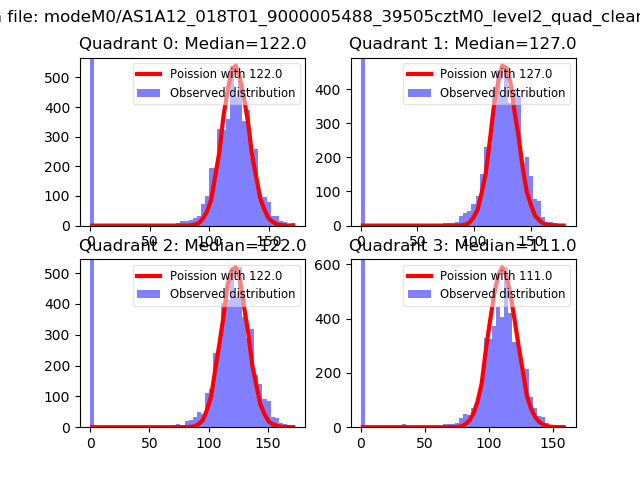 |
 |
| Quadrant-wise count rates Data is divided into 100 sec bins |
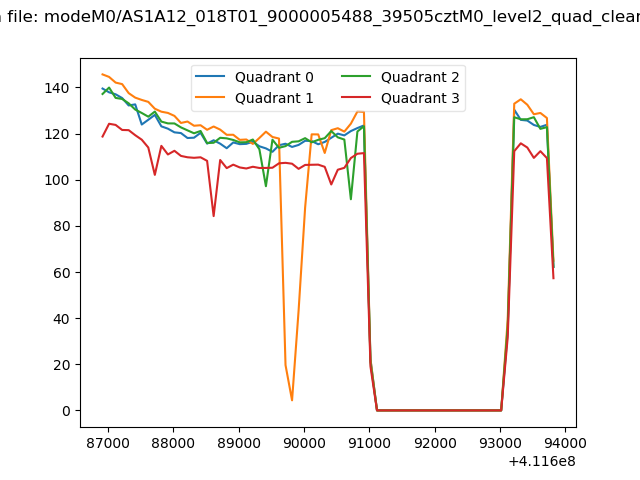 |
|
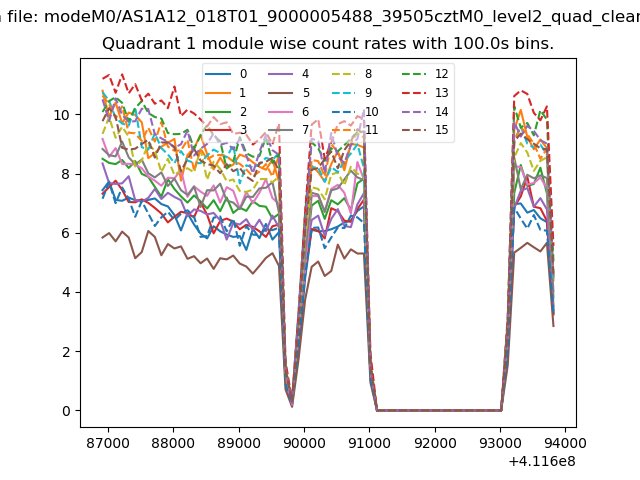
| Module-wise count rates for Quadrant A Data is divided into 100 sec bins |
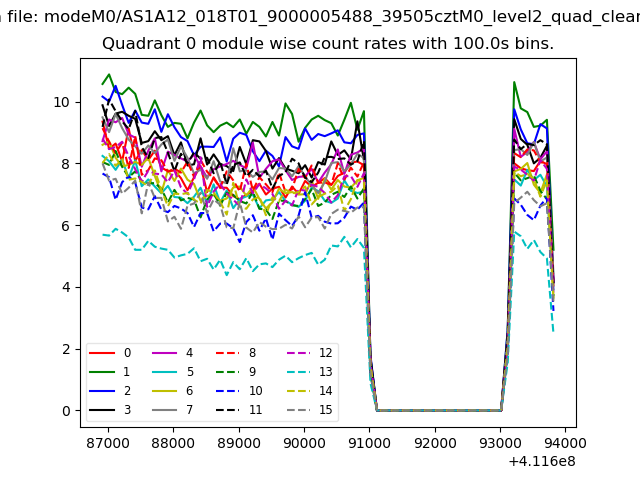 |
 |
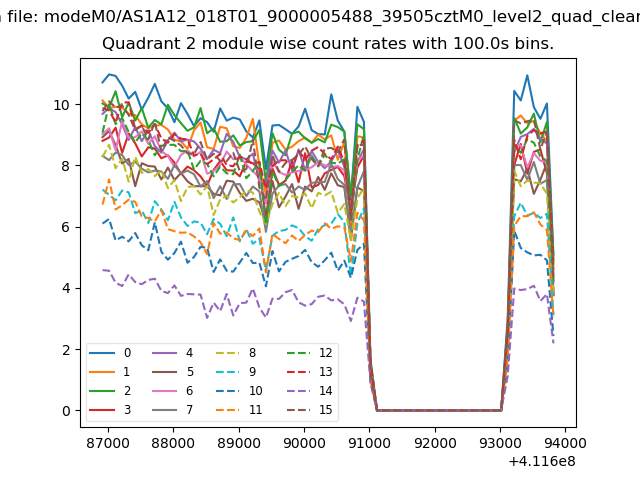
| Module-wise count rates for Quadrant B Data is divided into 100 sec bins |
 |
 |
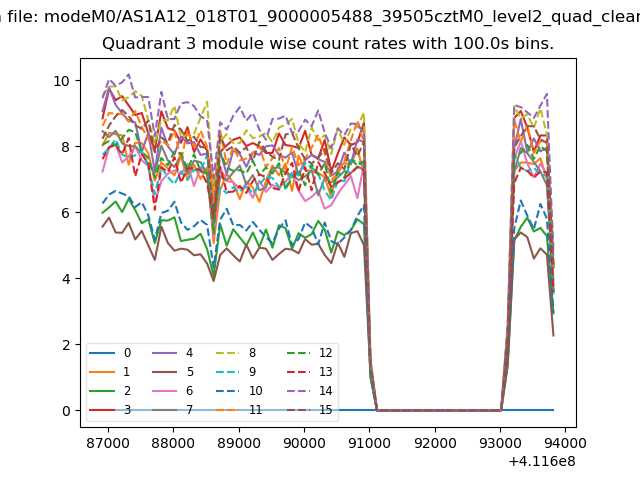
| Module-wise count rates for Quadrant C Data is divided into 100 sec bins |
 |
 |
| Module-wise count rates for Quadrant D Data is divided into 100 sec bins |
 |
 |
| Parameter | Plot |
|---|---|
| CZT HV Monitor | 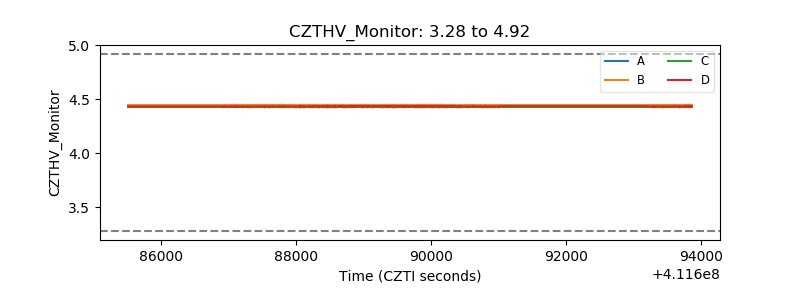 |
| D_VDD | 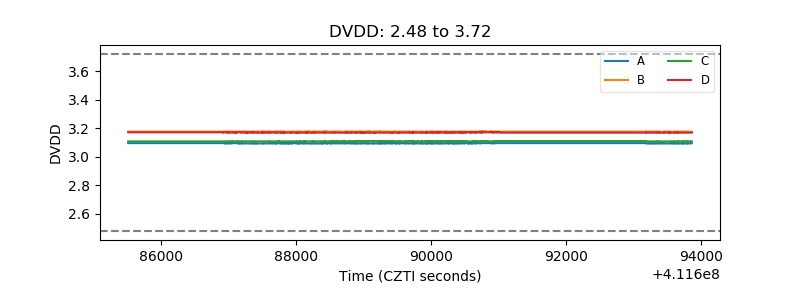 |
| Temperature 1 | 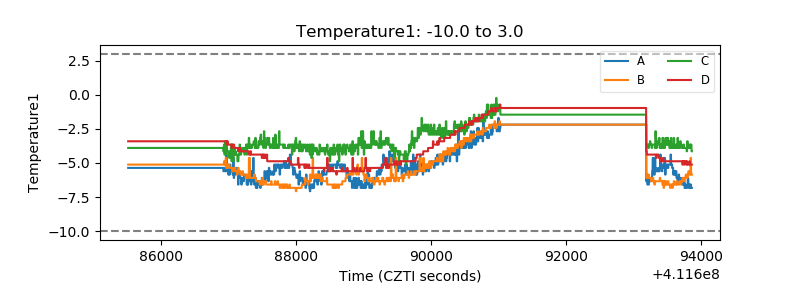 |
| Veto HV Monitor | 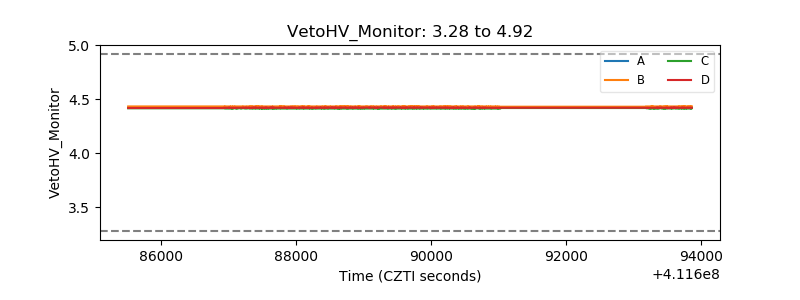 |
| Veto LLD | 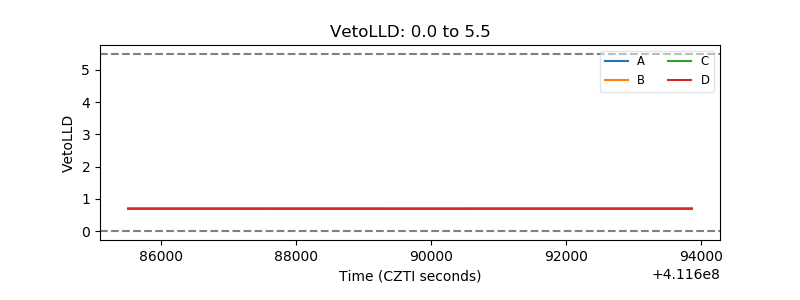 |
| Alpha Counter | 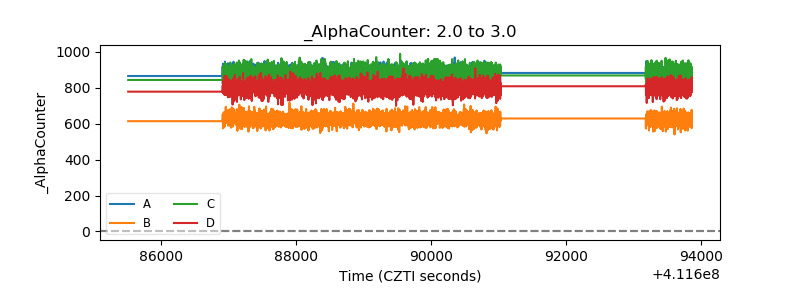 |
| _CPM_Rate | 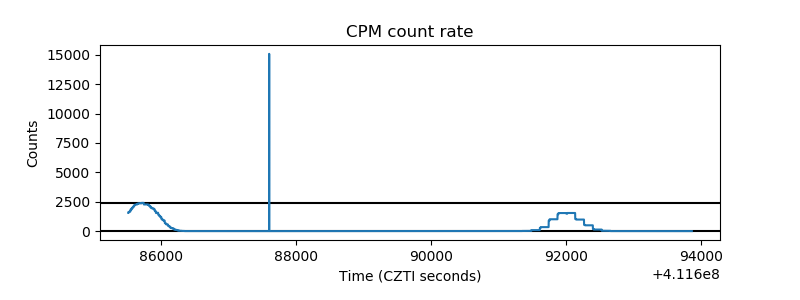 |
| CZT Counter | 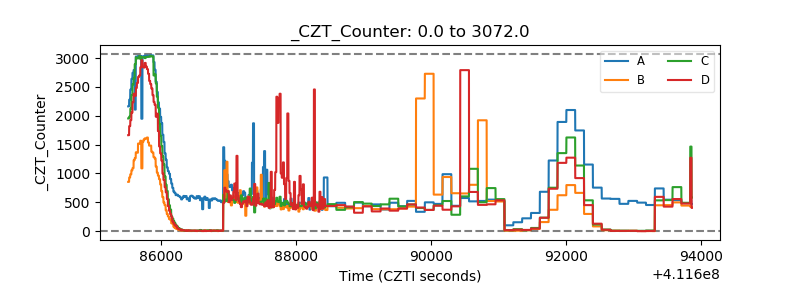 |
| +2.5 Volts monitor | 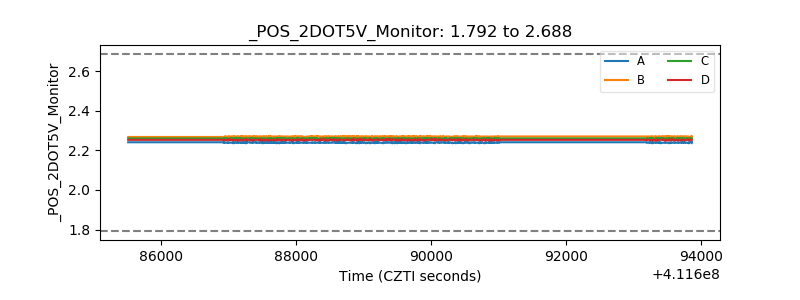 |
| +5 Volts monitor | 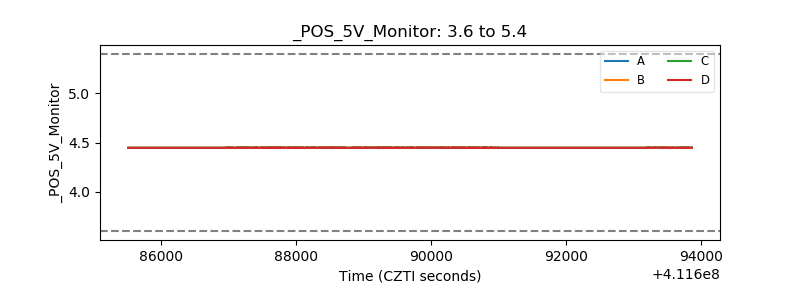 |
| _ROLL_ROT | 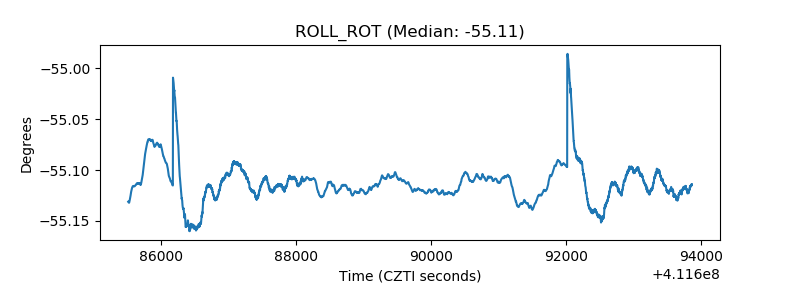 |
| _Roll_DEC | 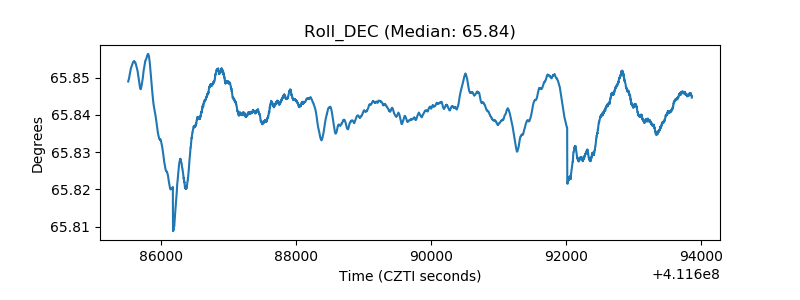 |
| _Roll_RA | 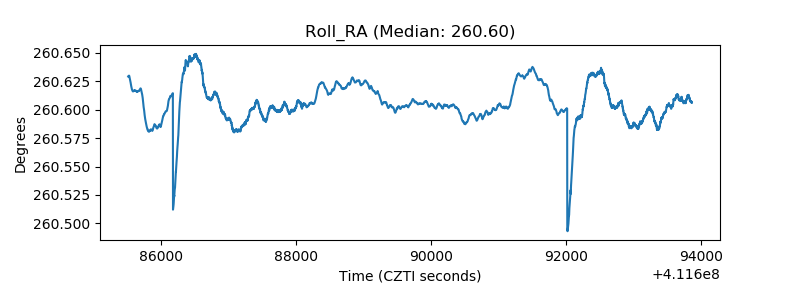 |
| Veto Counter | 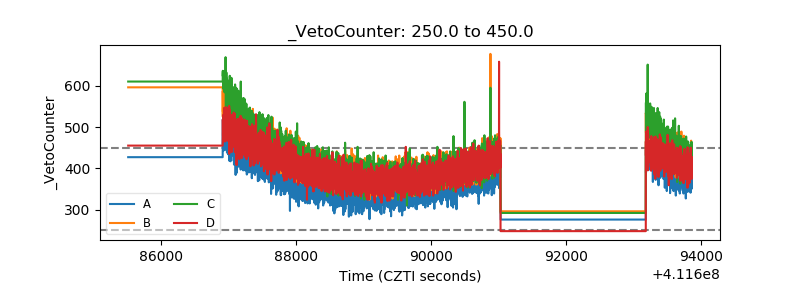 |