| Param | Original file | Final file |
|---|---|---|
| Filename | modeM0/AS1A12_018T01_9000005488_39506cztM0_level2.fits | modeM0/AS1A12_018T01_9000005488_39506cztM0_level2_quad_clean.evt |
| Size (bytes) | 340,482,240 | 88,398,720 |
| Size | 324.7 MB | 84.3 MB |
| Events in quadrant A | 2,642,748 | 603,756 |
| Events in quadrant B | 2,297,930 | 626,396 |
| Events in quadrant C | 4,071,867 | 549,408 |
| Events in quadrant D | 3,186,686 | 534,290 |
| Mode SS | |||
|---|---|---|---|
| Quadrant | BADHDUFLAG | Total packets | Discarded packets |
| A | 0 | 104 | 0 |
| B | 0 | 104 | 0 |
| C | 0 | 104 | 0 |
| D | 0 | 104 | 0 |
| Mode M0 | |||
|---|---|---|---|
| Quadrant | BADHDUFLAG | Total packets | Discarded packets |
| A | 0 | 11190 | 3 |
| B | 0 | 10619 | 2 |
| C | 0 | 15498 | 2 |
| D | 0 | 13326 | 2 |
| Mode M9 | |||
|---|---|---|---|
| Quadrant | BADHDUFLAG | Total packets | Discarded packets |
| A | 0 | 38 | 0 |
| B | 0 | 38 | 0 |
| C | 0 | 38 | 0 |
| D | 0 | 39 | 0 |
| Quadrant | Total seconds | Saturated seconds | Saturation percentage |
|---|---|---|---|
| A | 5185 | 11 | 0.212150% |
| B | 5185 | 8 | 0.154291% |
| C | 5185 | 511 | 9.855352% |
| D | 5185 | 211 | 4.069431% |
Noise dominated data is calculated using 1-second bins in cleaned event files. If a bin has >2000 counts, and if more than 50% of those come from <1% of pixels, then it is considered to be noise-dominated and hence unusable.
| Quadrant | # 1 sec bins | Bins with >0 counts | Bins with >2000 counts | High rate bins dominated by noise | Noise dominated (total time) | Noise dominated (detector-on time) | Marked lightcurve |
|---|---|---|---|---|---|---|---|
| A | 7306 | 5186 | 4 | 4 | 0.05% | 0.08% | 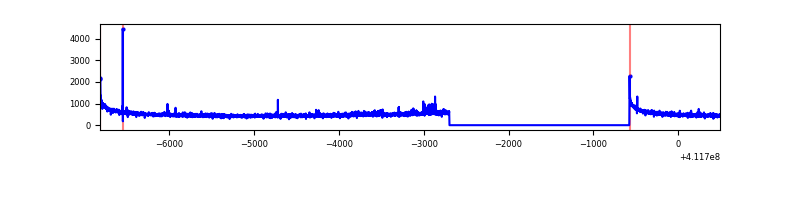 |
| B | 7306 | 5186 | 2 | 2 | 0.03% | 0.04% | 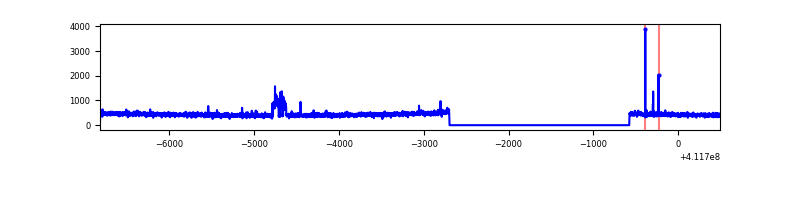 |
| C | 7306 | 5186 | 444 | 444 | 6.08% | 8.56% | 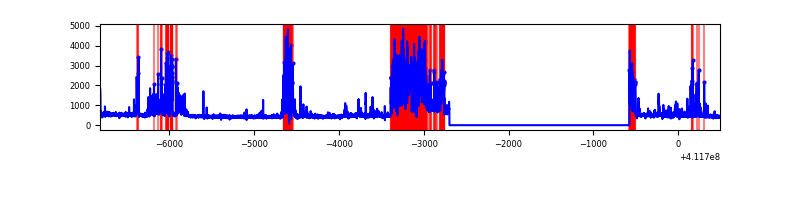 |
| D | 7306 | 5186 | 190 | 190 | 2.60% | 3.66% | 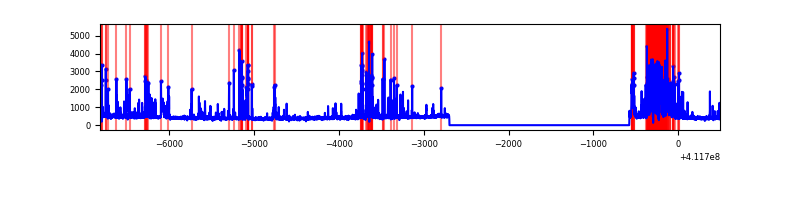 |
Top three noisy pixels from each quadrant. If the there are fewer than three noisy pixels in the level2.evt file, extra rows are filled as -1
| Pixel properties | Quadrant properties | ||||||
|---|---|---|---|---|---|---|---|
| Quadrant | DetID | PixID | Counts | Sigma | Mean | Median | Sigma |
| A | 10 | 83 | 422125 | 3737.08 | 558 | 549 | 112.8 |
| A | 15 | 222 | 37667 | 329.03 | 558 | 549 | 112.8 |
| A | 13 | 254 | 7773 | 64.04 | 558 | 549 | 112.8 |
| B | 5 | 172 | 83125 | 772.8 | 561 | 546 | 106.9 |
| B | 12 | 111 | 13422 | 120.5 | 561 | 546 | 106.9 |
| B | 11 | 111 | 12166 | 108.74 | 561 | 546 | 106.9 |
| C | 9 | 187 | 1763085 | 14341.93 | 527 | 530 | 122.9 |
| C | 15 | 214 | 210263 | 1706.6 | 527 | 530 | 122.9 |
| C | 15 | 208 | 27860 | 222.38 | 527 | 530 | 122.9 |
| D | 2 | 249 | 467395 | 3571.3 | 537 | 522 | 130.7 |
| D | 12 | 227 | 335120 | 2559.48 | 537 | 522 | 130.7 |
| D | 13 | 249 | 283486 | 2164.51 | 537 | 522 | 130.7 |
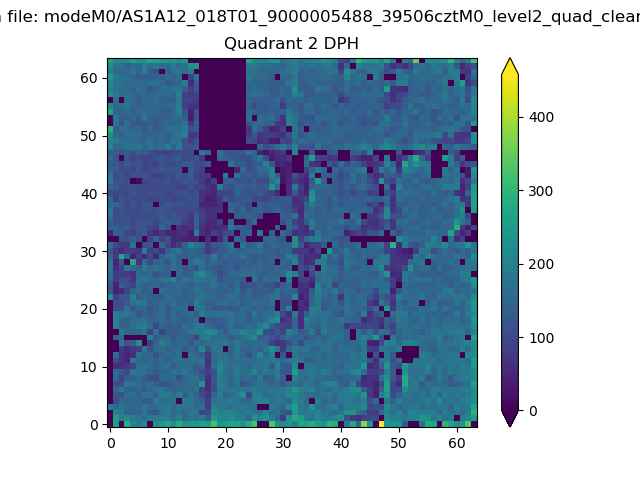
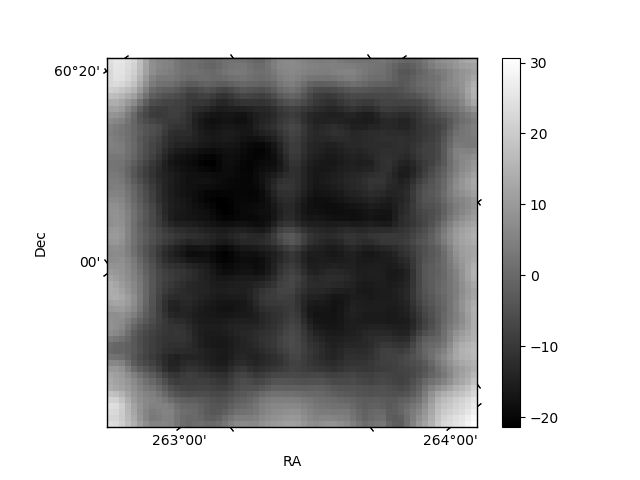
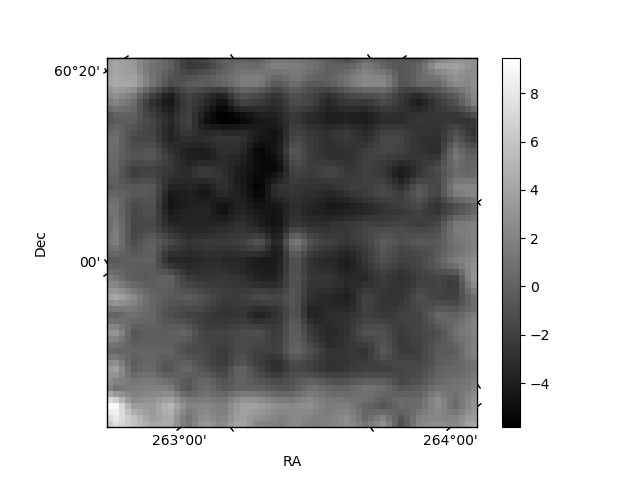
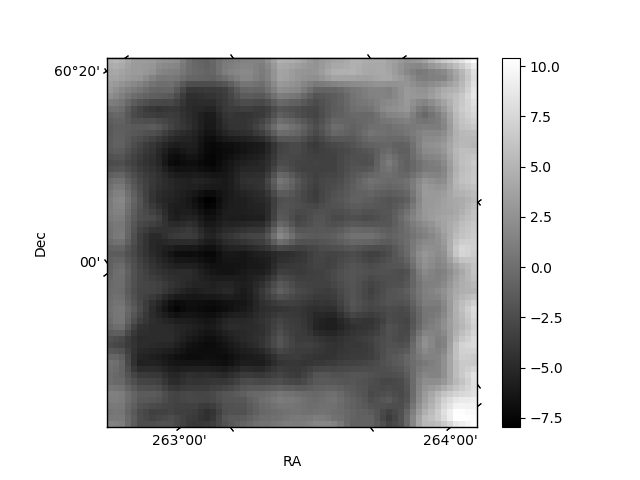
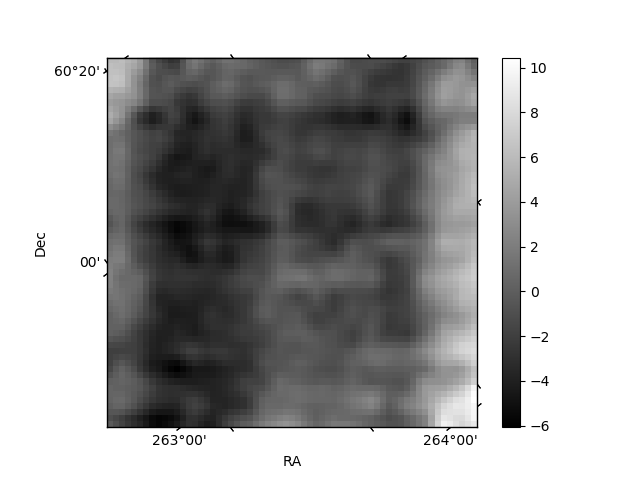
Histogram calculated using DETX and DETY for each event in the final _common_clean file
| Quadrant A | 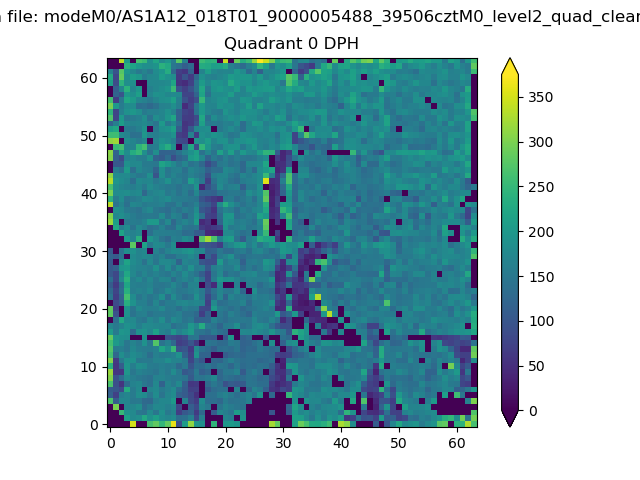 |
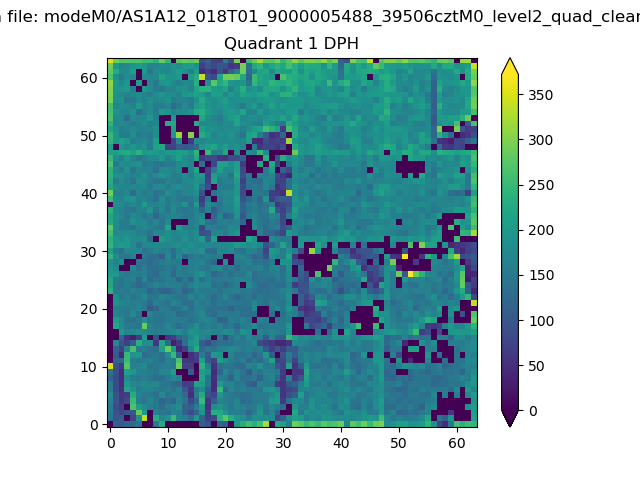 |
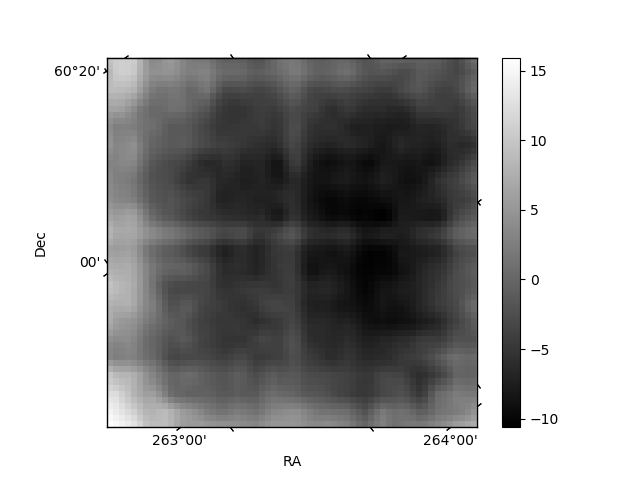
Quadrant B |
|---|---|---|---|
| Quadrant D | 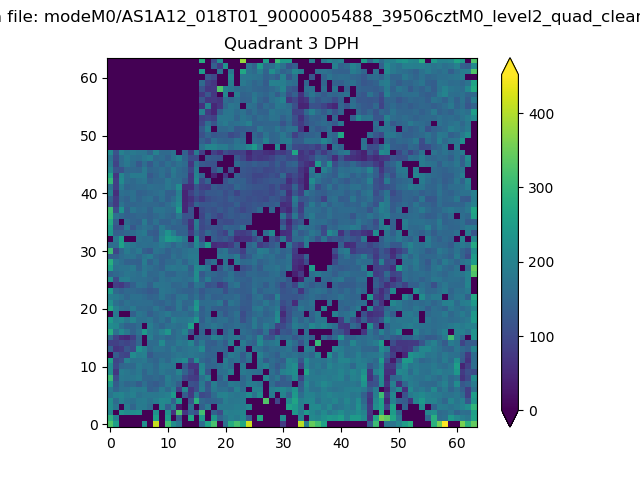 |
 |
Quadrant C |
| Plot type | Count rate plots | Images |
|---|---|---|
| Comparison with Poisson distribution Blue bars denote a histogram of data divided into 1 sec bins. Red curve is a Poisson curve with rate = median count rate of data. |
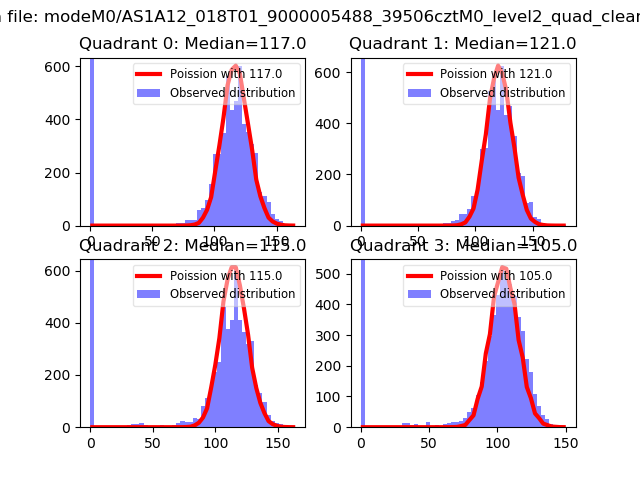 |
 |
| Quadrant-wise count rates Data is divided into 100 sec bins |
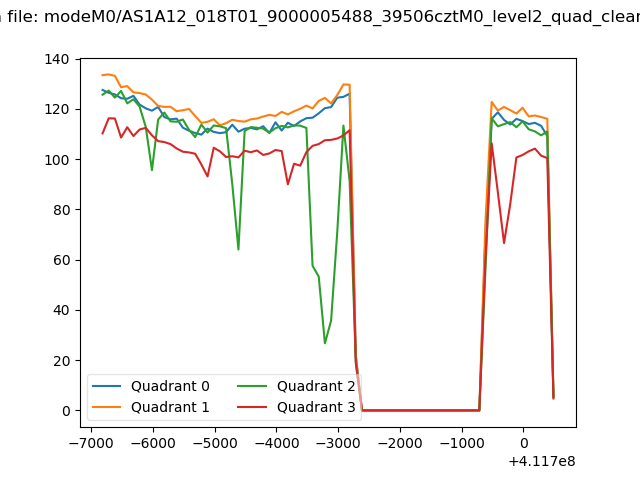 |
|
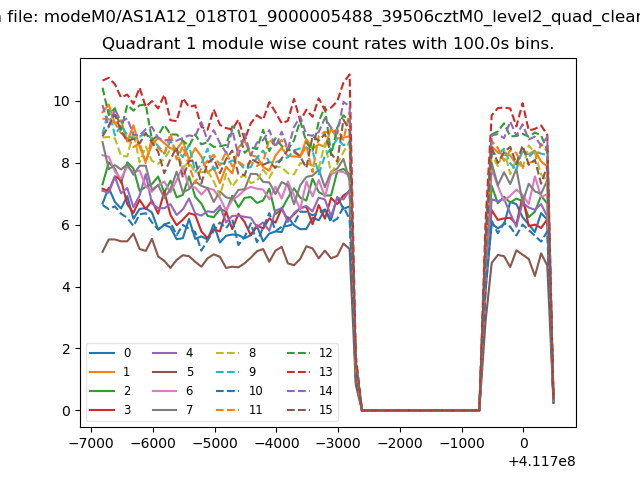
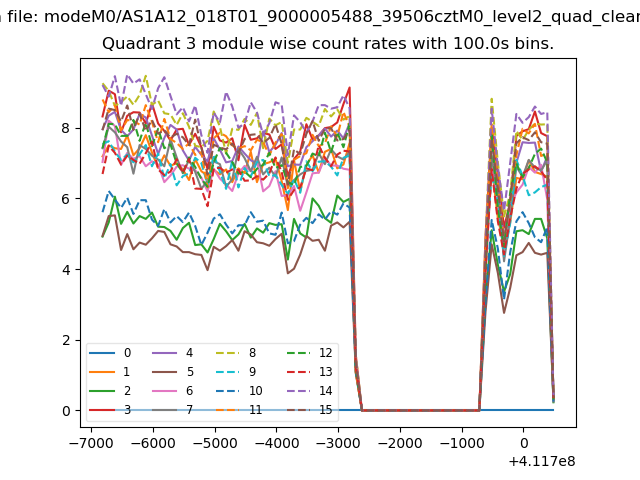
| Module-wise count rates for Quadrant A Data is divided into 100 sec bins |
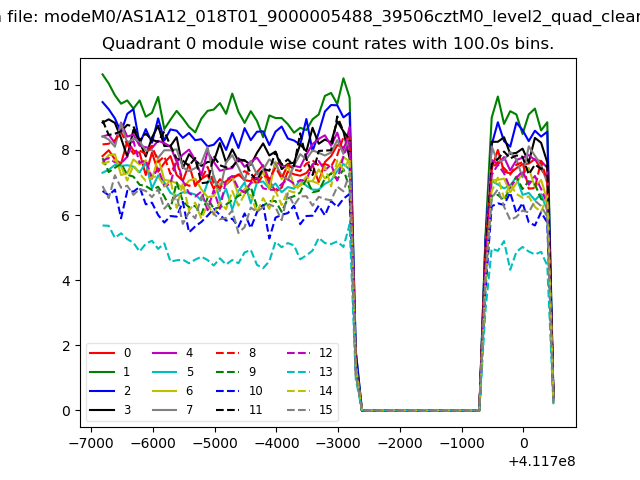 |
 |
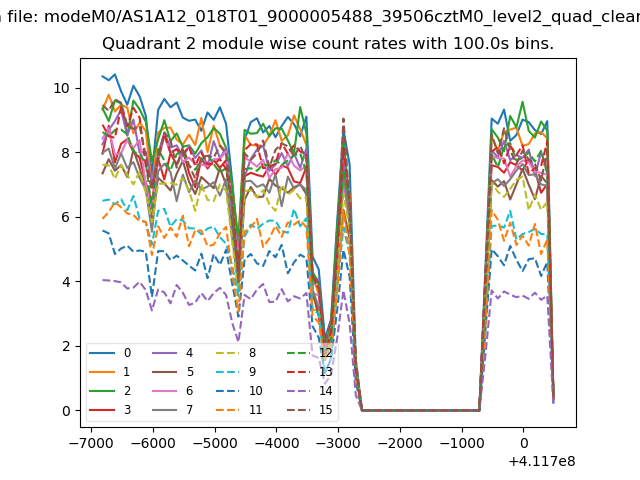
| Module-wise count rates for Quadrant B Data is divided into 100 sec bins |
 |
 |
| Module-wise count rates for Quadrant C Data is divided into 100 sec bins |
 |
 |
| Module-wise count rates for Quadrant D Data is divided into 100 sec bins |
 |
 |
| Parameter | Plot |
|---|---|
| CZT HV Monitor | 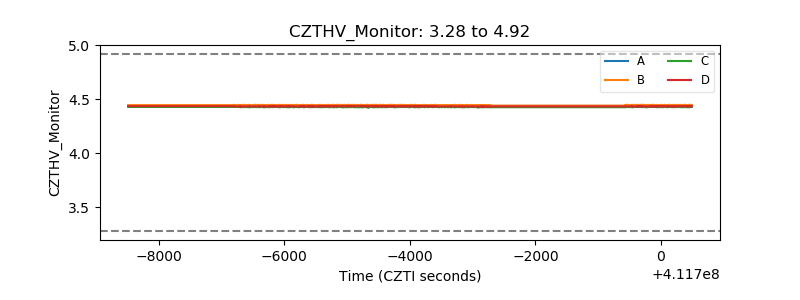 |
| D_VDD | 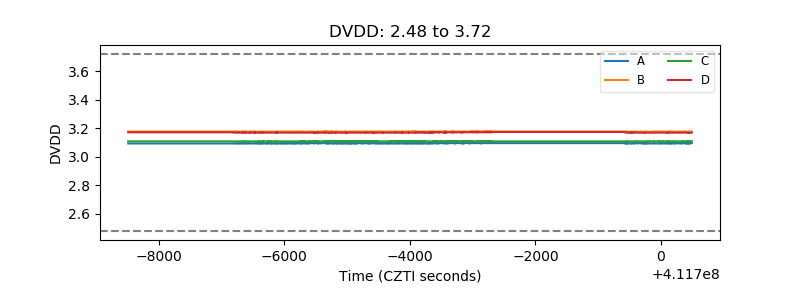 |
| Temperature 1 | 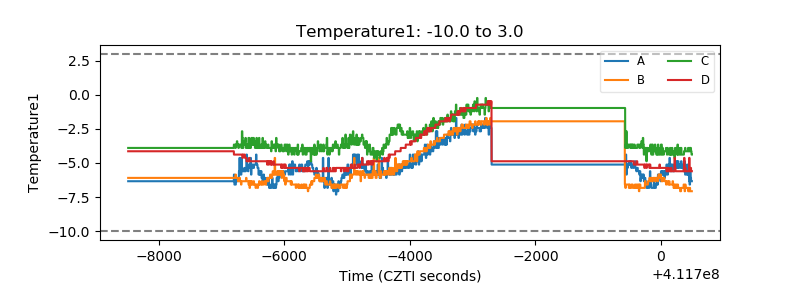 |
| Veto HV Monitor | 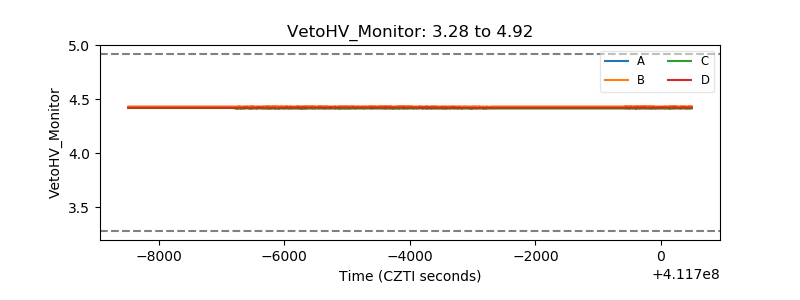 |
| Veto LLD | 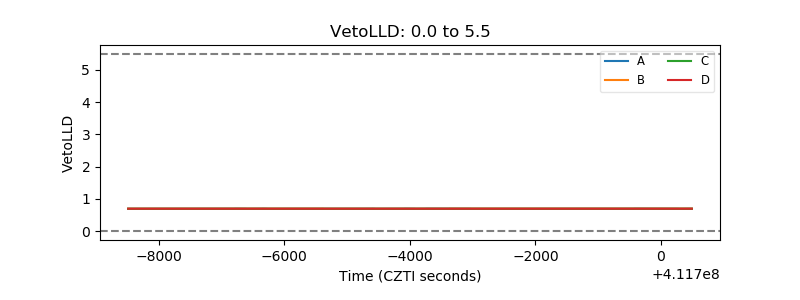 |
| Alpha Counter | 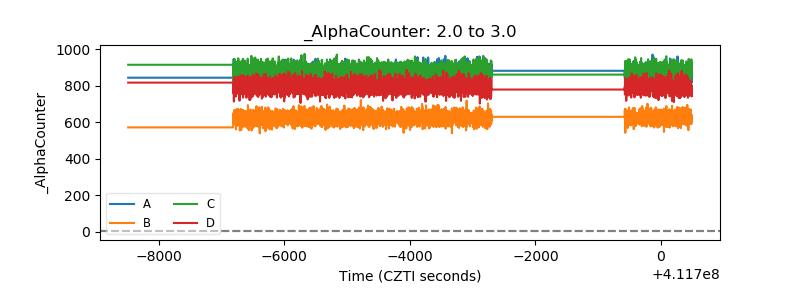 |
| _CPM_Rate | 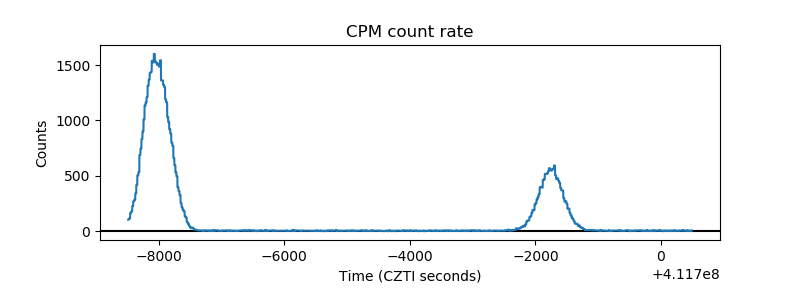 |
| CZT Counter | 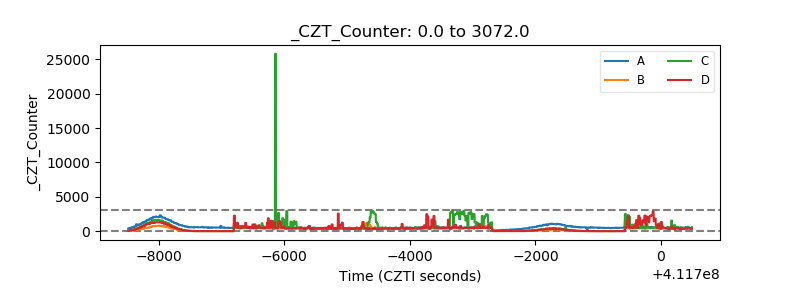 |
| +2.5 Volts monitor | 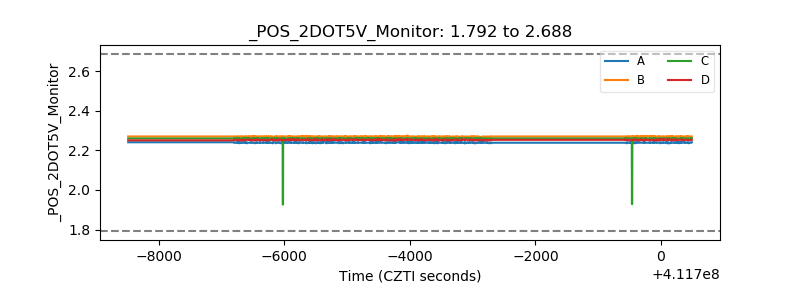 |
| +5 Volts monitor | 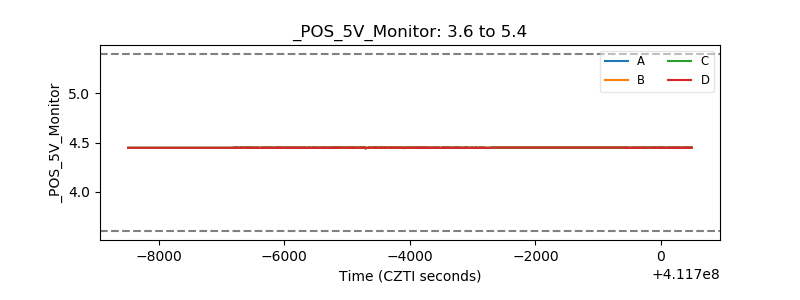 |
| _ROLL_ROT | 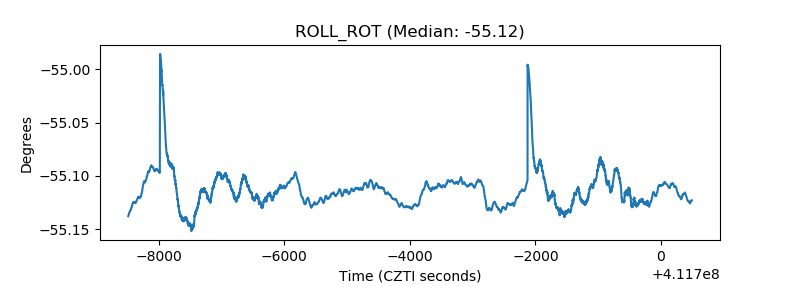 |
| _Roll_DEC | 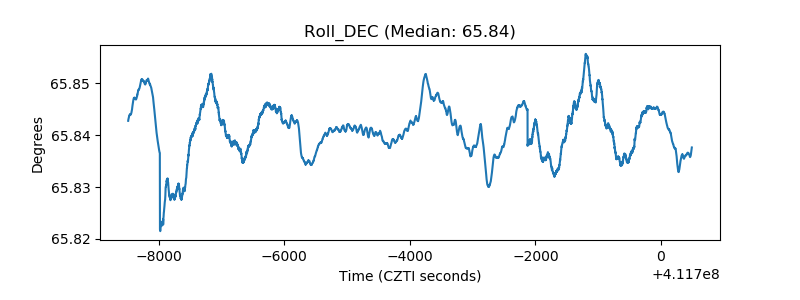 |
| _Roll_RA | 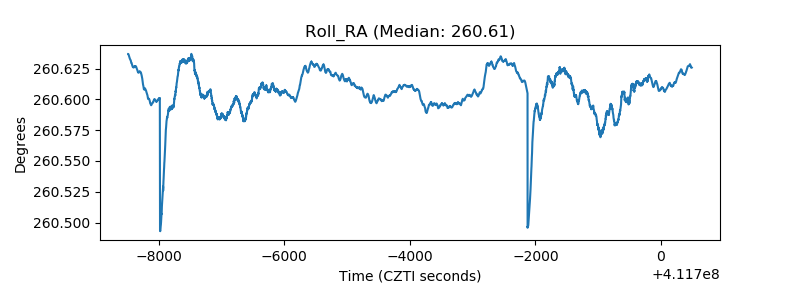 |
| Veto Counter | 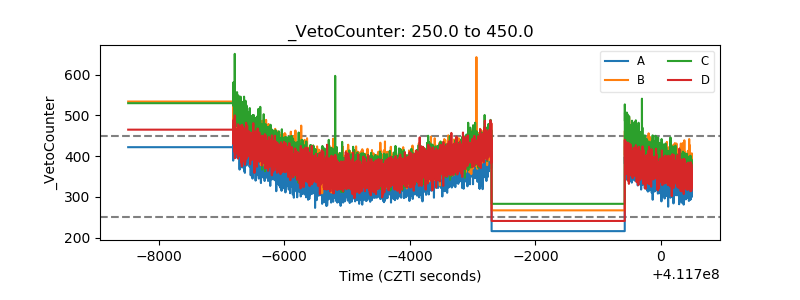 |