| Param | Original file | Final file |
|---|---|---|
| Filename | modeM0/AS1A12_018T01_9000005488_39509cztM0_level2.fits | modeM0/AS1A12_018T01_9000005488_39509cztM0_level2_quad_clean.evt |
| Size (bytes) | 1,244,041,920 | 334,235,520 |
| Size | 1.2 GB | 318.8 MB |
| Events in quadrant A | 10,110,018 | 2,269,527 |
| Events in quadrant B | 10,604,722 | 2,296,694 |
| Events in quadrant C | 12,799,637 | 2,151,574 |
| Events in quadrant D | 10,978,336 | 2,017,566 |
| Mode SS | |||
|---|---|---|---|
| Quadrant | BADHDUFLAG | Total packets | Discarded packets |
| A | 0 | 410 | 0 |
| B | 0 | 410 | 0 |
| C | 0 | 410 | 0 |
| D | 0 | 410 | 0 |
| Mode M0 | |||
|---|---|---|---|
| Quadrant | BADHDUFLAG | Total packets | Discarded packets |
| A | 0 | 42915 | 7 |
| B | 0 | 46090 | 6 |
| C | 0 | 51437 | 6 |
| D | 0 | 47793 | 6 |
| Mode M9 | |||
|---|---|---|---|
| Quadrant | BADHDUFLAG | Total packets | Discarded packets |
| A | 0 | 93 | 0 |
| B | 0 | 93 | 0 |
| C | 0 | 93 | 0 |
| D | 0 | 94 | 0 |
| Quadrant | Total seconds | Saturated seconds | Saturation percentage |
|---|---|---|---|
| A | 20112 | 54 | 0.268496% |
| B | 20112 | 590 | 2.933572% |
| C | 20112 | 945 | 4.698687% |
| D | 20112 | 471 | 2.341885% |
Noise dominated data is calculated using 1-second bins in cleaned event files. If a bin has >2000 counts, and if more than 50% of those come from <1% of pixels, then it is considered to be noise-dominated and hence unusable.
| Quadrant | # 1 sec bins | Bins with >0 counts | Bins with >2000 counts | High rate bins dominated by noise | Noise dominated (total time) | Noise dominated (detector-on time) | Marked lightcurve |
|---|---|---|---|---|---|---|---|
| A | 32226 | 20117 | 28 | 28 | 0.09% | 0.14% | 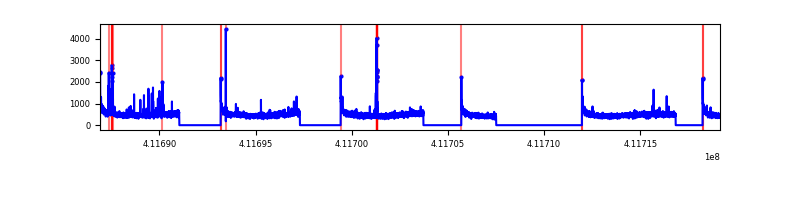 |
| B | 32226 | 20117 | 443 | 443 | 1.37% | 2.20% | 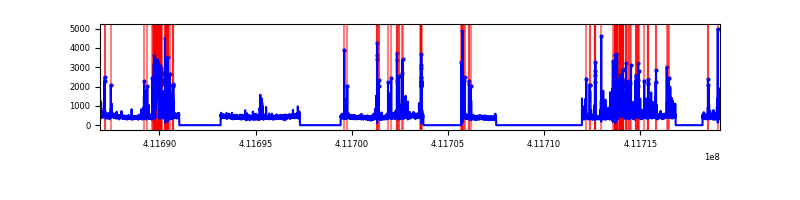 |
| C | 32226 | 20117 | 859 | 859 | 2.67% | 4.27% | 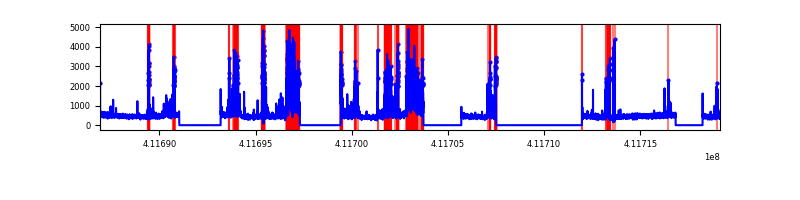 |
| D | 32226 | 20117 | 407 | 407 | 1.26% | 2.02% | 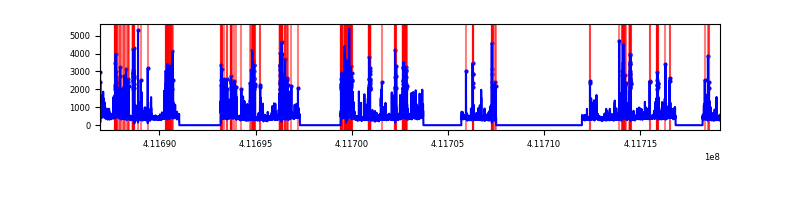 |
Top three noisy pixels from each quadrant. If the there are fewer than three noisy pixels in the level2.evt file, extra rows are filled as -1
| Pixel properties | Quadrant properties | ||||||
|---|---|---|---|---|---|---|---|
| Quadrant | DetID | PixID | Counts | Sigma | Mean | Median | Sigma |
| A | 10 | 83 | 1484731 | 3456.33 | 2149 | 2110 | 429.0 |
| A | 9 | 143 | 65907 | 148.72 | 2149 | 2110 | 429.0 |
| A | 2 | 79 | 65897 | 148.7 | 2149 | 2110 | 429.0 |
| B | 5 | 172 | 2213132 | 5551.68 | 2124 | 2063 | 398.3 |
| B | 12 | 111 | 50793 | 122.35 | 2124 | 2063 | 398.3 |
| B | 11 | 111 | 46682 | 112.03 | 2124 | 2063 | 398.3 |
| C | 9 | 187 | 3804872 | 8064.74 | 2060 | 2074 | 471.5 |
| C | 15 | 214 | 821830 | 1738.49 | 2060 | 2074 | 471.5 |
| C | 15 | 208 | 68625 | 141.14 | 2060 | 2074 | 471.5 |
| D | 2 | 249 | 1120753 | 2245.86 | 2073 | 2016 | 498.1 |
| D | 13 | 249 | 877715 | 1757.96 | 2073 | 2016 | 498.1 |
| D | 12 | 227 | 736087 | 1473.64 | 2073 | 2016 | 498.1 |
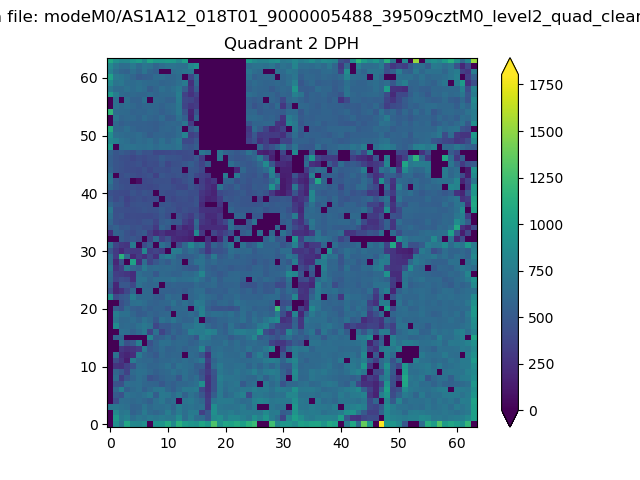
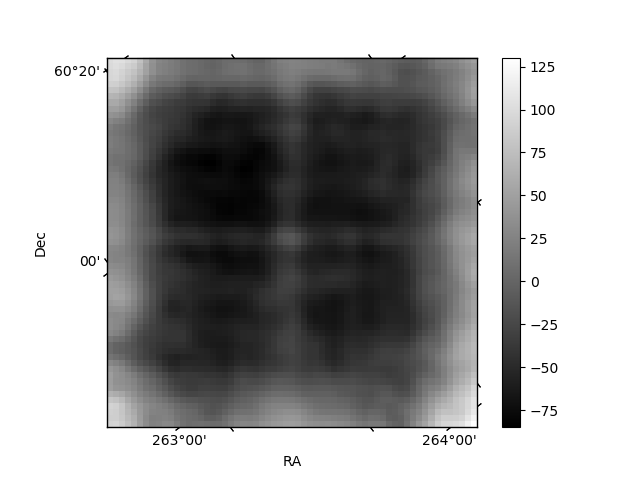
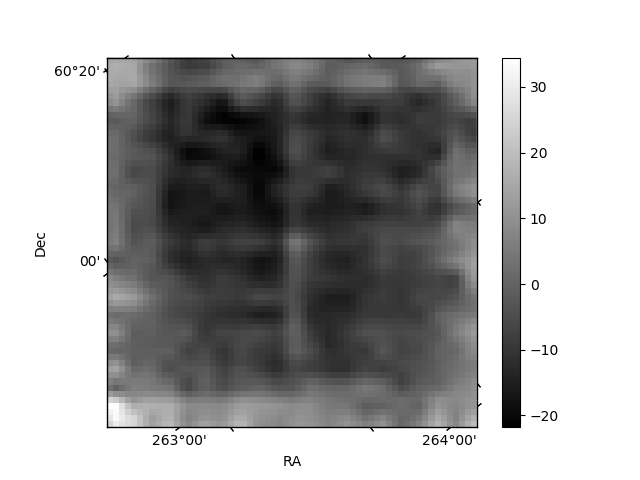
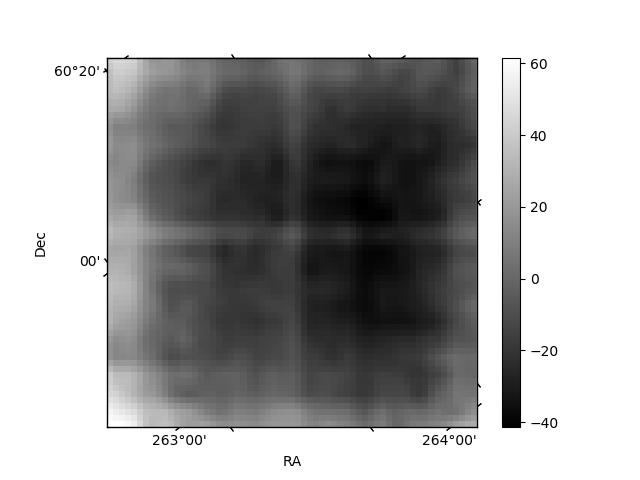
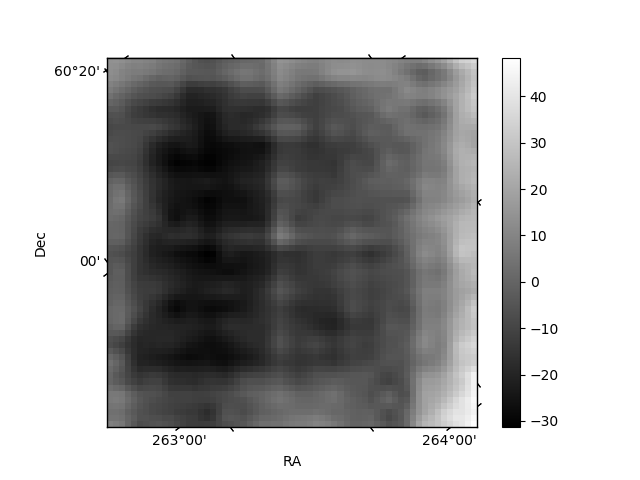
Histogram calculated using DETX and DETY for each event in the final _common_clean file
| Quadrant A | 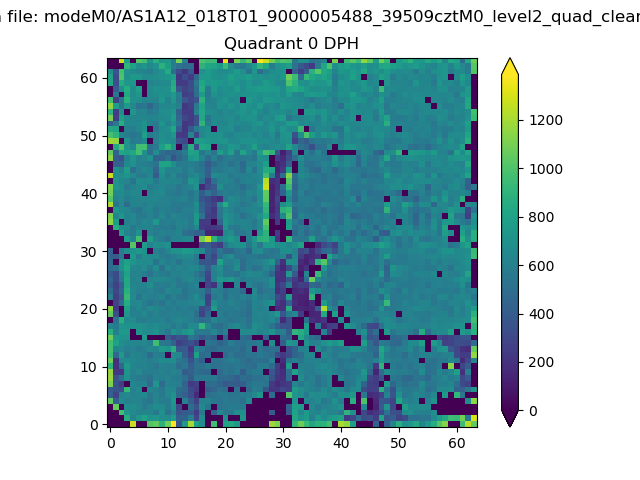 |
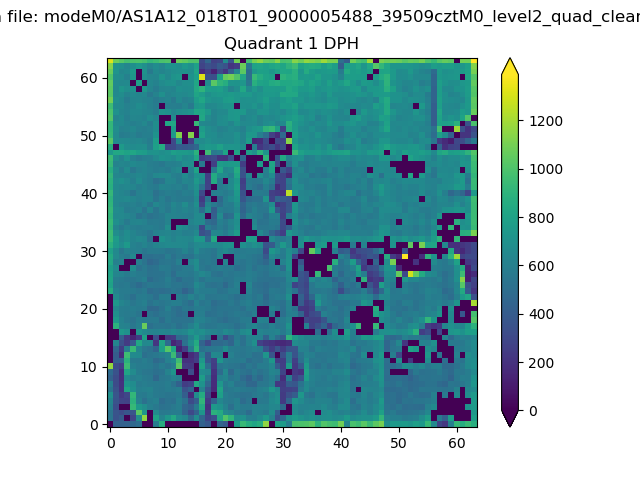 |
Quadrant B |
|---|---|---|---|
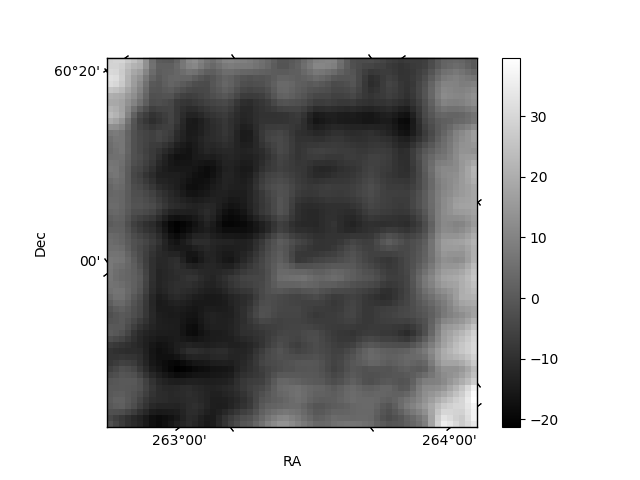
| Quadrant D | 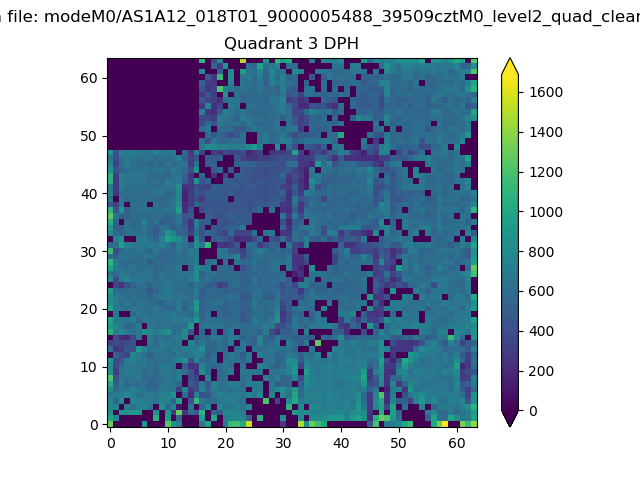 |
 |
Quadrant C |
| Plot type | Count rate plots | Images |
|---|---|---|
| Comparison with Poisson distribution Blue bars denote a histogram of data divided into 1 sec bins. Red curve is a Poisson curve with rate = median count rate of data. |
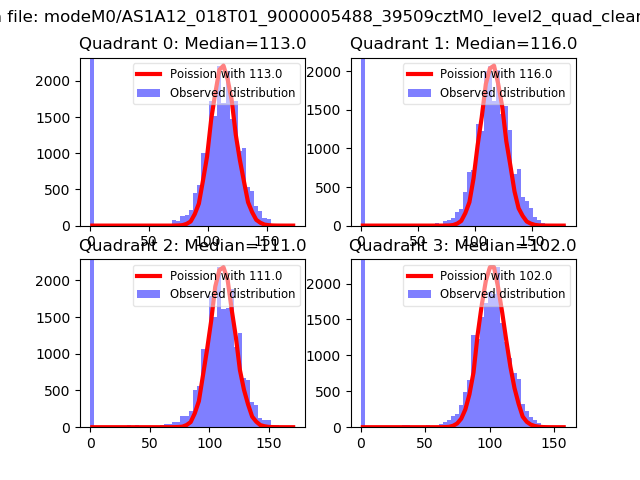 |
 |
| Quadrant-wise count rates Data is divided into 100 sec bins |
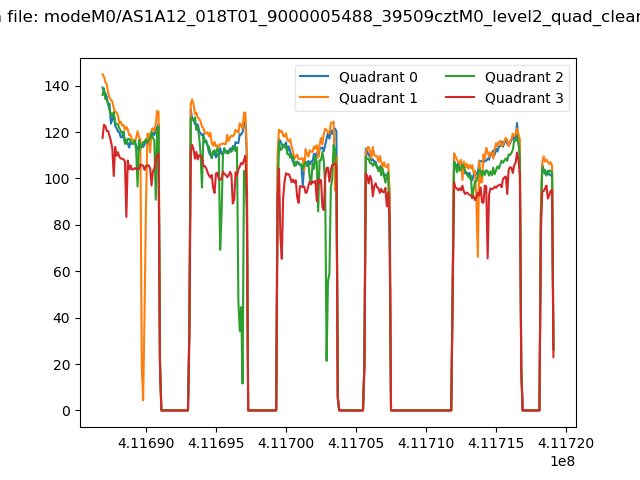 |
|
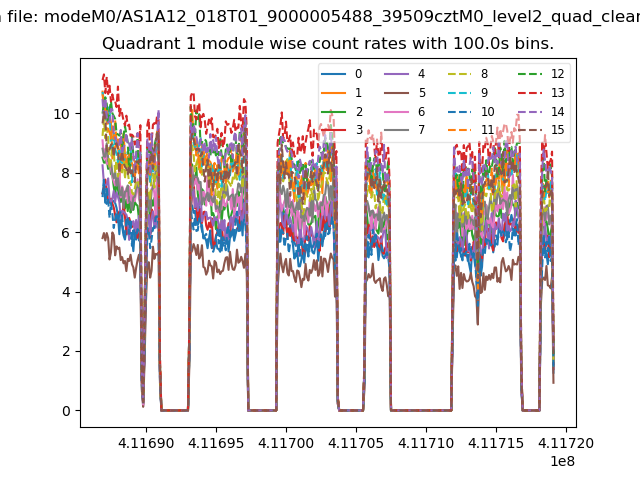
| Module-wise count rates for Quadrant A Data is divided into 100 sec bins |
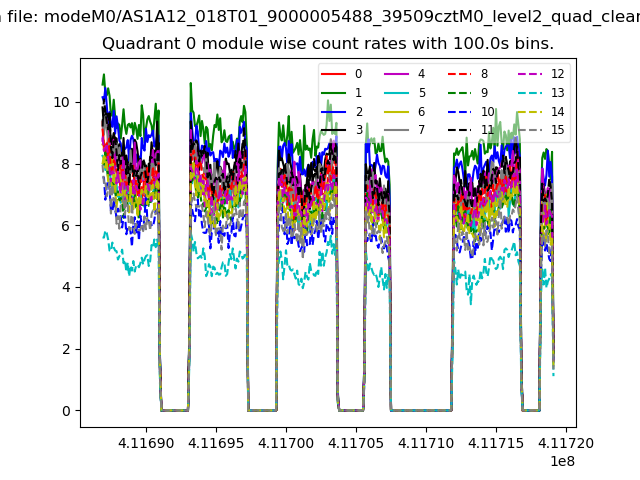 |
 |
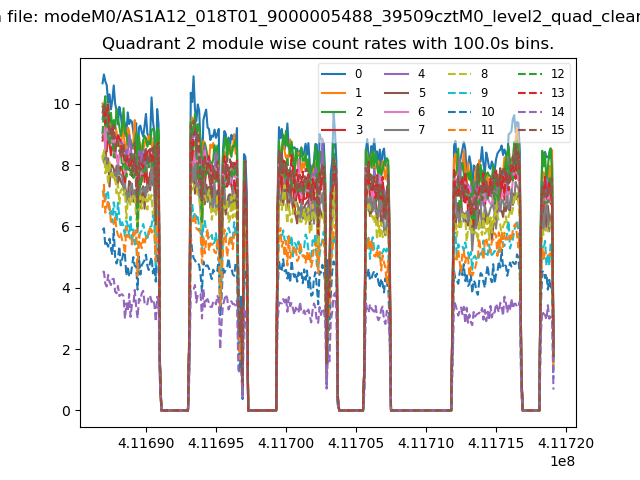
| Module-wise count rates for Quadrant B Data is divided into 100 sec bins |
 |
 |
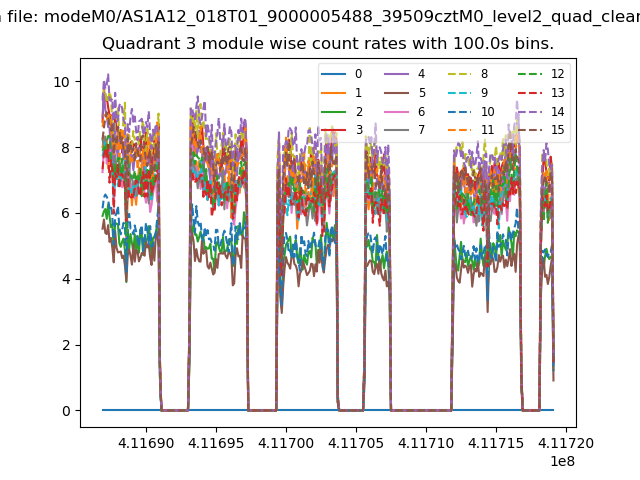
| Module-wise count rates for Quadrant C Data is divided into 100 sec bins |
 |
 |
| Module-wise count rates for Quadrant D Data is divided into 100 sec bins |
 |
 |
| Parameter | Plot |
|---|---|
| CZT HV Monitor |  |
| D_VDD | 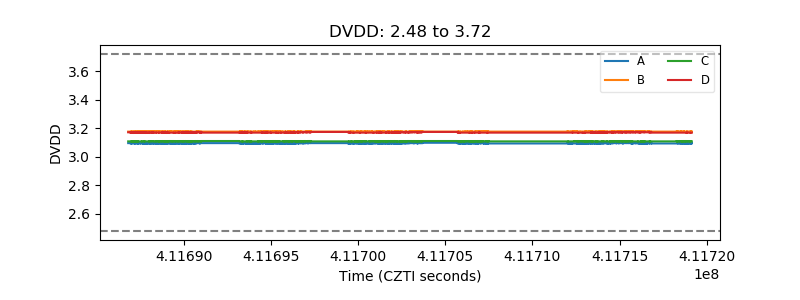 |
| Temperature 1 | 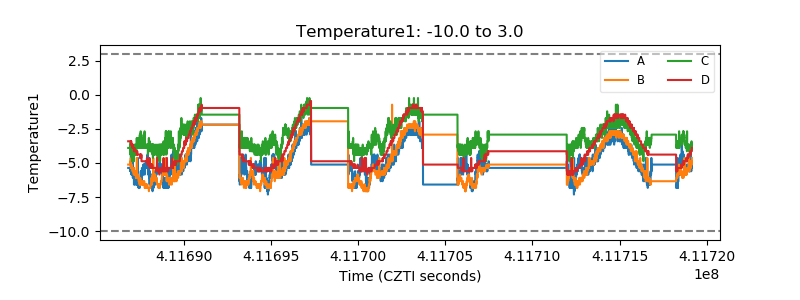 |
| Veto HV Monitor | 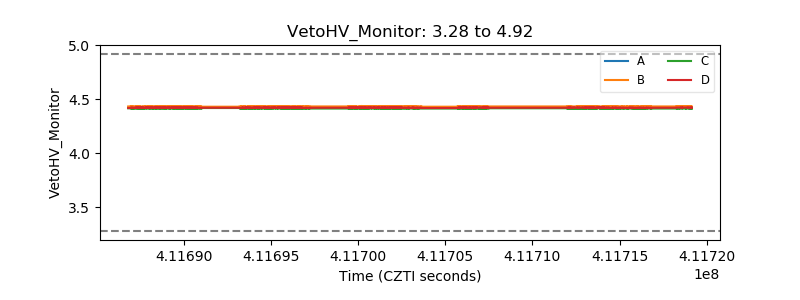 |
| Veto LLD | 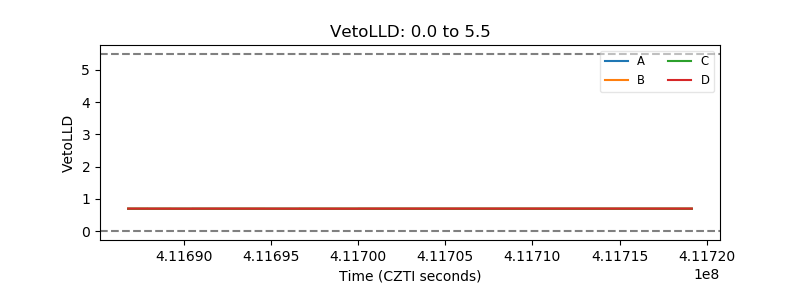 |
| Alpha Counter | 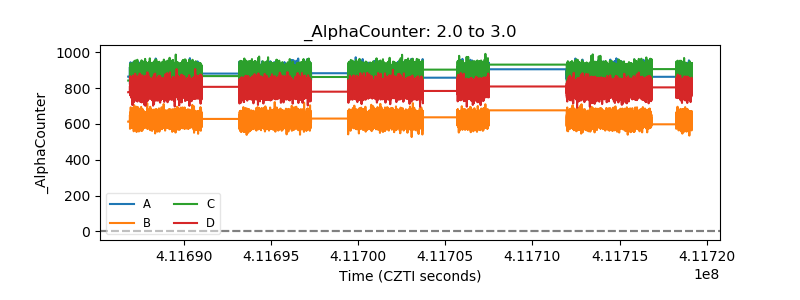 |
| _CPM_Rate | 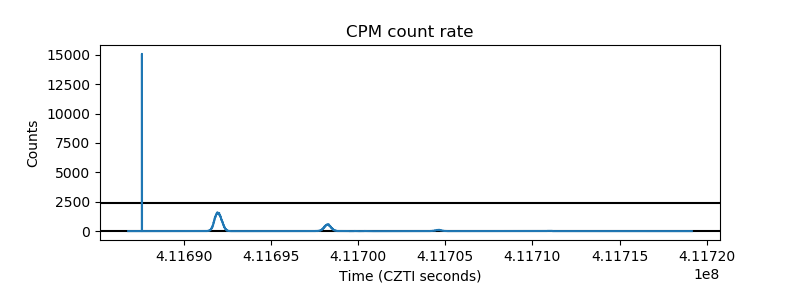 |
| CZT Counter | 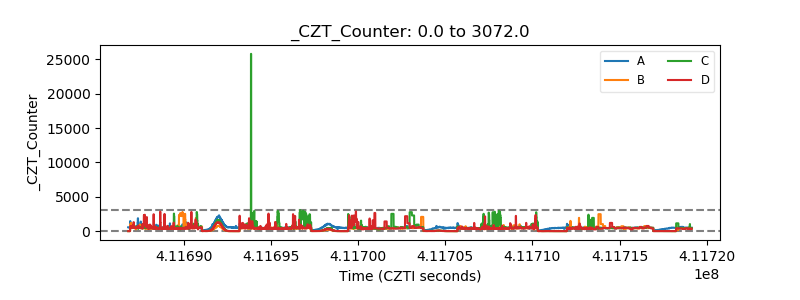 |
| +2.5 Volts monitor | 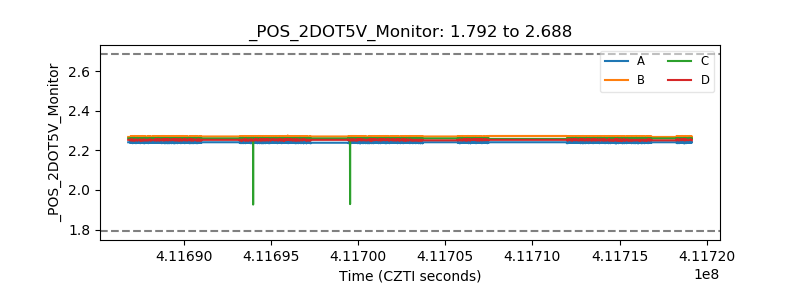 |
| +5 Volts monitor | 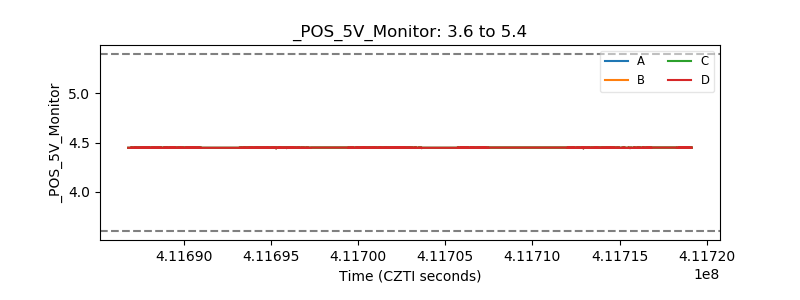 |
| _ROLL_ROT | 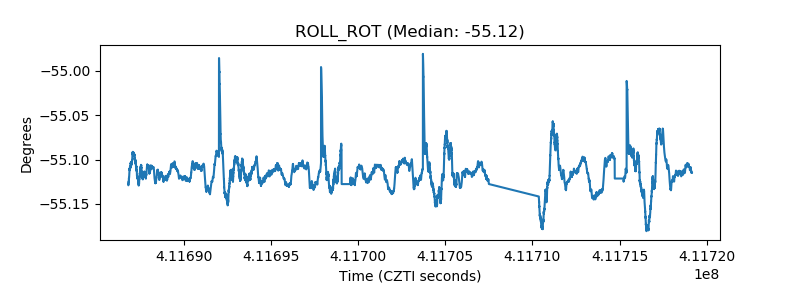 |
| _Roll_DEC | 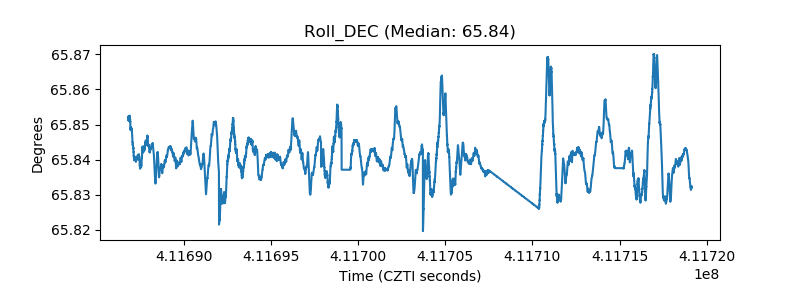 |
| _Roll_RA | 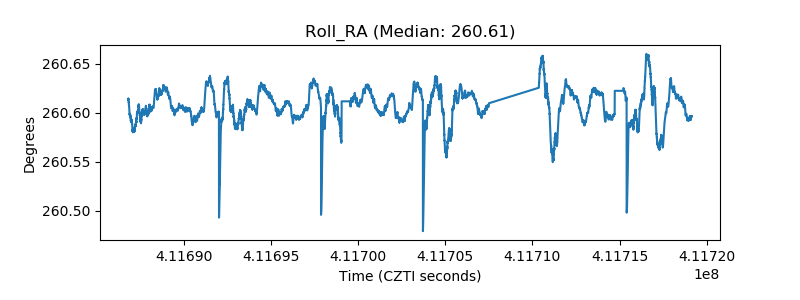 |
| Veto Counter | 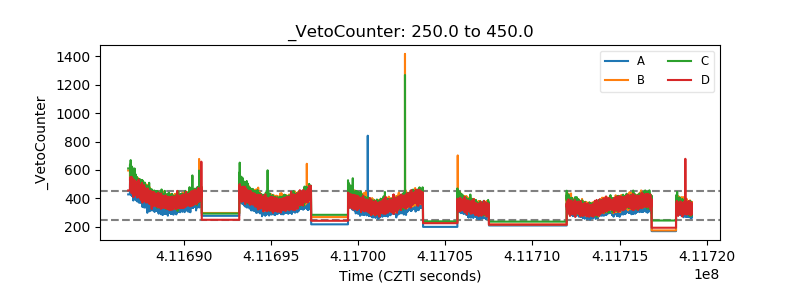 |