| Param | Original file | Final file |
|---|---|---|
| Filename | modeM0/AS1A12_018T01_9000005488_39510cztM0_level2.fits | modeM0/AS1A12_018T01_9000005488_39510cztM0_level2_quad_clean.evt |
| Size (bytes) | 357,796,800 | 94,383,360 |
| Size | 341.2 MB | 90.0 MB |
| Events in quadrant A | 2,880,514 | 632,240 |
| Events in quadrant B | 2,647,302 | 649,842 |
| Events in quadrant C | 3,343,195 | 607,336 |
| Events in quadrant D | 3,915,290 | 556,831 |
| Mode SS | |||
|---|---|---|---|
| Quadrant | BADHDUFLAG | Total packets | Discarded packets |
| A | 0 | 120 | 0 |
| B | 0 | 120 | 0 |
| C | 0 | 120 | 0 |
| D | 0 | 120 | 0 |
| Mode M0 | |||
|---|---|---|---|
| Quadrant | BADHDUFLAG | Total packets | Discarded packets |
| A | 0 | 12163 | 3 |
| B | 0 | 12203 | 2 |
| C | 0 | 13751 | 2 |
| D | 0 | 15952 | 2 |
| Mode M9 | |||
|---|---|---|---|
| Quadrant | BADHDUFLAG | Total packets | Discarded packets |
| A | 0 | 13 | 0 |
| B | 0 | 13 | 0 |
| C | 0 | 13 | 0 |
| D | 0 | 13 | 0 |
| Quadrant | Total seconds | Saturated seconds | Saturation percentage |
|---|---|---|---|
| A | 5886 | 8 | 0.135916% |
| B | 5886 | 29 | 0.492695% |
| C | 5886 | 90 | 1.529052% |
| D | 5886 | 179 | 3.041115% |
Noise dominated data is calculated using 1-second bins in cleaned event files. If a bin has >2000 counts, and if more than 50% of those come from <1% of pixels, then it is considered to be noise-dominated and hence unusable.
| Quadrant | # 1 sec bins | Bins with >0 counts | Bins with >2000 counts | High rate bins dominated by noise | Noise dominated (total time) | Noise dominated (detector-on time) | Marked lightcurve |
|---|---|---|---|---|---|---|---|
| A | 7200 | 5887 | 3 | 3 | 0.04% | 0.05% | 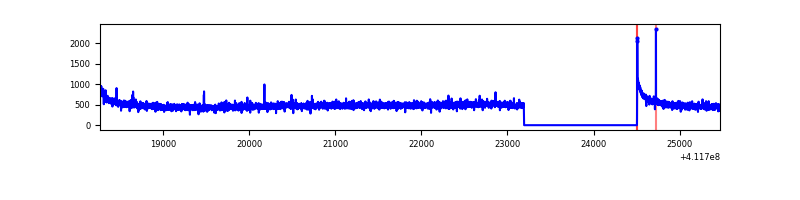 |
| B | 7200 | 5887 | 14 | 14 | 0.19% | 0.24% | 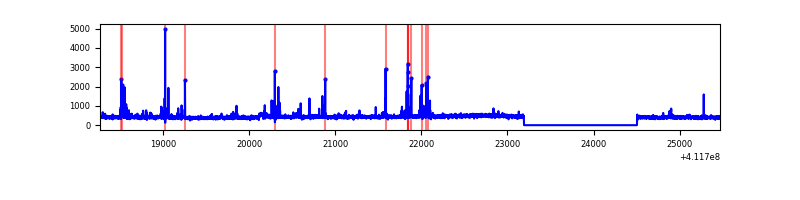 |
| C | 7200 | 5887 | 92 | 92 | 1.28% | 1.56% | 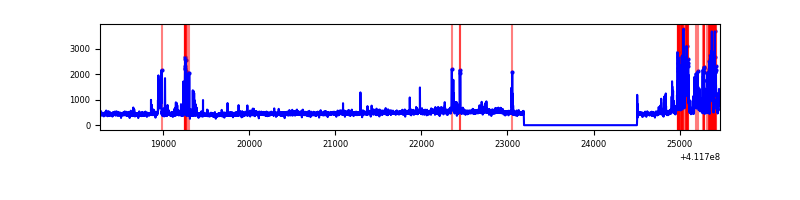 |
| D | 7200 | 5887 | 174 | 174 | 2.42% | 2.96% | 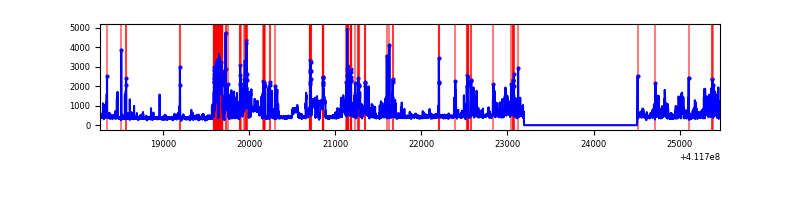 |
Top three noisy pixels from each quadrant. If the there are fewer than three noisy pixels in the level2.evt file, extra rows are filled as -1
| Pixel properties | Quadrant properties | ||||||
|---|---|---|---|---|---|---|---|
| Quadrant | DetID | PixID | Counts | Sigma | Mean | Median | Sigma |
| A | 10 | 83 | 439960 | 3417.09 | 627 | 613 | 128.6 |
| A | 13 | 254 | 8038 | 57.75 | 627 | 613 | 128.6 |
| A | 3 | 137 | 6855 | 48.55 | 627 | 613 | 128.6 |
| B | 5 | 172 | 167766 | 1377.64 | 622 | 602 | 121.3 |
| B | 15 | 85 | 36744 | 297.86 | 622 | 602 | 121.3 |
| B | 12 | 111 | 15148 | 119.88 | 622 | 602 | 121.3 |
| C | 9 | 187 | 660336 | 4630.39 | 607 | 610 | 142.5 |
| C | 15 | 214 | 244670 | 1712.97 | 607 | 610 | 142.5 |
| C | 15 | 208 | 66413 | 461.85 | 607 | 610 | 142.5 |
| D | 12 | 227 | 978332 | 6590.85 | 603 | 586 | 148.3 |
| D | 2 | 249 | 266745 | 1794.14 | 603 | 586 | 148.3 |
| D | 13 | 249 | 201232 | 1352.53 | 603 | 586 | 148.3 |
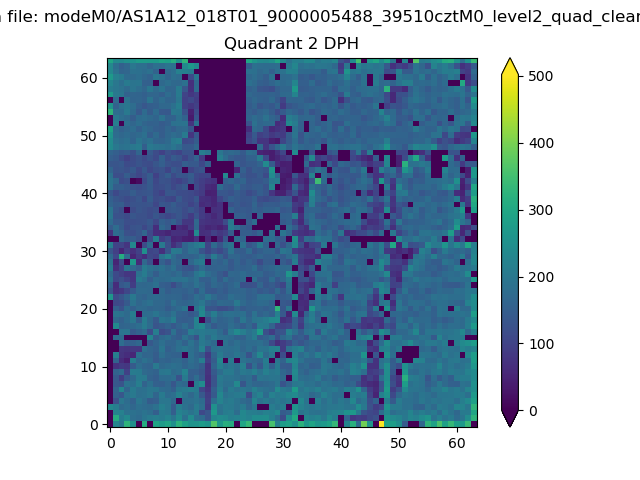
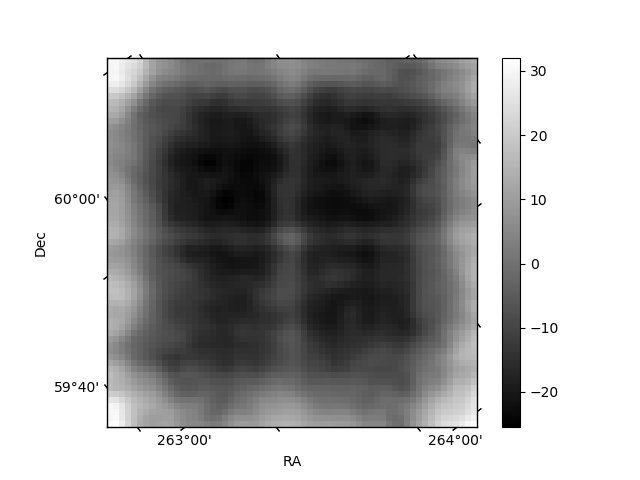
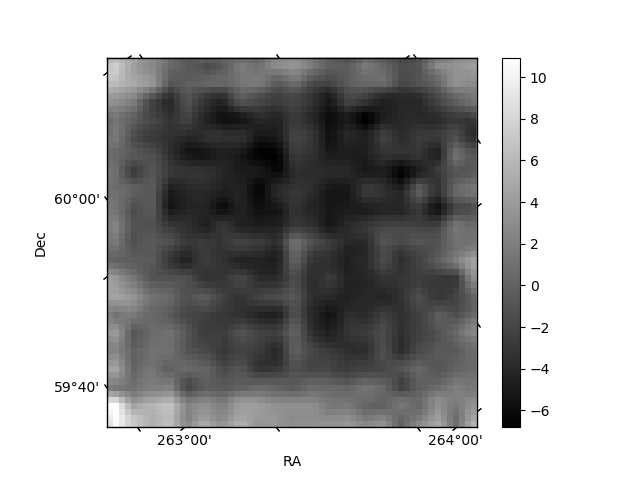
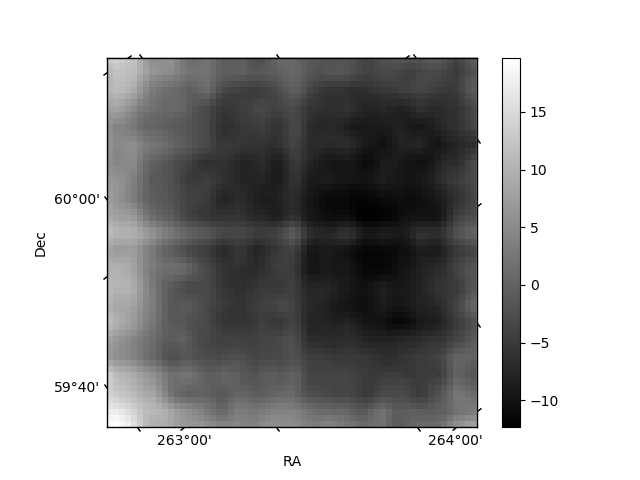
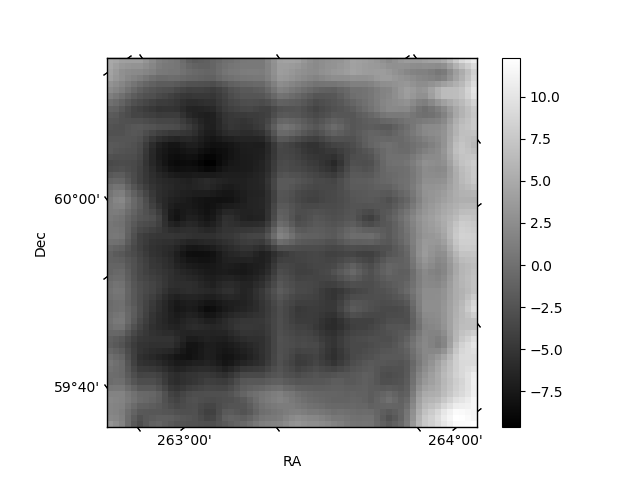
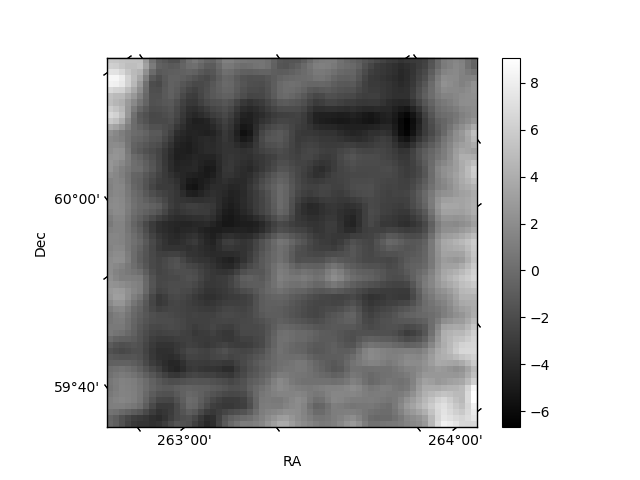
Histogram calculated using DETX and DETY for each event in the final _common_clean file
| Quadrant A | 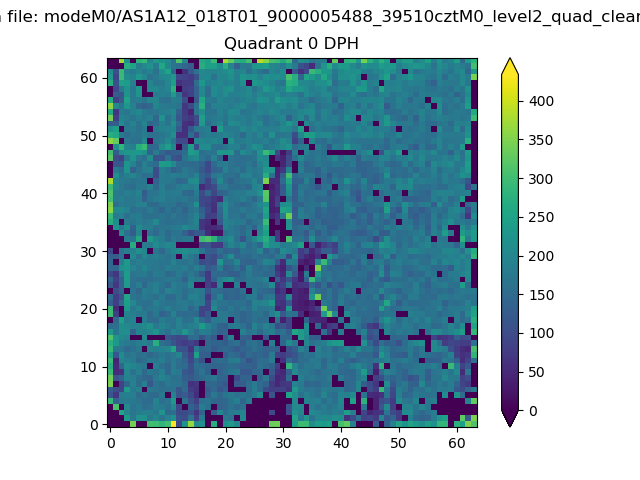 |
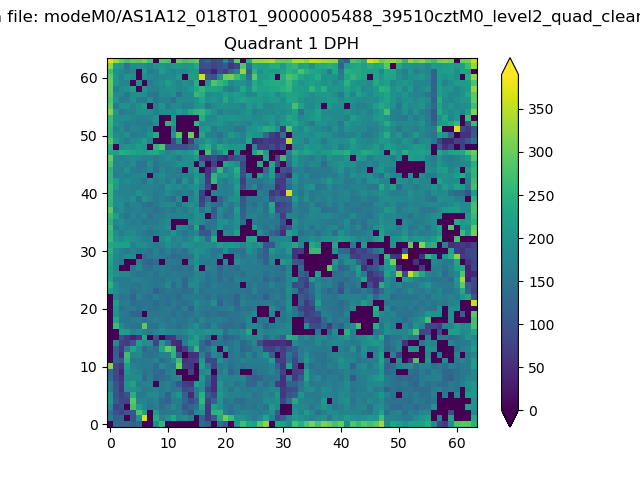 |
Quadrant B |
|---|---|---|---|
| Quadrant D | 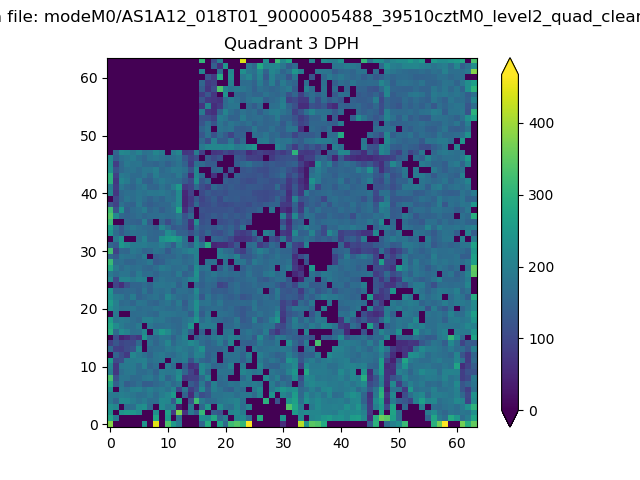 |
 |
Quadrant C |
| Plot type | Count rate plots | Images |
|---|---|---|
| Comparison with Poisson distribution Blue bars denote a histogram of data divided into 1 sec bins. Red curve is a Poisson curve with rate = median count rate of data. |
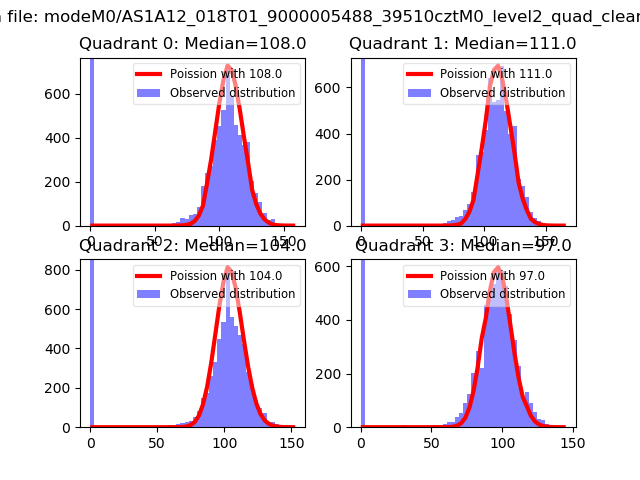 |
 |
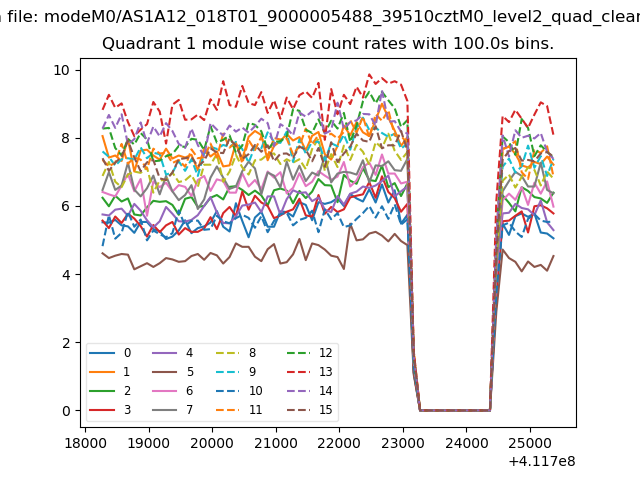
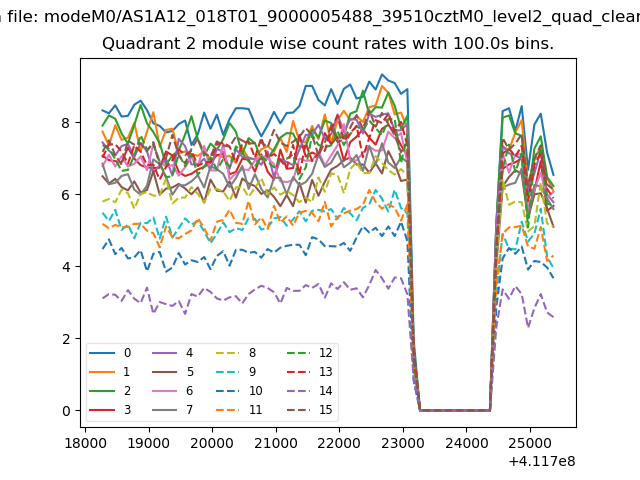
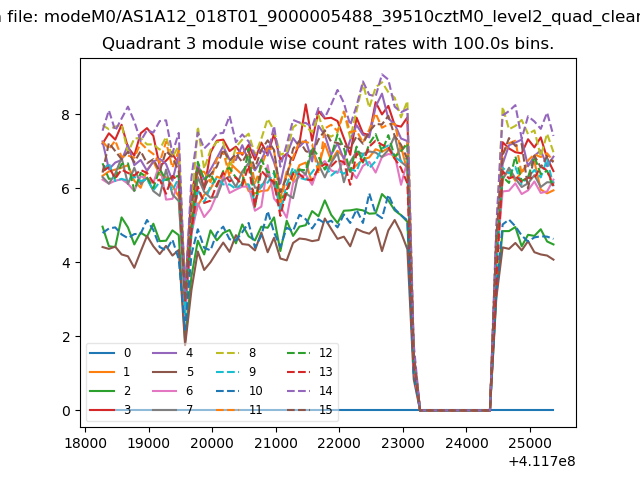
| Quadrant-wise count rates Data is divided into 100 sec bins |
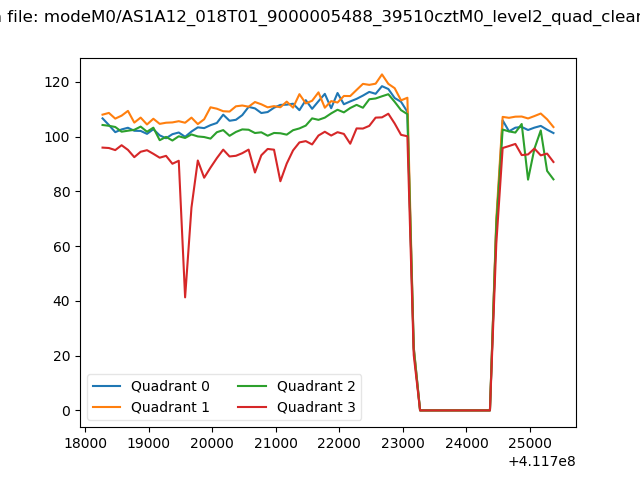 |
|
| Module-wise count rates for Quadrant A Data is divided into 100 sec bins |
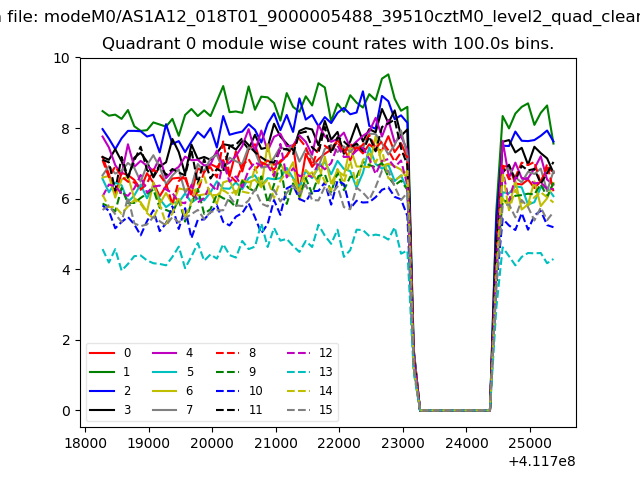 |
 |
| Module-wise count rates for Quadrant B Data is divided into 100 sec bins |
 |
 |
| Module-wise count rates for Quadrant C Data is divided into 100 sec bins |
 |
 |
| Module-wise count rates for Quadrant D Data is divided into 100 sec bins |
 |
 |
| Parameter | Plot |
|---|---|
| CZT HV Monitor | 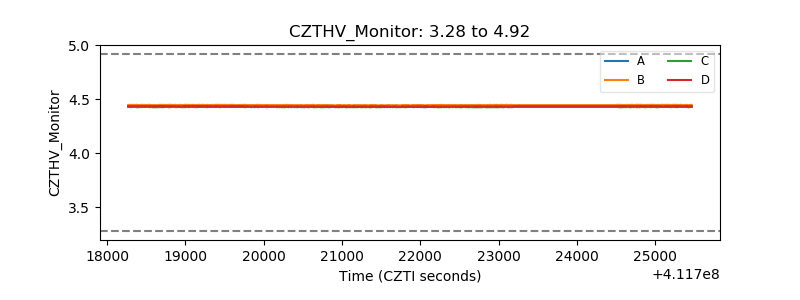 |
| D_VDD | 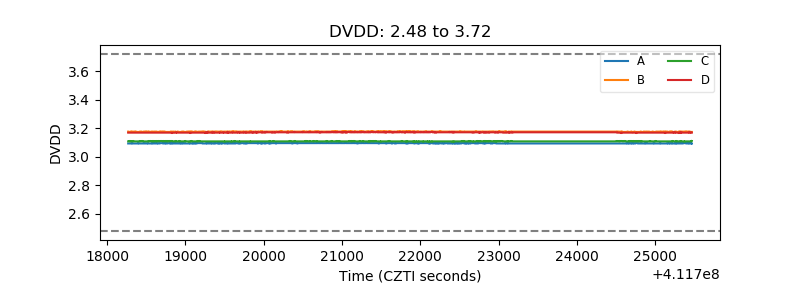 |
| Temperature 1 | 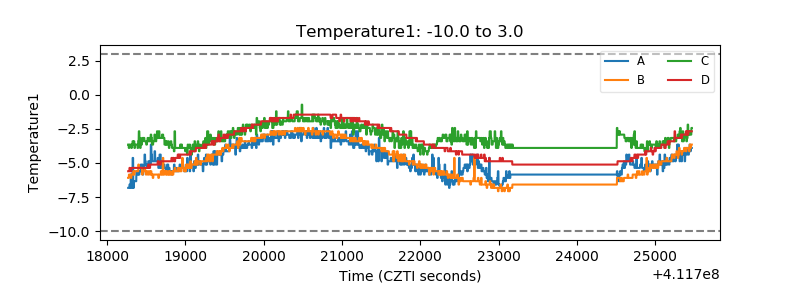 |
| Veto HV Monitor | 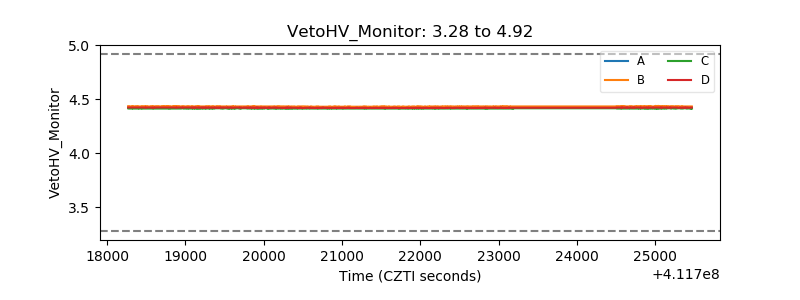 |
| Veto LLD | 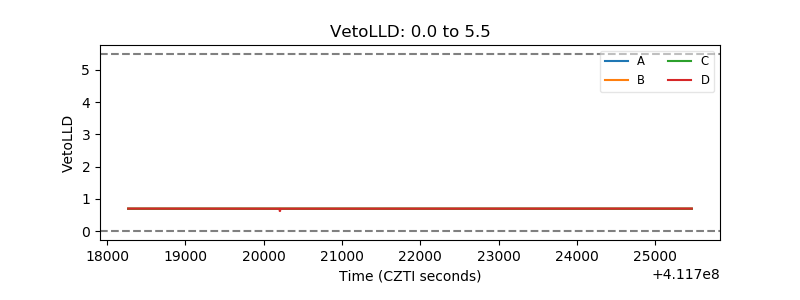 |
| Alpha Counter | 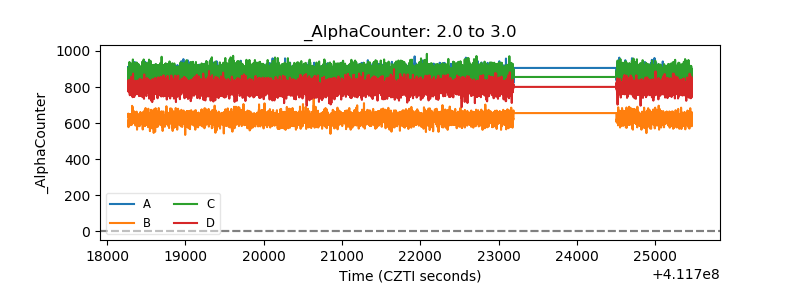 |
| _CPM_Rate | 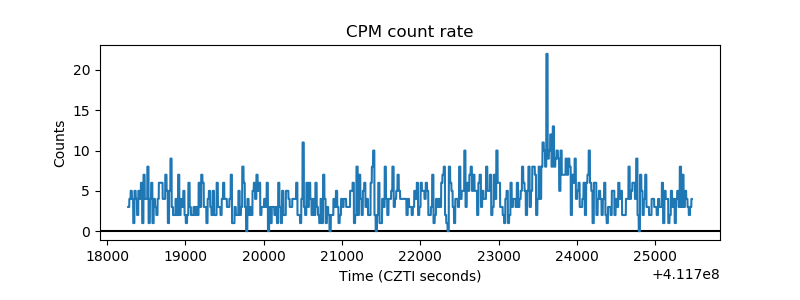 |
| CZT Counter | 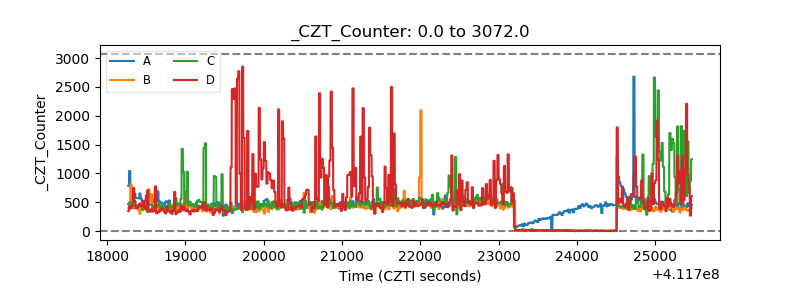 |
| +2.5 Volts monitor | 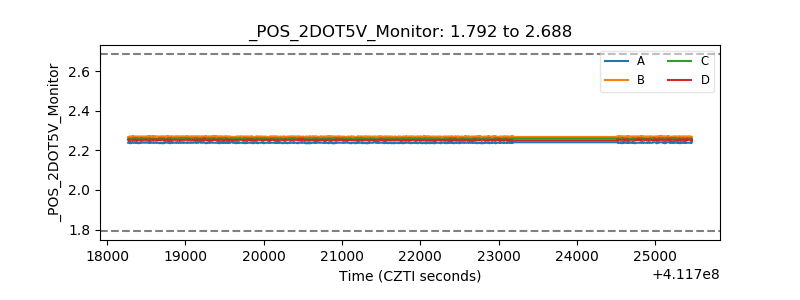 |
| +5 Volts monitor | 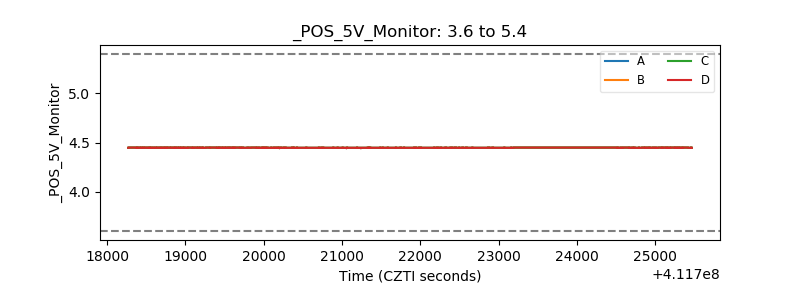 |
| _ROLL_ROT | 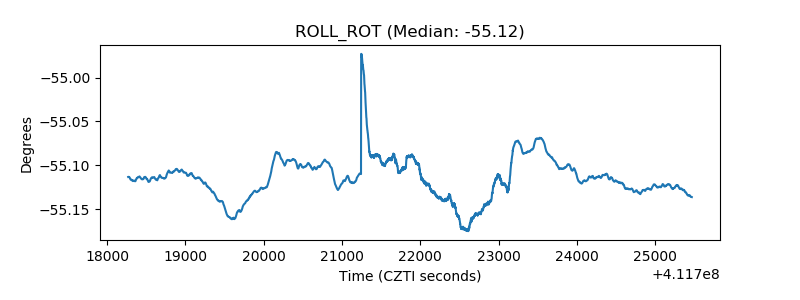 |
| _Roll_DEC | 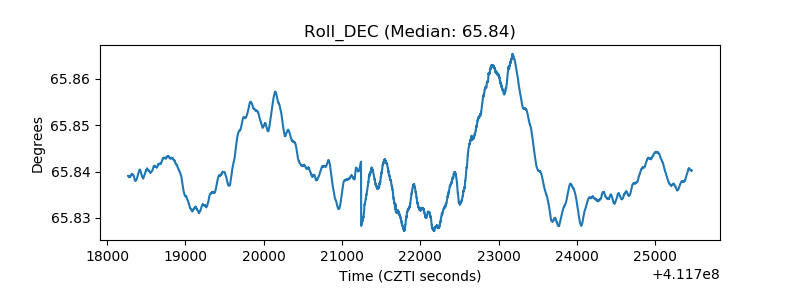 |
| _Roll_RA | 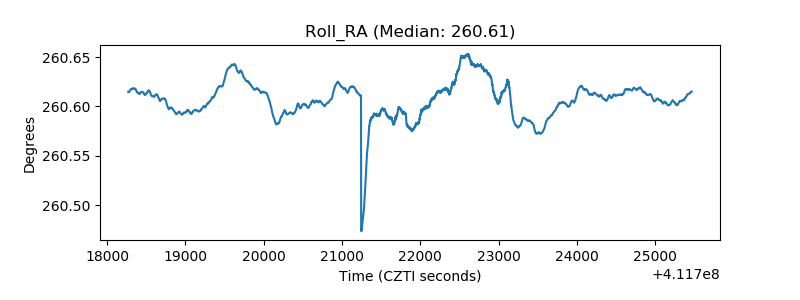 |
| Veto Counter | 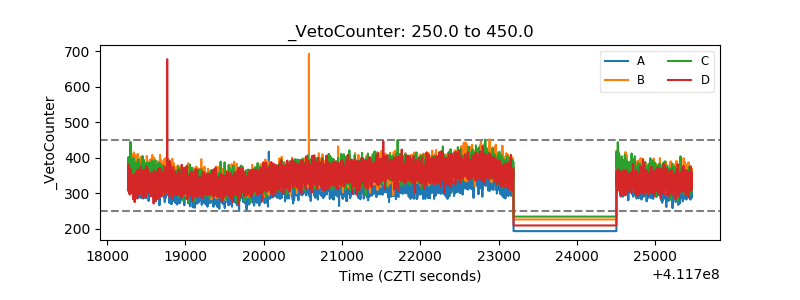 |