| Param | Original file | Final file |
|---|---|---|
| Filename | modeM0/AS1A12_018T01_9000005488_39513cztM0_level2.fits | modeM0/AS1A12_018T01_9000005488_39513cztM0_level2_quad_clean.evt |
| Size (bytes) | 1,159,344,000 | 241,603,200 |
| Size | 1.1 GB | 230.4 MB |
| Events in quadrant A | 9,063,501 | 1,643,094 |
| Events in quadrant B | 6,801,863 | 1,716,490 |
| Events in quadrant C | 15,211,348 | 1,456,340 |
| Events in quadrant D | 10,634,074 | 1,424,906 |
| Mode SS | |||
|---|---|---|---|
| Quadrant | BADHDUFLAG | Total packets | Discarded packets |
| A | 0 | 316 | 0 |
| B | 0 | 316 | 0 |
| C | 0 | 316 | 0 |
| D | 0 | 316 | 0 |
| Mode M0 | |||
|---|---|---|---|
| Quadrant | BADHDUFLAG | Total packets | Discarded packets |
| A | 0 | 36441 | 5 |
| B | 0 | 31615 | 4 |
| C | 0 | 55549 | 4 |
| D | 0 | 42813 | 4 |
| Mode M9 | |||
|---|---|---|---|
| Quadrant | BADHDUFLAG | Total packets | Discarded packets |
| A | 0 | 45 | 0 |
| B | 0 | 45 | 0 |
| C | 0 | 45 | 0 |
| D | 0 | 46 | 0 |
| Quadrant | Total seconds | Saturated seconds | Saturation percentage |
|---|---|---|---|
| A | 15567 | 455 | 2.922850% |
| B | 15567 | 41 | 0.263378% |
| C | 15567 | 1777 | 11.415173% |
| D | 15567 | 919 | 5.903514% |
Noise dominated data is calculated using 1-second bins in cleaned event files. If a bin has >2000 counts, and if more than 50% of those come from <1% of pixels, then it is considered to be noise-dominated and hence unusable.
| Quadrant | # 1 sec bins | Bins with >0 counts | Bins with >2000 counts | High rate bins dominated by noise | Noise dominated (total time) | Noise dominated (detector-on time) | Marked lightcurve |
|---|---|---|---|---|---|---|---|
| A | 19807 | 15570 | 392 | 392 | 1.98% | 2.52% | 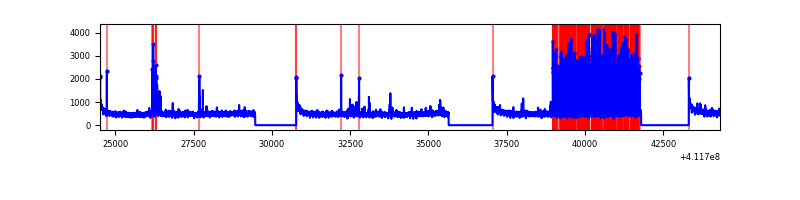 |
| B | 19807 | 15570 | 14 | 14 | 0.07% | 0.09% | 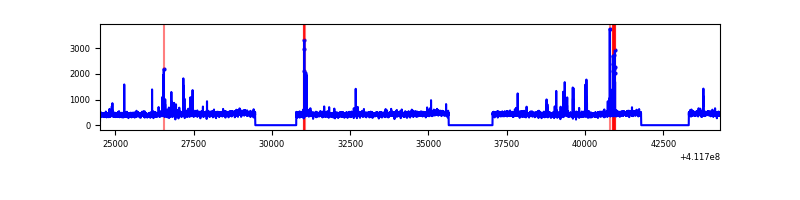 |
| C | 19807 | 15570 | 1707 | 1707 | 8.62% | 10.96% | 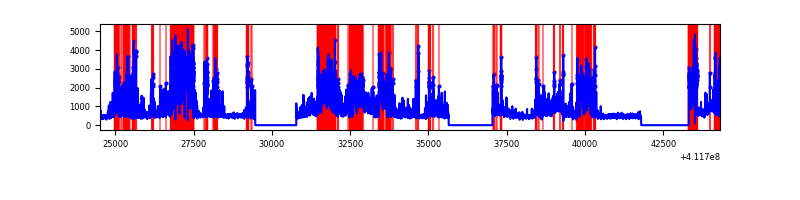 |
| D | 19807 | 15570 | 875 | 875 | 4.42% | 5.62% | 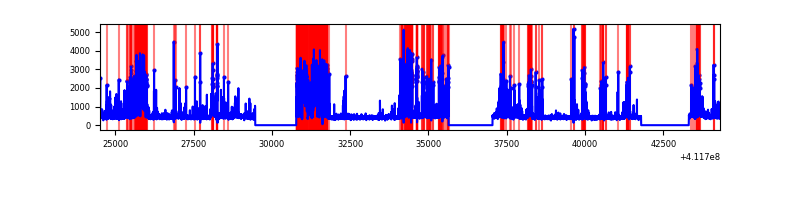 |
Top three noisy pixels from each quadrant. If the there are fewer than three noisy pixels in the level2.evt file, extra rows are filled as -1
| Pixel properties | Quadrant properties | ||||||
|---|---|---|---|---|---|---|---|
| Quadrant | DetID | PixID | Counts | Sigma | Mean | Median | Sigma |
| A | 7 | 192 | 1250300 | 3705.93 | 1664 | 1631 | 336.9 |
| A | 10 | 83 | 1116480 | 3308.76 | 1664 | 1631 | 336.9 |
| A | 13 | 248 | 167629 | 492.67 | 1664 | 1631 | 336.9 |
| B | 5 | 172 | 99998 | 306.42 | 1671 | 1621 | 321.1 |
| B | 5 | 255 | 83976 | 256.51 | 1671 | 1621 | 321.1 |
| B | 12 | 111 | 41665 | 124.73 | 1671 | 1621 | 321.1 |
| C | 9 | 187 | 7139594 | 19787.47 | 1554 | 1562 | 360.7 |
| C | 15 | 208 | 1395498 | 3864.16 | 1554 | 1562 | 360.7 |
| C | 15 | 214 | 610117 | 1686.99 | 1554 | 1562 | 360.7 |
| D | 12 | 227 | 2066297 | 5263.81 | 1612 | 1563 | 392.3 |
| D | 2 | 249 | 1134307 | 2887.8 | 1612 | 1563 | 392.3 |
| D | 13 | 249 | 958043 | 2438.44 | 1612 | 1563 | 392.3 |
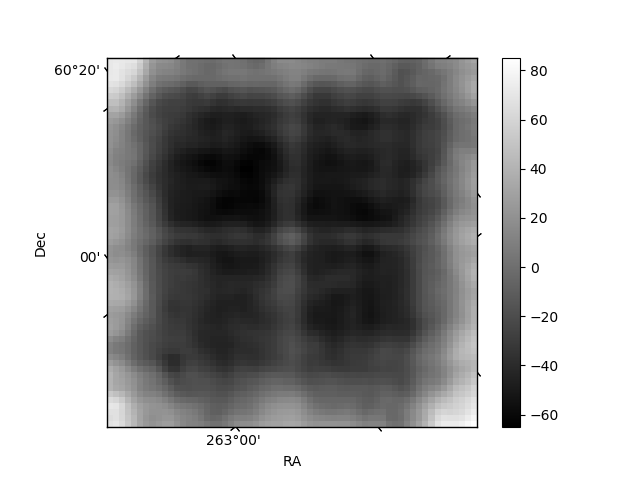
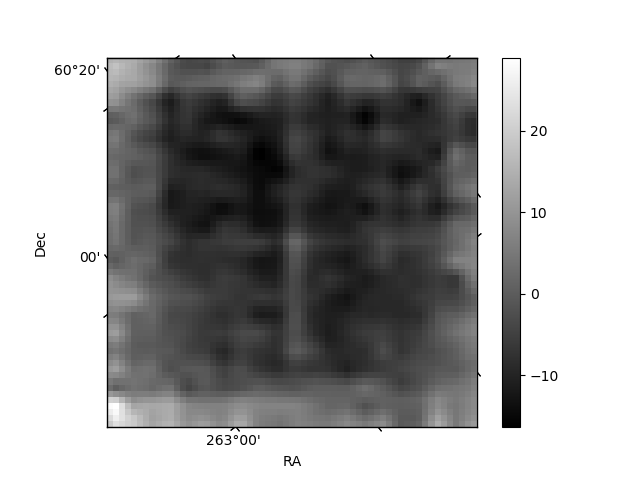
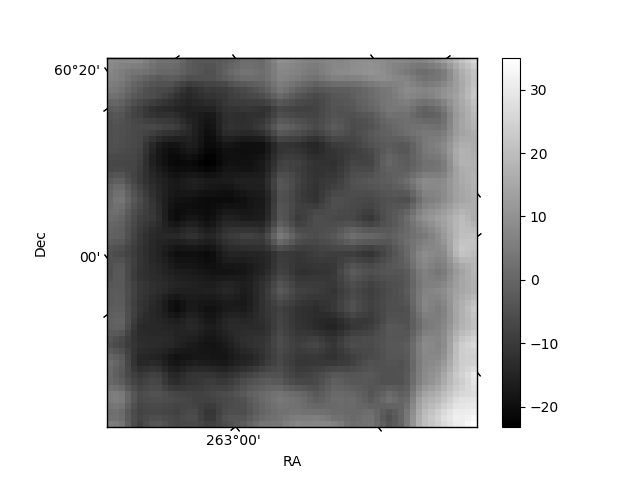
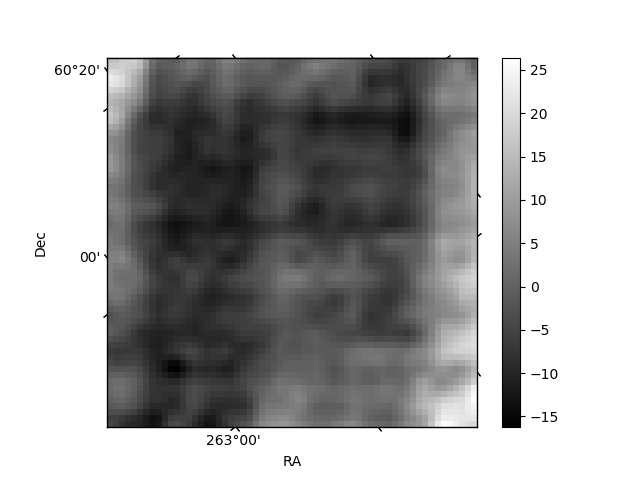
Histogram calculated using DETX and DETY for each event in the final _common_clean file
| Quadrant A | 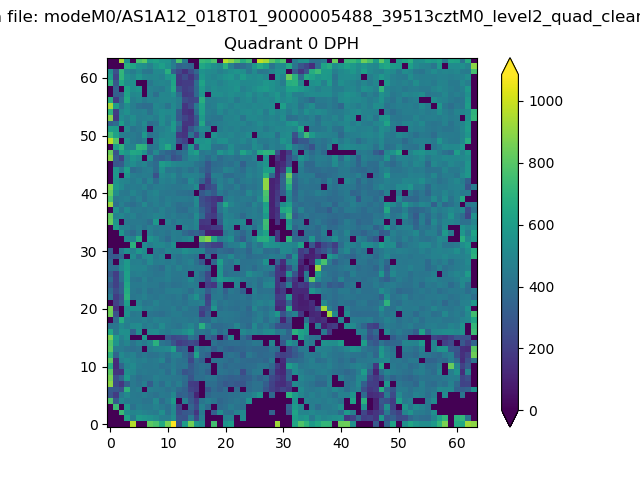 |
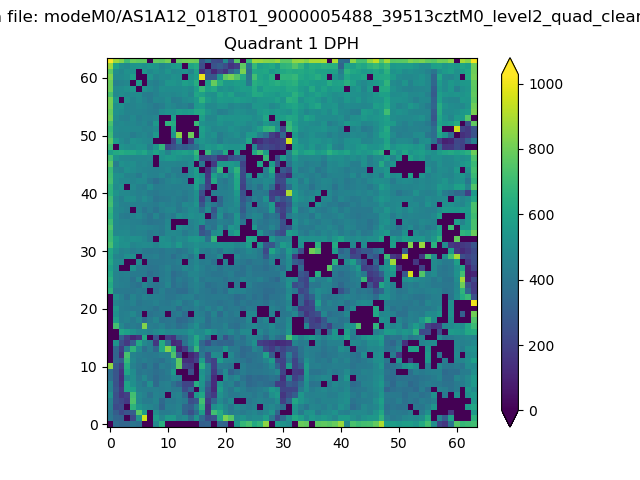 |
Quadrant B |
|---|---|---|---|
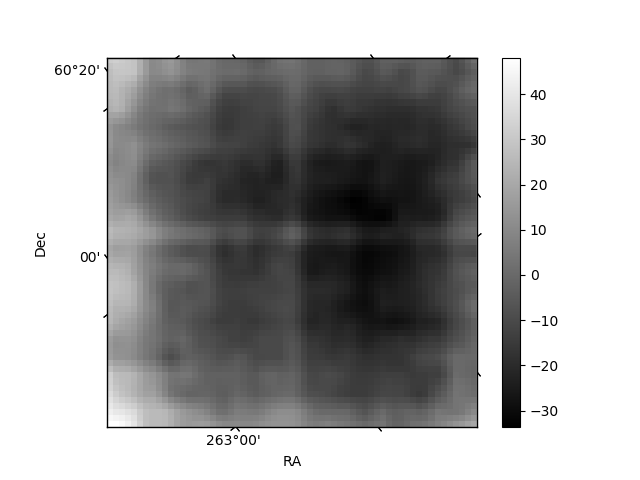
| Quadrant D | 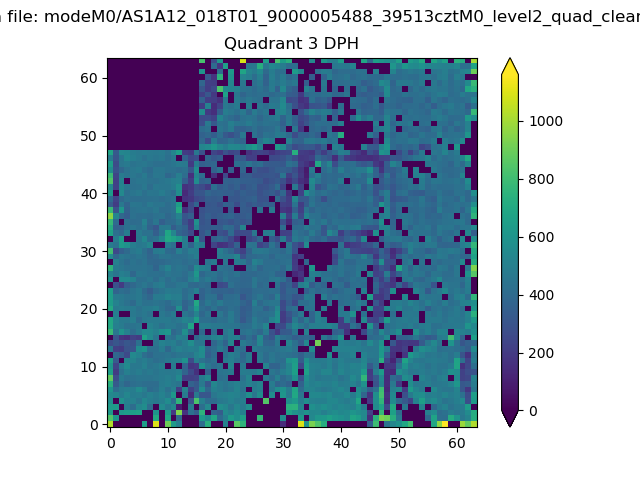 |
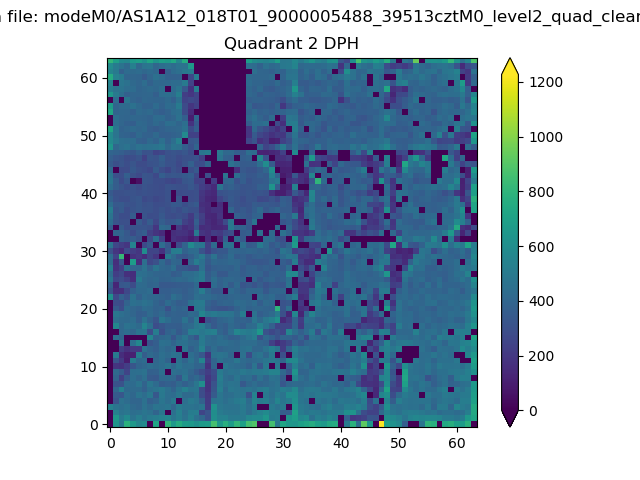 |
Quadrant C |
| Plot type | Count rate plots | Images |
|---|---|---|
| Comparison with Poisson distribution Blue bars denote a histogram of data divided into 1 sec bins. Red curve is a Poisson curve with rate = median count rate of data. |
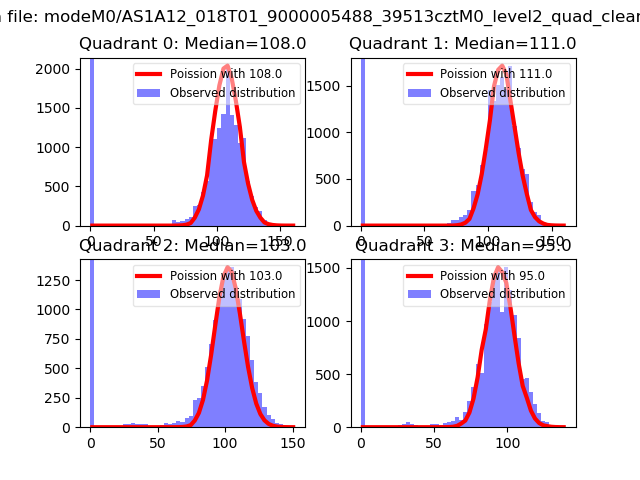 |
 |
| Quadrant-wise count rates Data is divided into 100 sec bins |
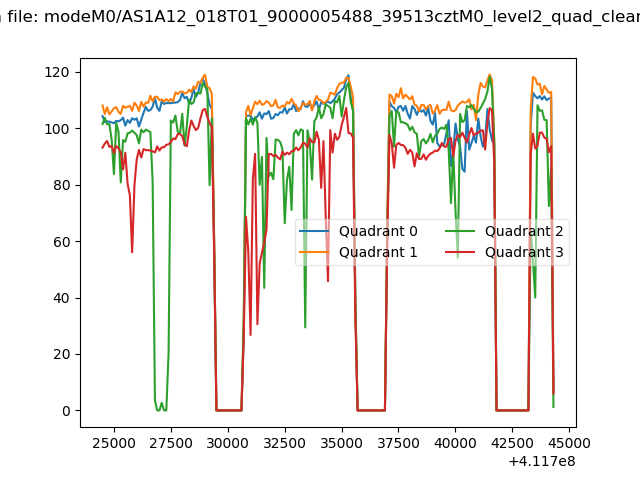 |
|
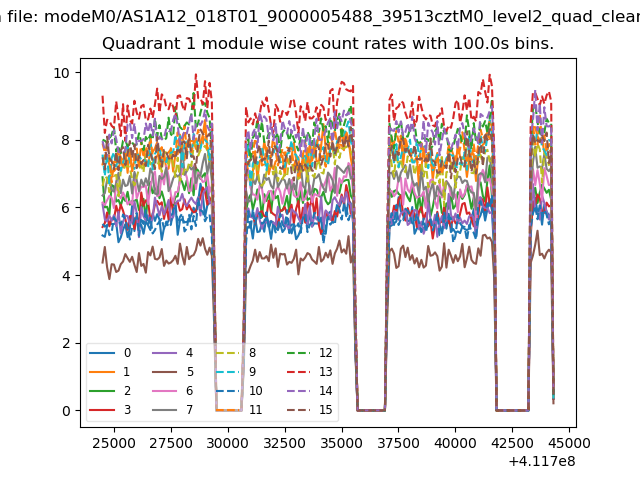
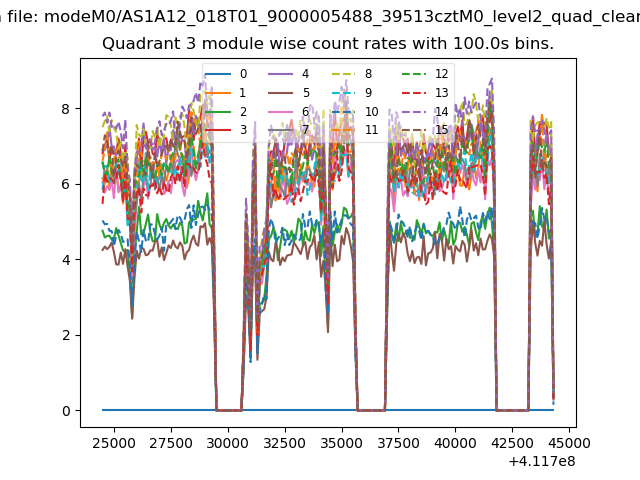
| Module-wise count rates for Quadrant A Data is divided into 100 sec bins |
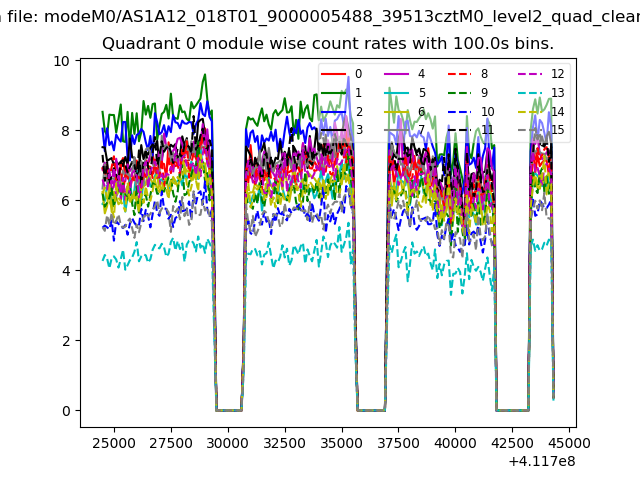 |
 |
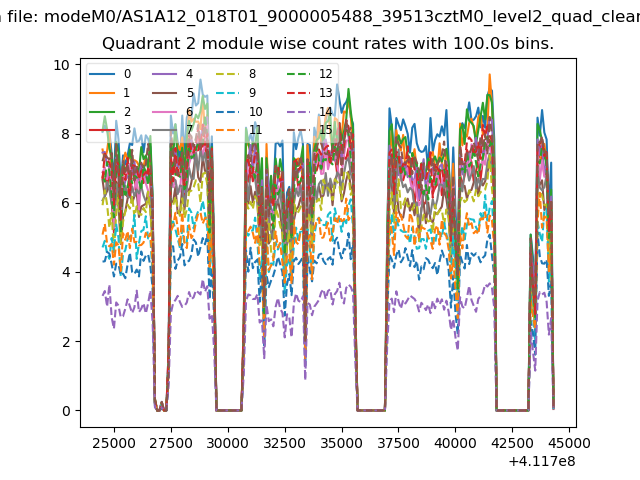
| Module-wise count rates for Quadrant B Data is divided into 100 sec bins |
 |
 |
| Module-wise count rates for Quadrant C Data is divided into 100 sec bins |
 |
 |
| Module-wise count rates for Quadrant D Data is divided into 100 sec bins |
 |
 |
| Parameter | Plot |
|---|---|
| CZT HV Monitor | 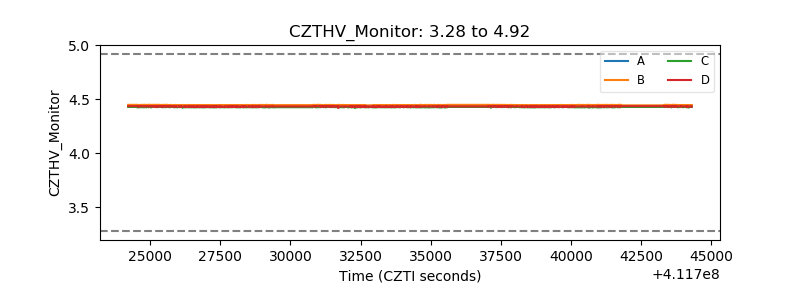 |
| D_VDD | 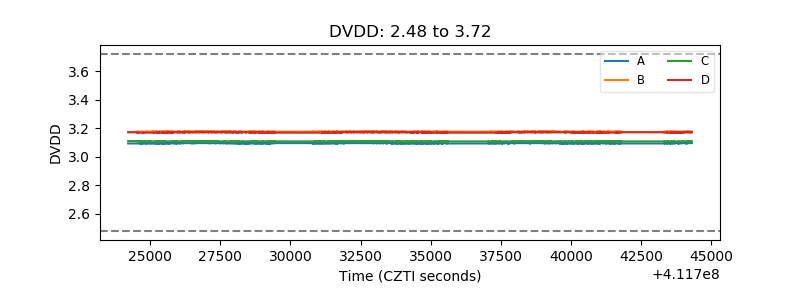 |
| Temperature 1 | 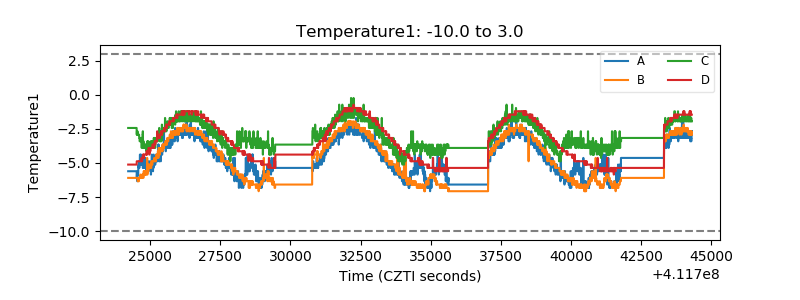 |
| Veto HV Monitor | 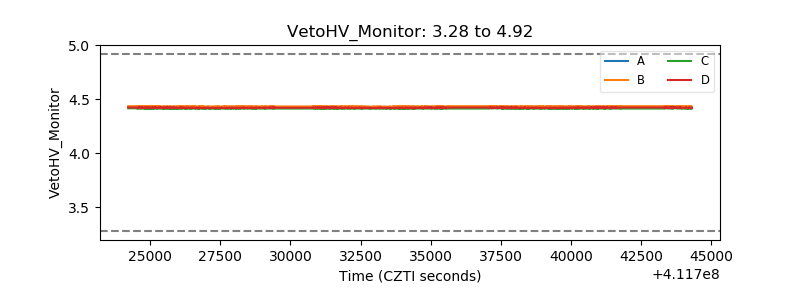 |
| Veto LLD | 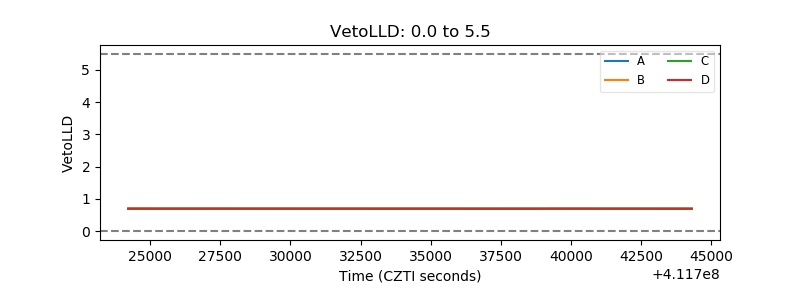 |
| Alpha Counter | 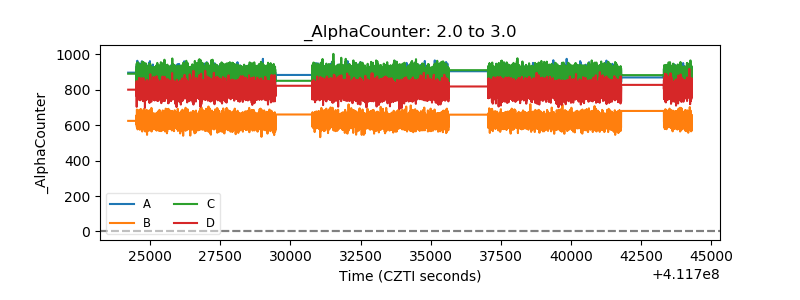 |
| _CPM_Rate | 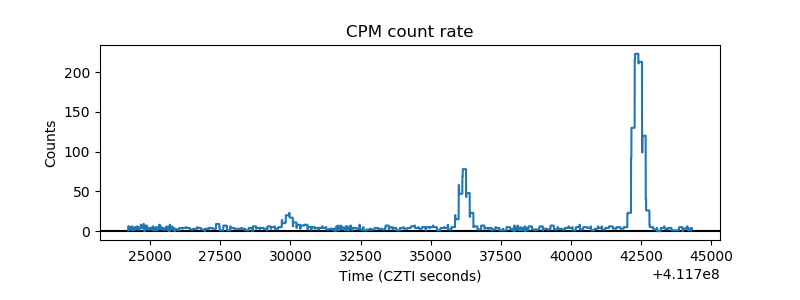 |
| CZT Counter | 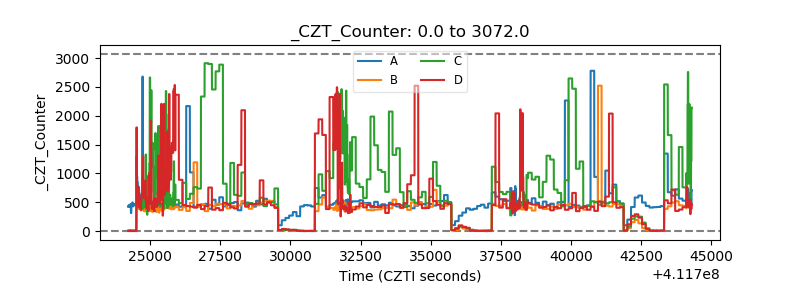 |
| +2.5 Volts monitor | 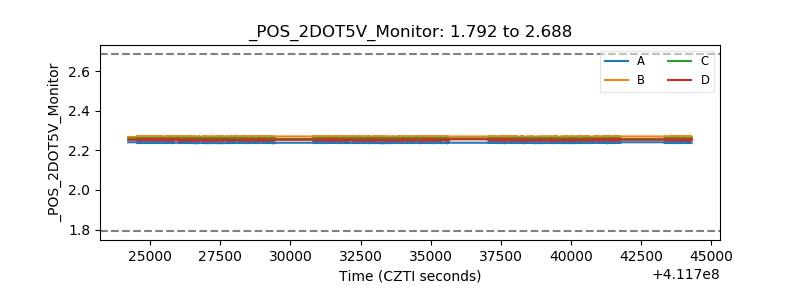 |
| +5 Volts monitor | 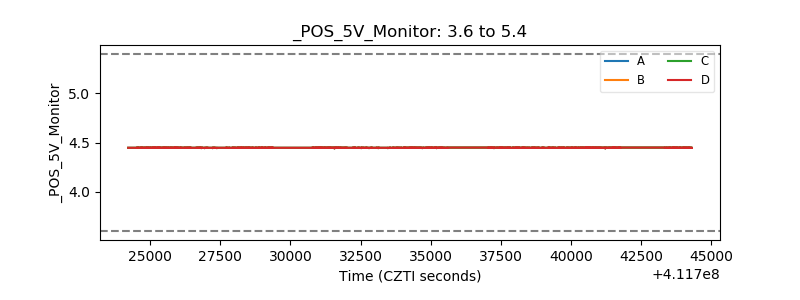 |
| _ROLL_ROT | 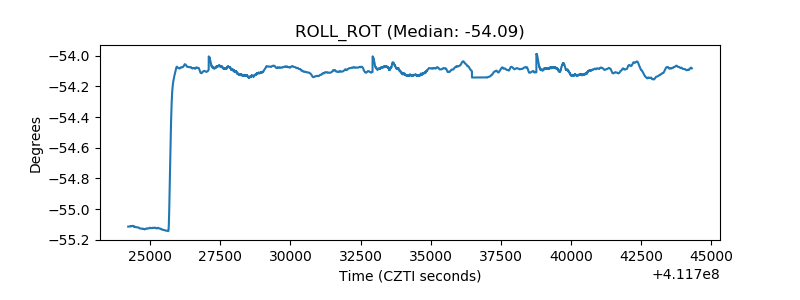 |
| _Roll_DEC | 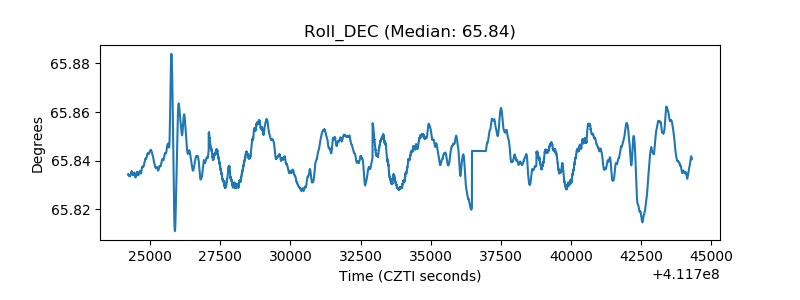 |
| _Roll_RA | 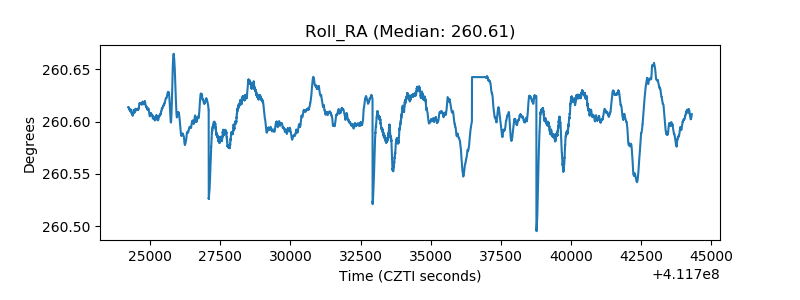 |
| Veto Counter | 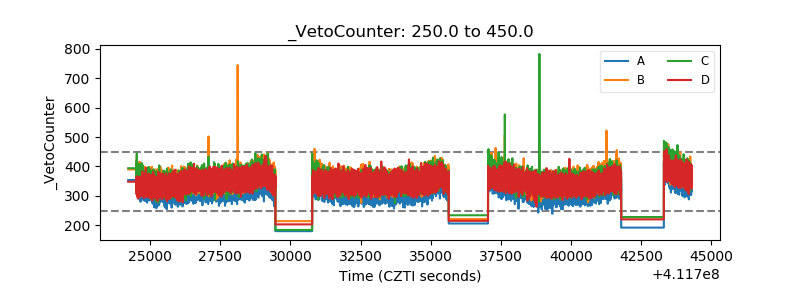 |