| Param | Original file | Final file |
|---|---|---|
| Filename | modeM0/AS1A12_018T01_9000005488_39514cztM0_level2.fits | modeM0/AS1A12_018T01_9000005488_39514cztM0_level2_quad_clean.evt |
| Size (bytes) | 445,602,240 | 89,337,600 |
| Size | 425.0 MB | 85.2 MB |
| Events in quadrant A | 2,926,543 | 636,968 |
| Events in quadrant B | 2,465,304 | 652,249 |
| Events in quadrant C | 7,469,703 | 451,190 |
| Events in quadrant D | 3,186,418 | 563,549 |
| Mode SS | |||
|---|---|---|---|
| Quadrant | BADHDUFLAG | Total packets | Discarded packets |
| A | 0 | 116 | 0 |
| B | 0 | 116 | 0 |
| C | 0 | 116 | 0 |
| D | 0 | 116 | 0 |
| Mode M0 | |||
|---|---|---|---|
| Quadrant | BADHDUFLAG | Total packets | Discarded packets |
| A | 0 | 12365 | 3 |
| B | 0 | 11517 | 2 |
| C | 0 | 25973 | 2 |
| D | 0 | 13632 | 2 |
| Mode M9 | |||
|---|---|---|---|
| Quadrant | BADHDUFLAG | Total packets | Discarded packets |
| A | 0 | 18 | 0 |
| B | 0 | 18 | 0 |
| C | 0 | 18 | 0 |
| D | 0 | 19 | 0 |
| Quadrant | Total seconds | Saturated seconds | Saturation percentage |
|---|---|---|---|
| A | 5739 | 16 | 0.278794% |
| B | 5739 | 5 | 0.087123% |
| C | 5739 | 1690 | 29.447639% |
| D | 5739 | 118 | 2.056107% |
Noise dominated data is calculated using 1-second bins in cleaned event files. If a bin has >2000 counts, and if more than 50% of those come from <1% of pixels, then it is considered to be noise-dominated and hence unusable.
| Quadrant | # 1 sec bins | Bins with >0 counts | Bins with >2000 counts | High rate bins dominated by noise | Noise dominated (total time) | Noise dominated (detector-on time) | Marked lightcurve |
|---|---|---|---|---|---|---|---|
| A | 7382 | 5740 | 2 | 2 | 0.03% | 0.03% | 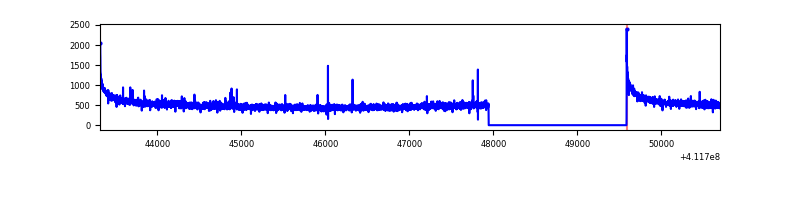 |
| B | 7382 | 5740 | 0 | 0 | 0.00% | 0.00% | 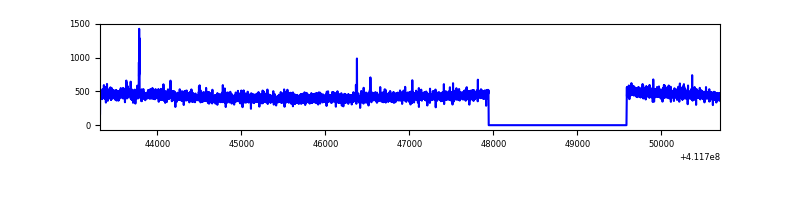 |
| C | 7382 | 5740 | 1585 | 1585 | 21.47% | 27.61% | 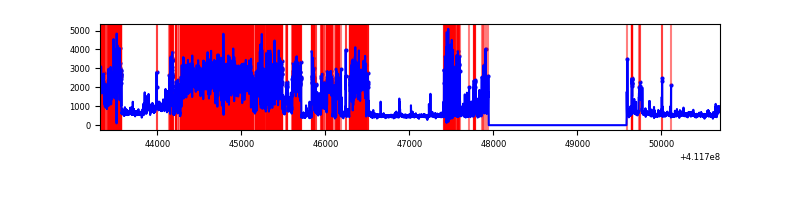 |
| D | 7382 | 5740 | 102 | 102 | 1.38% | 1.78% | 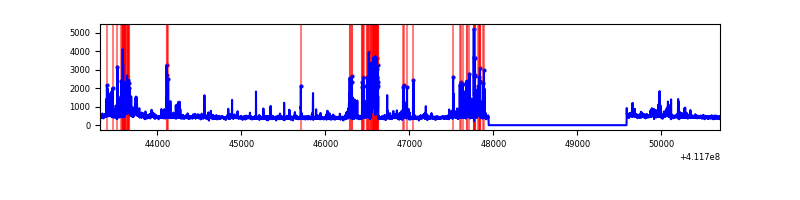 |
Top three noisy pixels from each quadrant. If the there are fewer than three noisy pixels in the level2.evt file, extra rows are filled as -1
| Pixel properties | Quadrant properties | ||||||
|---|---|---|---|---|---|---|---|
| Quadrant | DetID | PixID | Counts | Sigma | Mean | Median | Sigma |
| A | 10 | 83 | 463203 | 3586.34 | 627 | 614 | 129.0 |
| A | 15 | 222 | 17831 | 133.48 | 627 | 614 | 129.0 |
| A | 6 | 10 | 13059 | 96.48 | 627 | 614 | 129.0 |
| B | 12 | 111 | 15132 | 120.79 | 622 | 604 | 120.3 |
| B | 0 | 214 | 14720 | 117.37 | 622 | 604 | 120.3 |
| B | 11 | 111 | 14136 | 112.51 | 622 | 604 | 120.3 |
| C | 9 | 187 | 4299996 | 34345.49 | 537 | 542 | 125.2 |
| C | 15 | 208 | 832423 | 6645.35 | 537 | 542 | 125.2 |
| C | 15 | 214 | 213667 | 1702.51 | 537 | 542 | 125.2 |
| D | 2 | 249 | 468490 | 3158.64 | 609 | 591 | 148.1 |
| D | 13 | 249 | 136434 | 917.03 | 609 | 591 | 148.1 |
| D | 12 | 227 | 86240 | 578.19 | 609 | 591 | 148.1 |
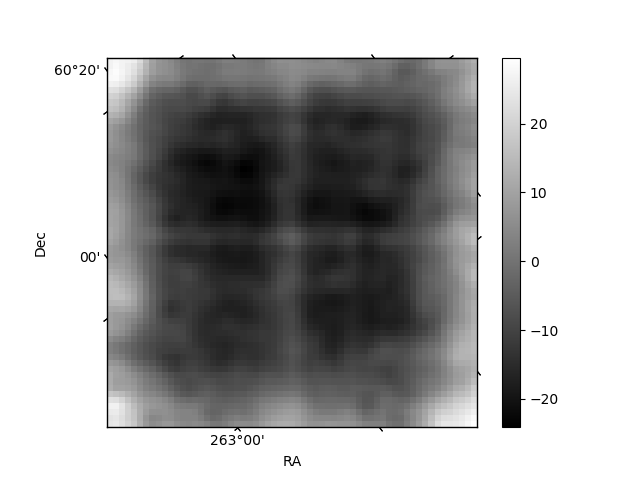
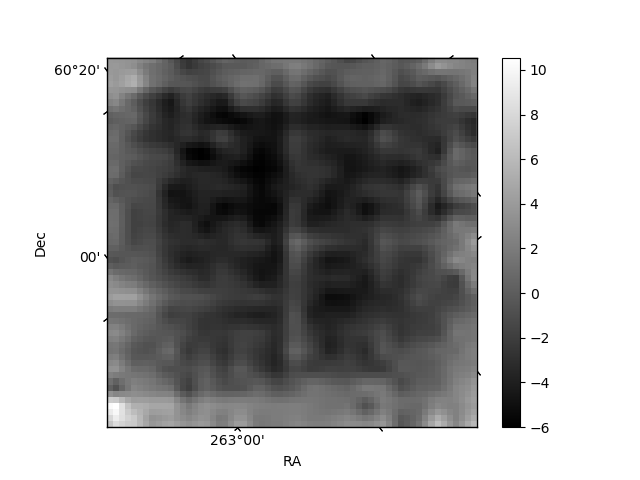
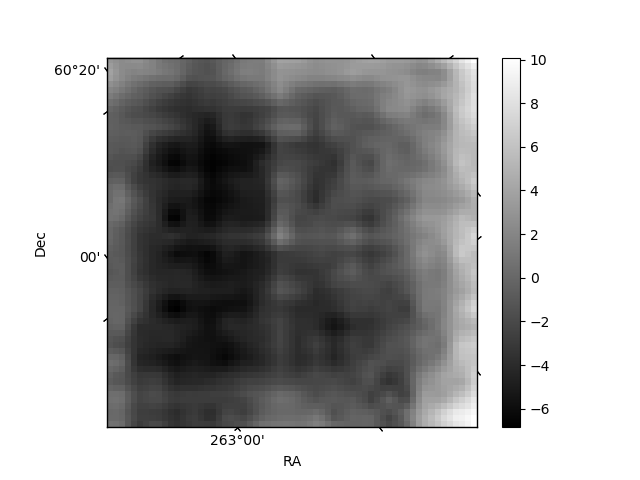
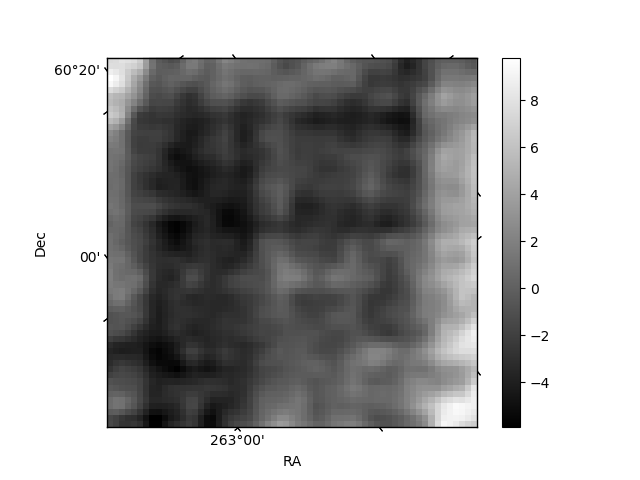
Histogram calculated using DETX and DETY for each event in the final _common_clean file
| Quadrant A | 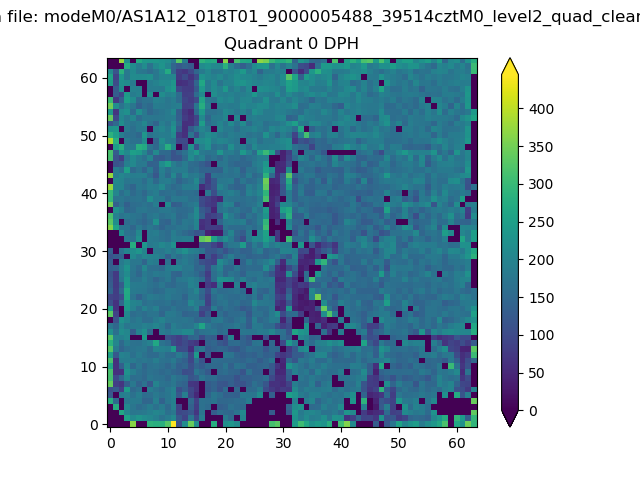 |
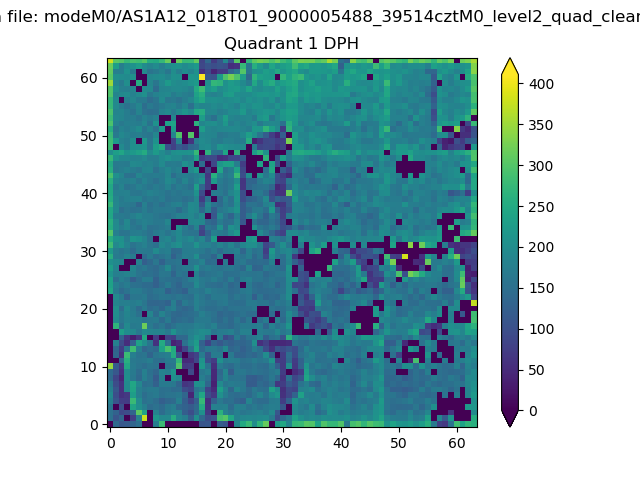 |
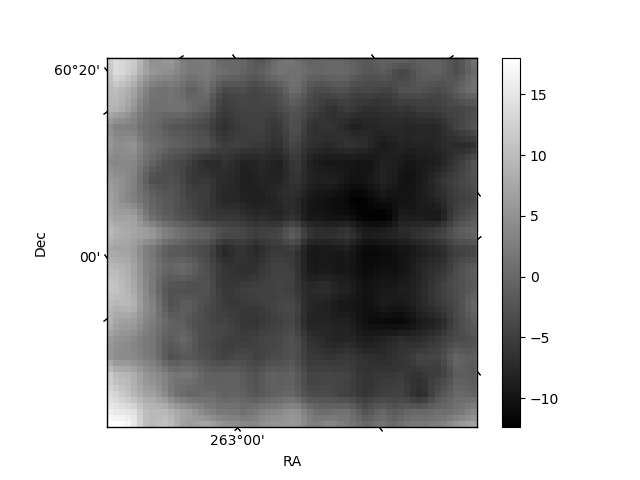
Quadrant B |
|---|---|---|---|
| Quadrant D | 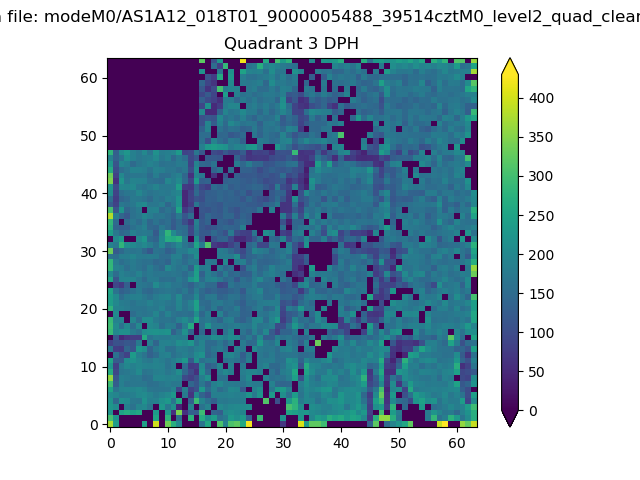 |
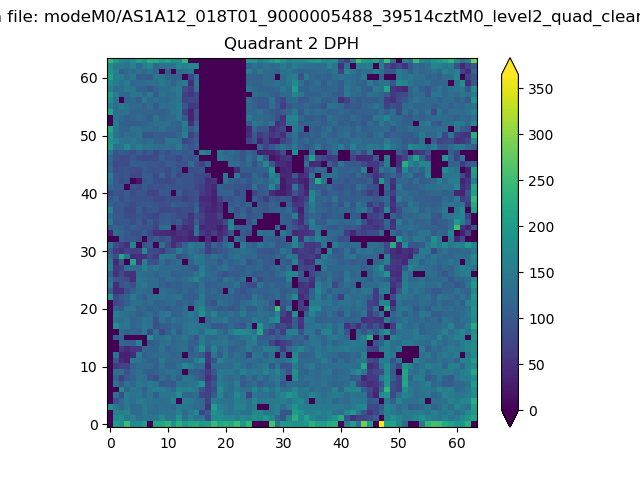 |
Quadrant C |
| Plot type | Count rate plots | Images |
|---|---|---|
| Comparison with Poisson distribution Blue bars denote a histogram of data divided into 1 sec bins. Red curve is a Poisson curve with rate = median count rate of data. |
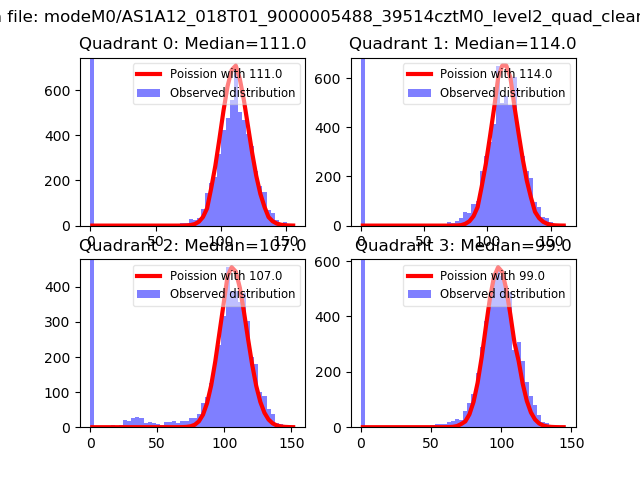 |
 |
| Quadrant-wise count rates Data is divided into 100 sec bins |
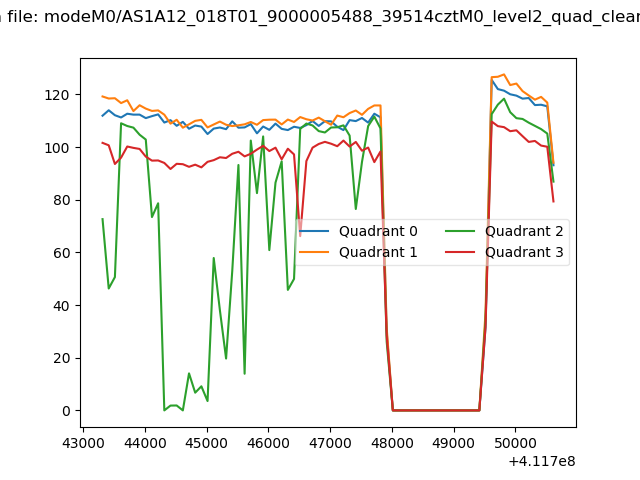 |
|
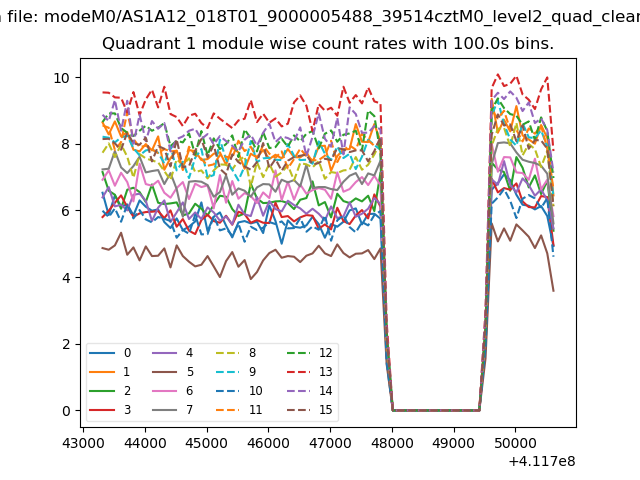
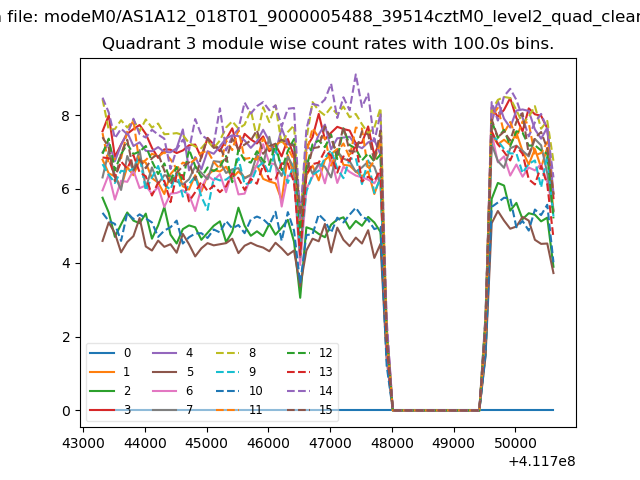
| Module-wise count rates for Quadrant A Data is divided into 100 sec bins |
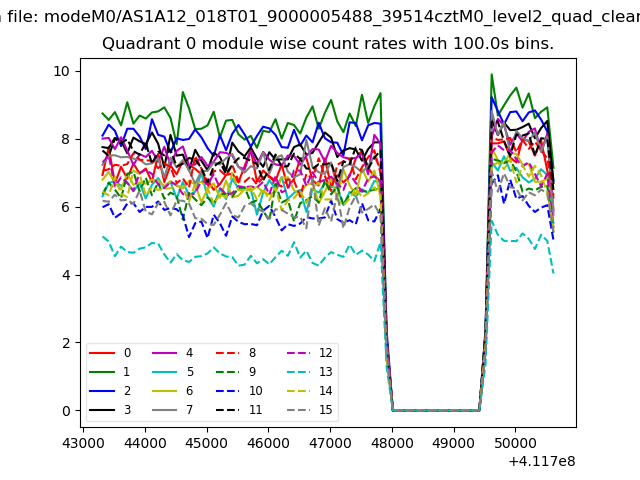 |
 |
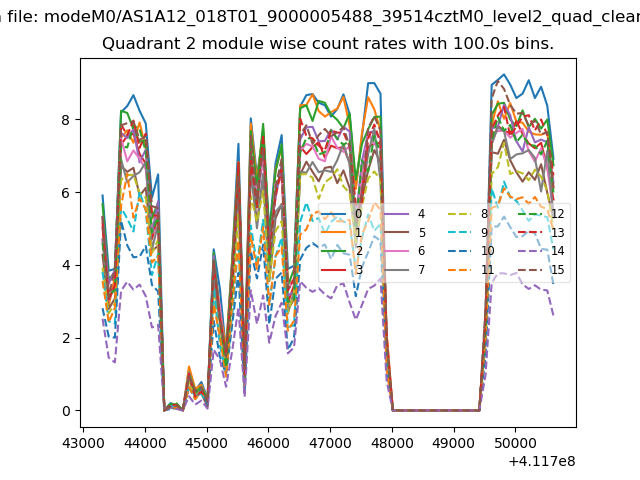
| Module-wise count rates for Quadrant B Data is divided into 100 sec bins |
 |
 |
| Module-wise count rates for Quadrant C Data is divided into 100 sec bins |
 |
 |
| Module-wise count rates for Quadrant D Data is divided into 100 sec bins |
 |
 |
| Parameter | Plot |
|---|---|
| CZT HV Monitor | 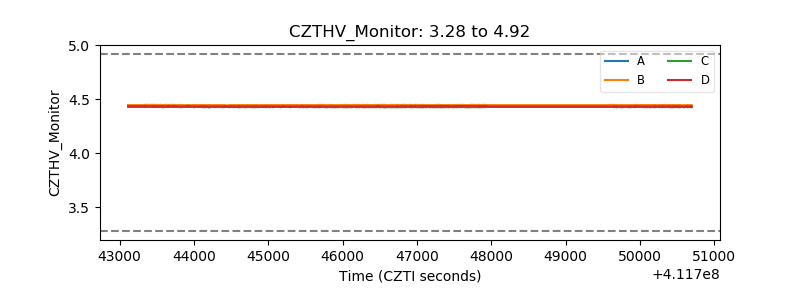 |
| D_VDD | 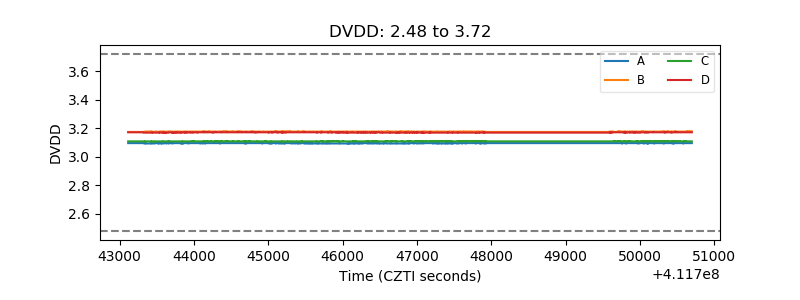 |
| Temperature 1 | 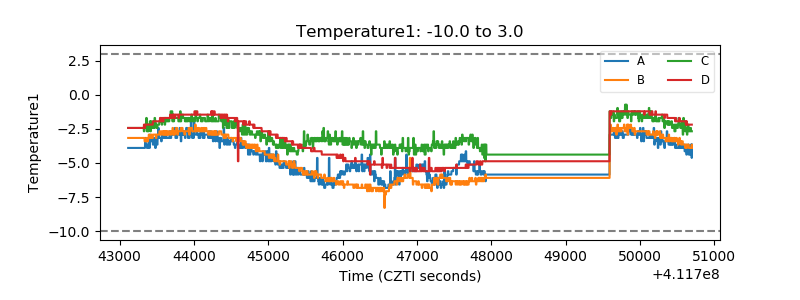 |
| Veto HV Monitor |  |
| Veto LLD | 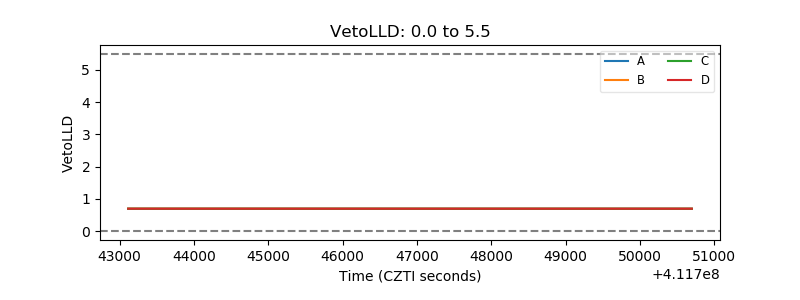 |
| Alpha Counter | 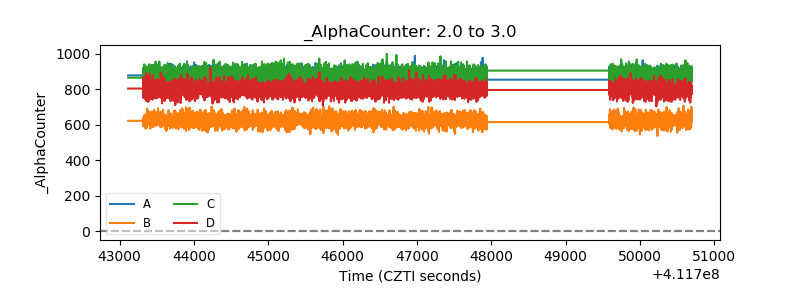 |
| _CPM_Rate | 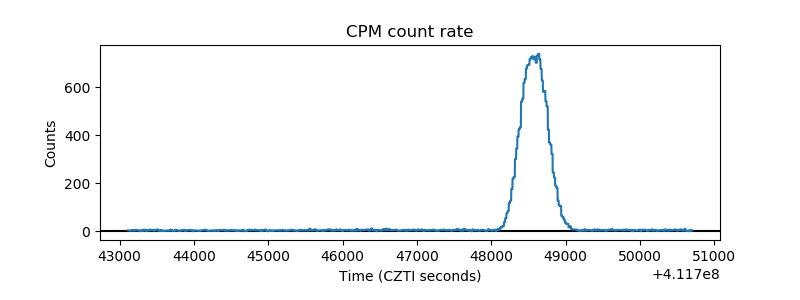 |
| CZT Counter | 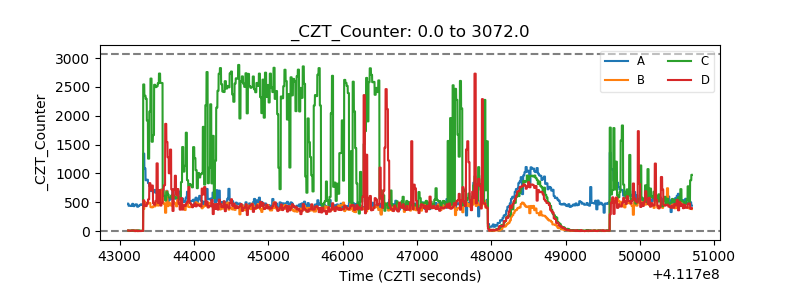 |
| +2.5 Volts monitor | 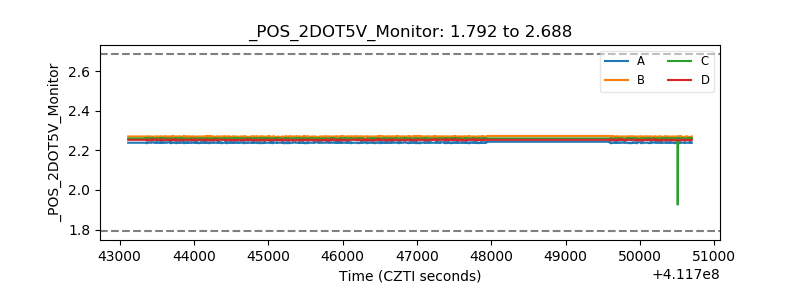 |
| +5 Volts monitor | 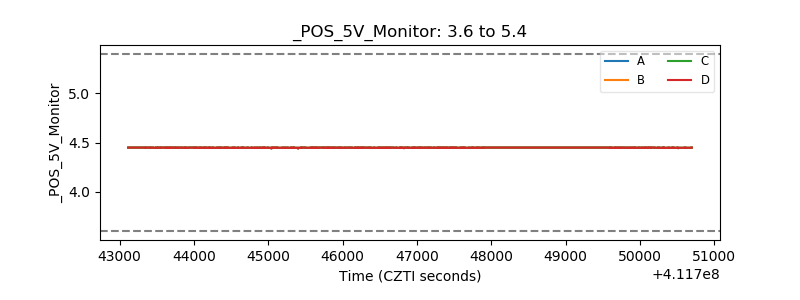 |
| _ROLL_ROT | 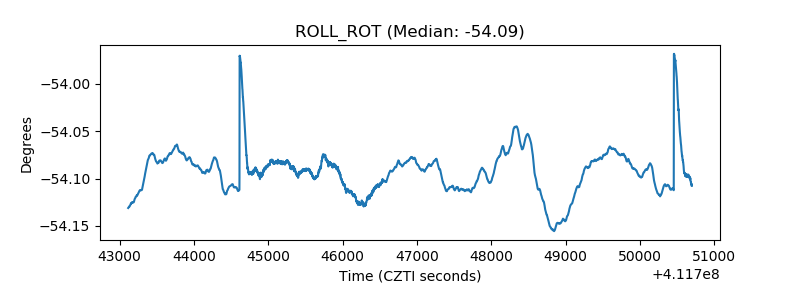 |
| _Roll_DEC | 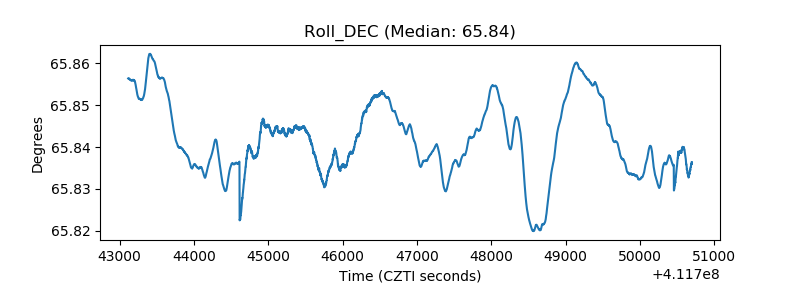 |
| _Roll_RA | 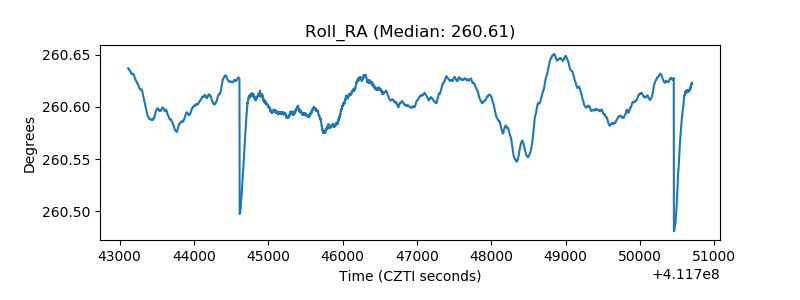 |
| Veto Counter | 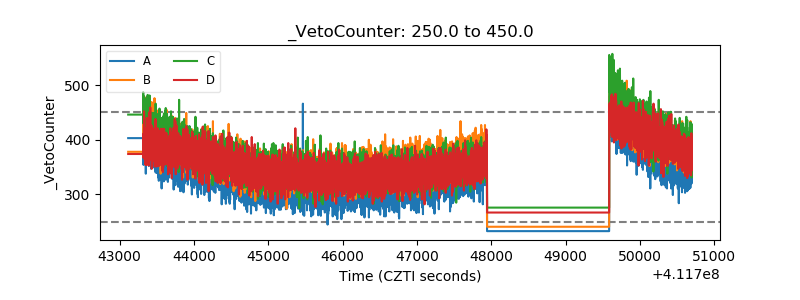 |