| Param | Original file | Final file |
|---|---|---|
| Filename | modeM0/AS1A12_018T01_9000005488_39516cztM0_level2.fits | modeM0/AS1A12_018T01_9000005488_39516cztM0_level2_quad_clean.evt |
| Size (bytes) | 413,447,040 | 91,661,760 |
| Size | 394.3 MB | 87.4 MB |
| Events in quadrant A | 3,420,034 | 620,912 |
| Events in quadrant B | 2,436,582 | 654,072 |
| Events in quadrant C | 6,296,182 | 536,339 |
| Events in quadrant D | 2,719,257 | 575,482 |
| Mode SS | |||
|---|---|---|---|
| Quadrant | BADHDUFLAG | Total packets | Discarded packets |
| A | 0 | 112 | 0 |
| B | 0 | 112 | 0 |
| C | 0 | 112 | 0 |
| D | 0 | 112 | 0 |
| Mode M0 | |||
|---|---|---|---|
| Quadrant | BADHDUFLAG | Total packets | Discarded packets |
| A | 0 | 13695 | 3 |
| B | 0 | 11223 | 2 |
| C | 0 | 22437 | 2 |
| D | 0 | 12094 | 2 |
| Mode M9 | |||
|---|---|---|---|
| Quadrant | BADHDUFLAG | Total packets | Discarded packets |
| A | 0 | 18 | 0 |
| B | 0 | 18 | 0 |
| C | 0 | 18 | 0 |
| D | 0 | 19 | 0 |
| Quadrant | Total seconds | Saturated seconds | Saturation percentage |
|---|---|---|---|
| A | 5558 | 230 | 4.138179% |
| B | 5558 | 13 | 0.233897% |
| C | 5558 | 945 | 17.002519% |
| D | 5558 | 37 | 0.665707% |
Noise dominated data is calculated using 1-second bins in cleaned event files. If a bin has >2000 counts, and if more than 50% of those come from <1% of pixels, then it is considered to be noise-dominated and hence unusable.
| Quadrant | # 1 sec bins | Bins with >0 counts | Bins with >2000 counts | High rate bins dominated by noise | Noise dominated (total time) | Noise dominated (detector-on time) | Marked lightcurve |
|---|---|---|---|---|---|---|---|
| A | 7321 | 5559 | 177 | 177 | 2.42% | 3.18% | 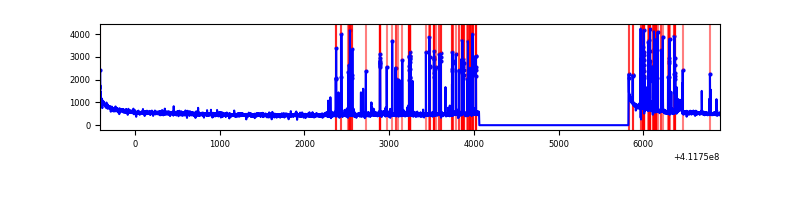 |
| B | 7321 | 5559 | 5 | 5 | 0.07% | 0.09% | 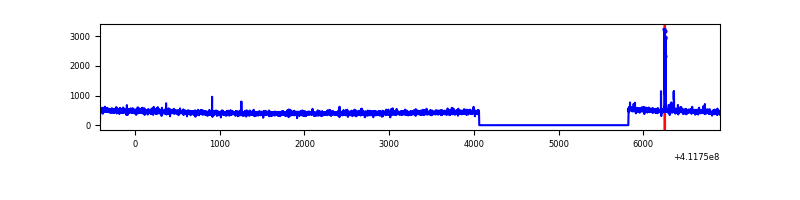 |
| C | 7321 | 5559 | 899 | 899 | 12.28% | 16.17% | 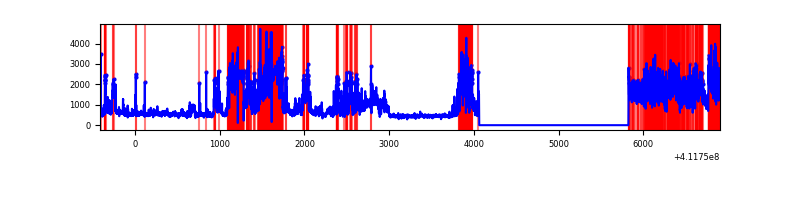 |
| D | 7321 | 5559 | 28 | 28 | 0.38% | 0.50% | 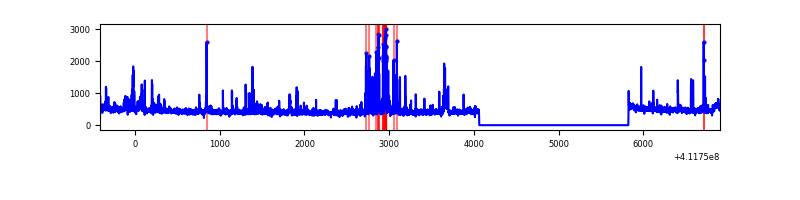 |
Top three noisy pixels from each quadrant. If the there are fewer than three noisy pixels in the level2.evt file, extra rows are filled as -1
| Pixel properties | Quadrant properties | ||||||
|---|---|---|---|---|---|---|---|
| Quadrant | DetID | PixID | Counts | Sigma | Mean | Median | Sigma |
| A | 10 | 83 | 450653 | 3644.45 | 604 | 592 | 123.5 |
| A | 7 | 192 | 322545 | 2607.07 | 604 | 592 | 123.5 |
| A | 6 | 10 | 234140 | 1891.2 | 604 | 592 | 123.5 |
| B | 15 | 85 | 25171 | 208.73 | 613 | 595 | 117.7 |
| B | 12 | 111 | 14540 | 118.43 | 613 | 595 | 117.7 |
| B | 11 | 111 | 13345 | 108.28 | 613 | 595 | 117.7 |
| C | 9 | 187 | 3803601 | 29124.83 | 562 | 564 | 130.6 |
| C | 15 | 214 | 217822 | 1663.83 | 562 | 564 | 130.6 |
| C | 3 | 110 | 51974 | 393.71 | 562 | 564 | 130.6 |
| D | 13 | 249 | 215762 | 1465.38 | 603 | 586 | 146.8 |
| D | 12 | 233 | 44798 | 301.09 | 603 | 586 | 146.8 |
| D | 2 | 250 | 40845 | 274.17 | 603 | 586 | 146.8 |
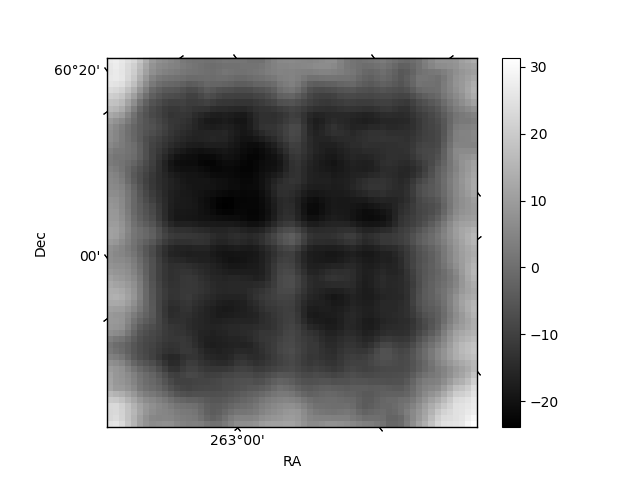
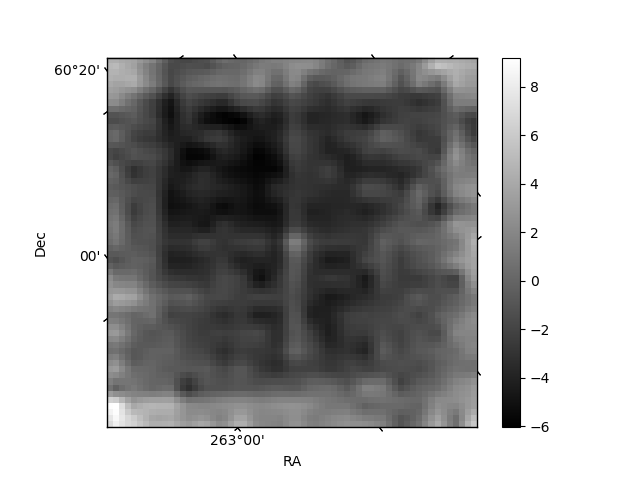
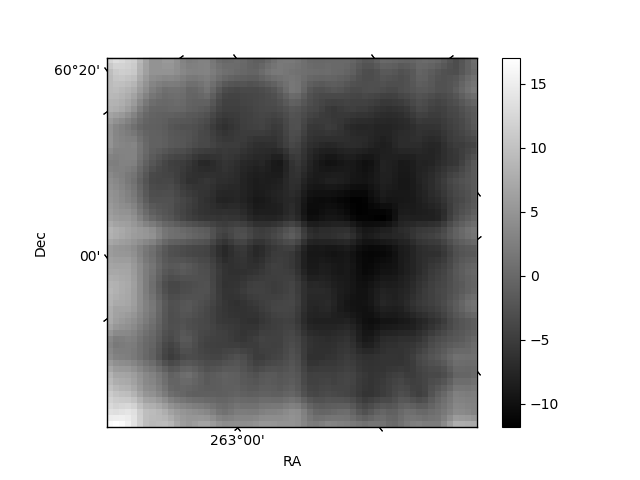
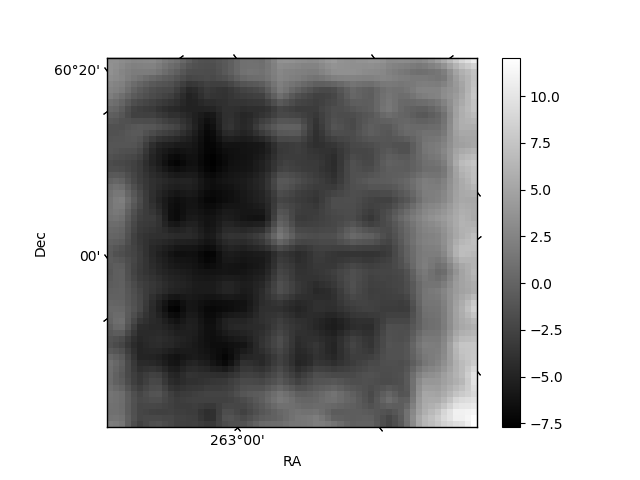
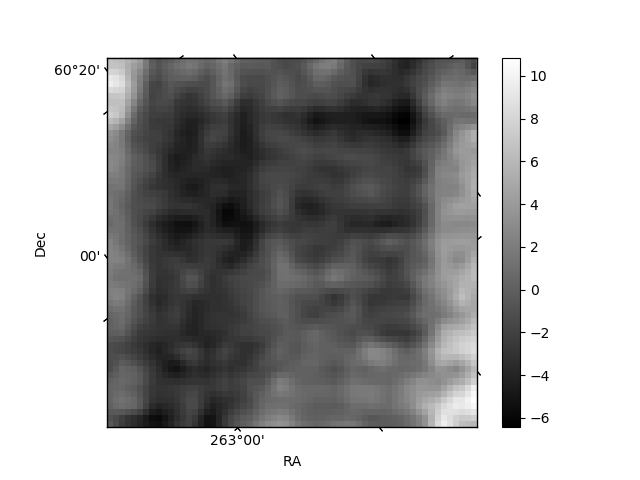
Histogram calculated using DETX and DETY for each event in the final _common_clean file
| Quadrant A | 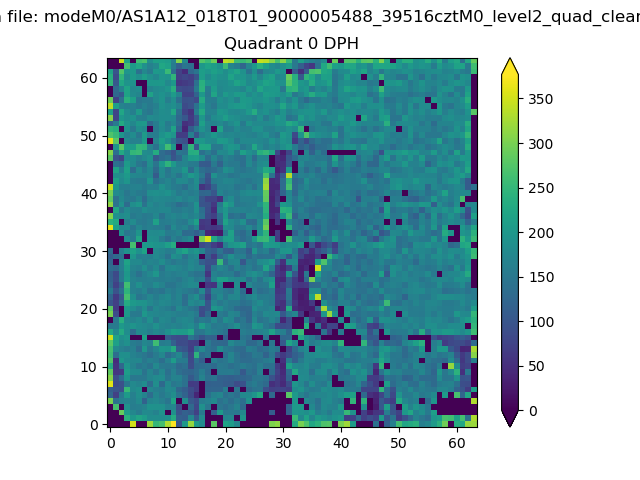 |
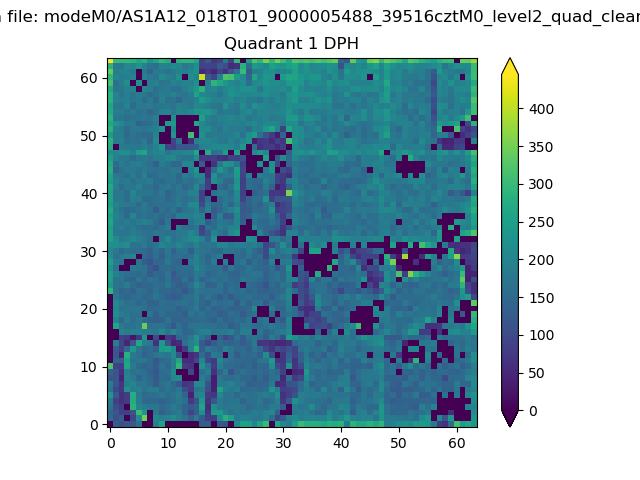 |
Quadrant B |
|---|---|---|---|
| Quadrant D | 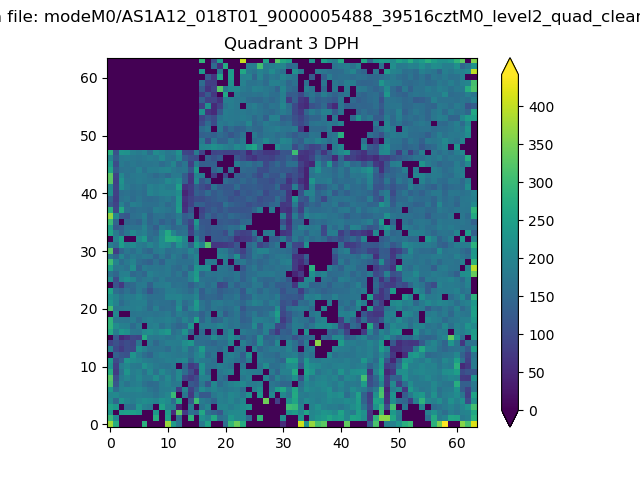 |
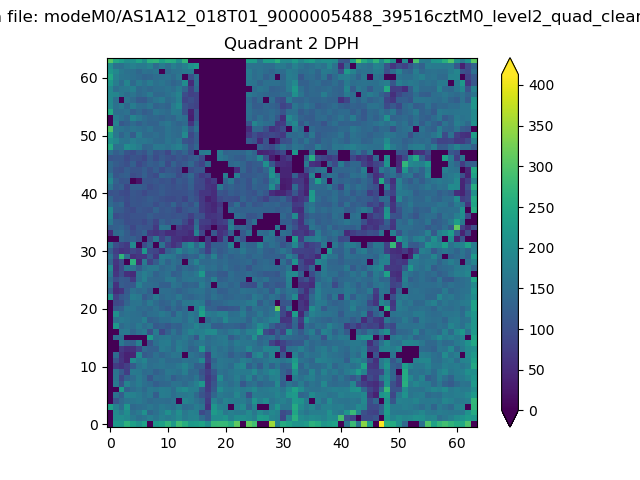 |
Quadrant C |
| Plot type | Count rate plots | Images |
|---|---|---|
| Comparison with Poisson distribution Blue bars denote a histogram of data divided into 1 sec bins. Red curve is a Poisson curve with rate = median count rate of data. |
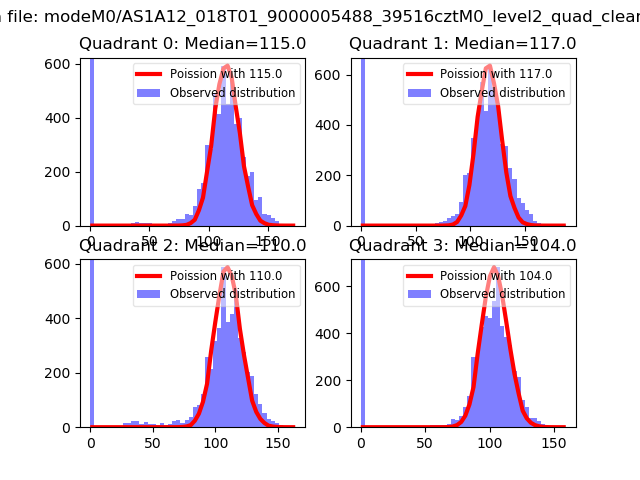 |
 |
| Quadrant-wise count rates Data is divided into 100 sec bins |
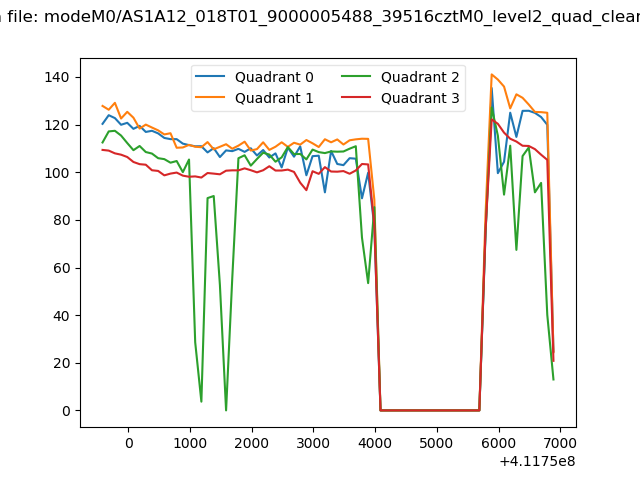 |
|
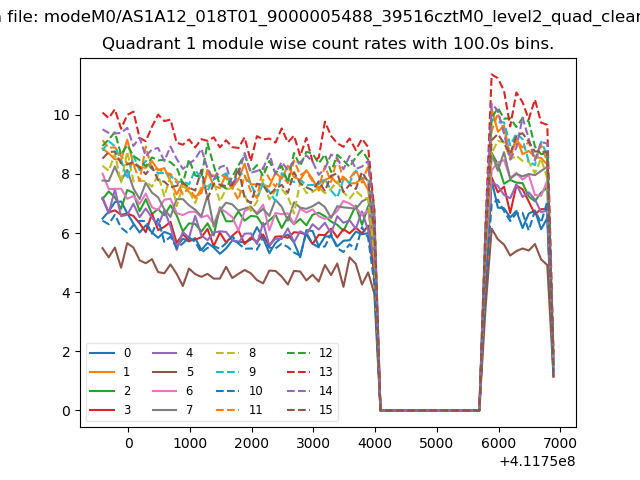
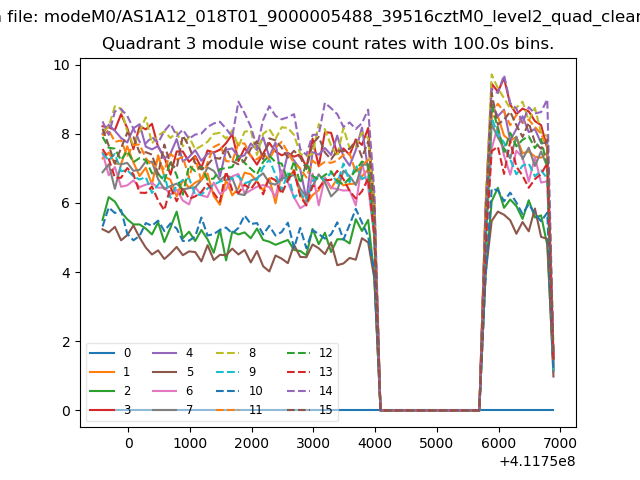
| Module-wise count rates for Quadrant A Data is divided into 100 sec bins |
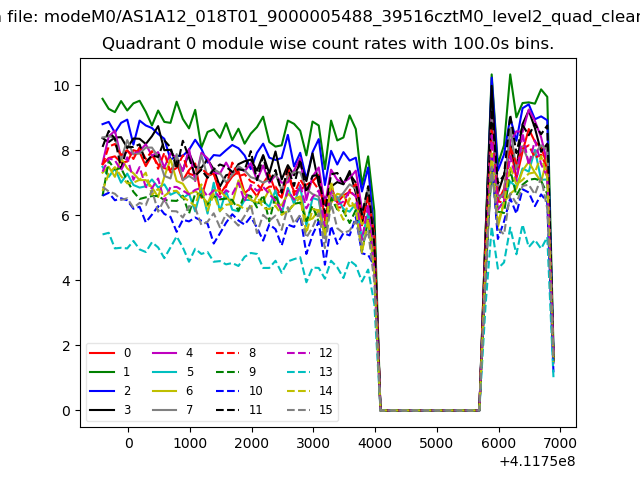 |
 |
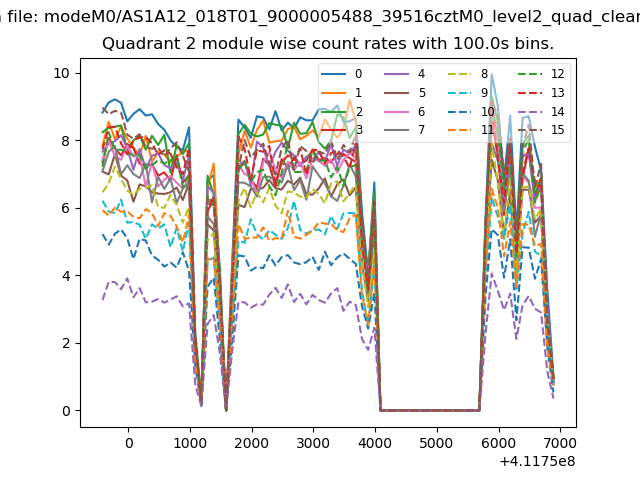
| Module-wise count rates for Quadrant B Data is divided into 100 sec bins |
 |
 |
| Module-wise count rates for Quadrant C Data is divided into 100 sec bins |
 |
 |
| Module-wise count rates for Quadrant D Data is divided into 100 sec bins |
 |
 |
| Parameter | Plot |
|---|---|
| CZT HV Monitor | 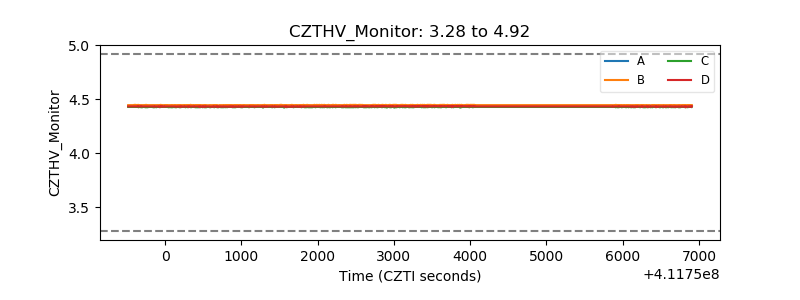 |
| D_VDD | 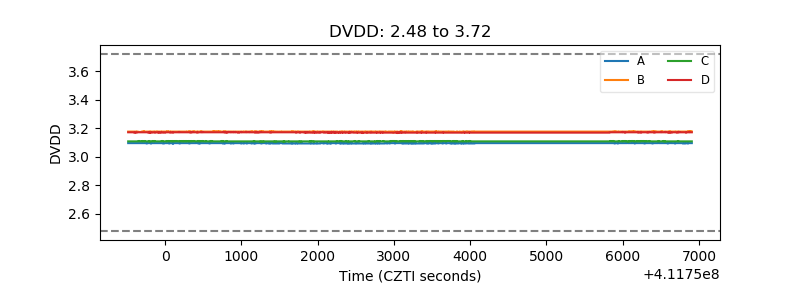 |
| Temperature 1 | 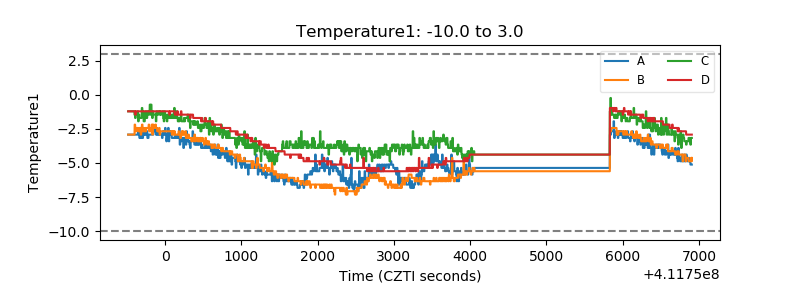 |
| Veto HV Monitor | 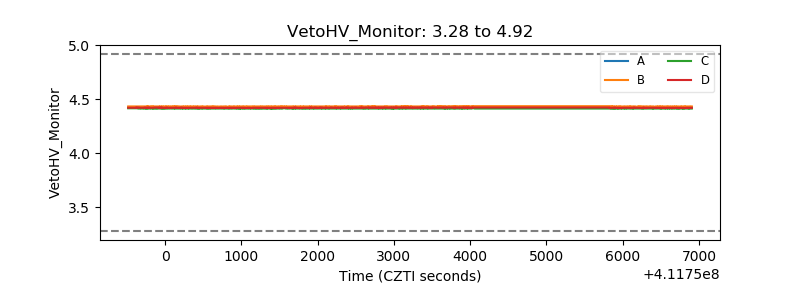 |
| Veto LLD | 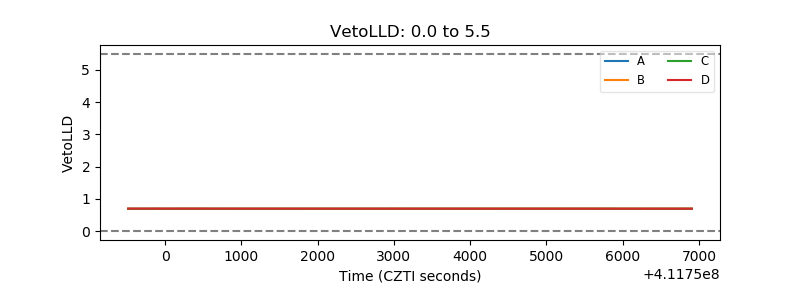 |
| Alpha Counter | 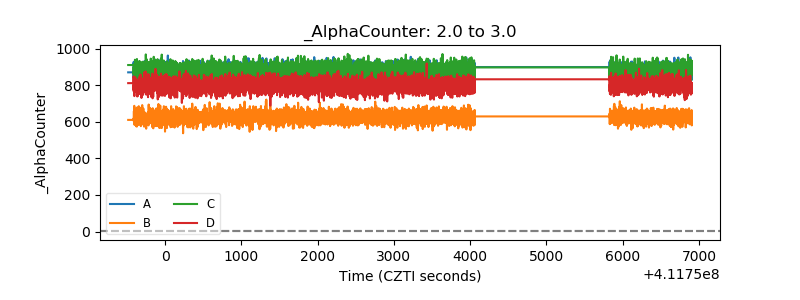 |
| _CPM_Rate | 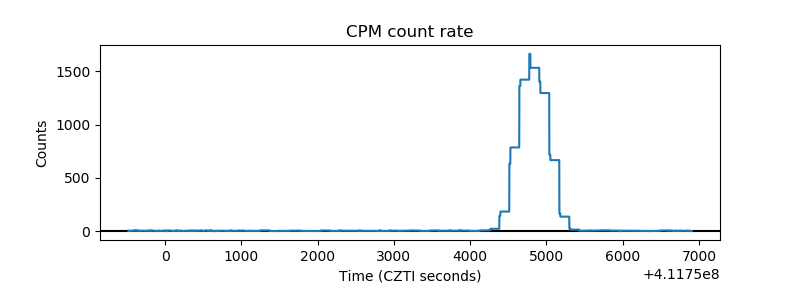 |
| CZT Counter | 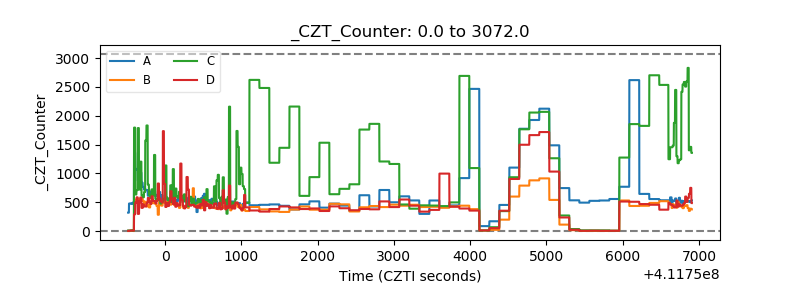 |
| +2.5 Volts monitor | 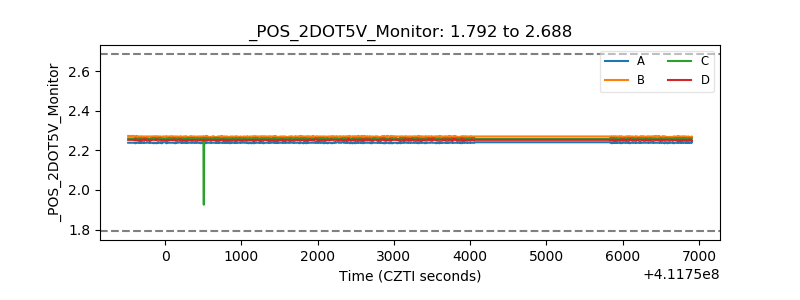 |
| +5 Volts monitor | 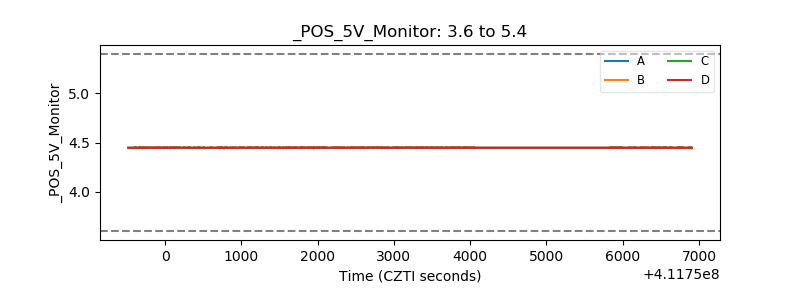 |
| _ROLL_ROT | 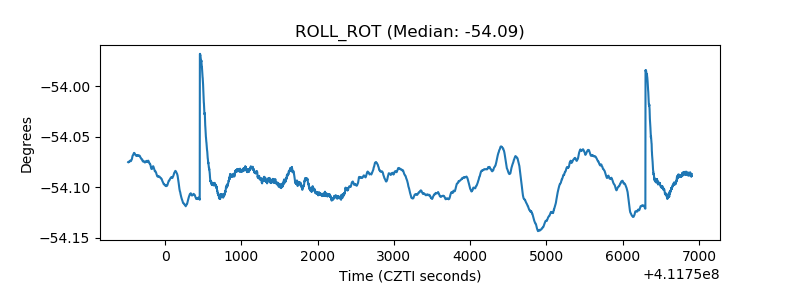 |
| _Roll_DEC | 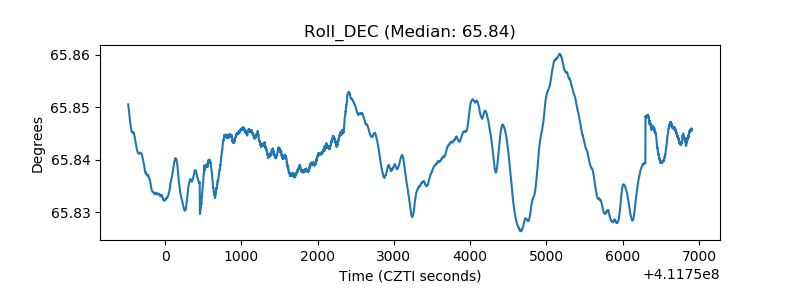 |
| _Roll_RA | 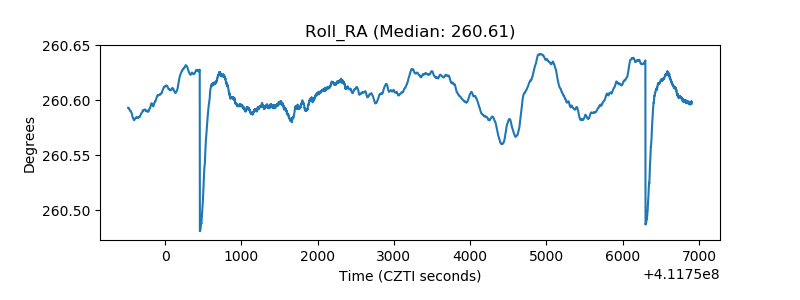 |
| Veto Counter | 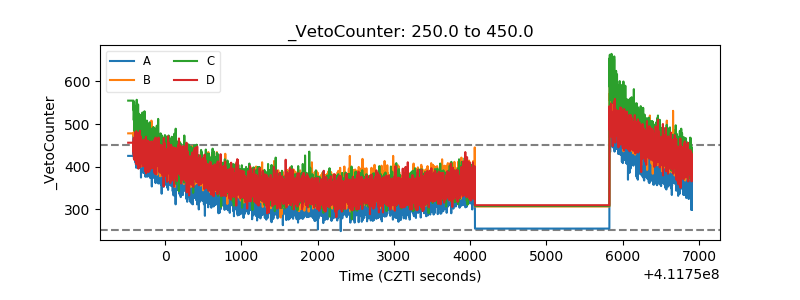 |