| Param | Original file | Final file |
|---|---|---|
| Filename | modeM0/AS1A12_018T01_9000005488_39517cztM0_level2.fits | modeM0/AS1A12_018T01_9000005488_39517cztM0_level2_quad_clean.evt |
| Size (bytes) | 416,554,560 | 90,426,240 |
| Size | 397.3 MB | 86.2 MB |
| Events in quadrant A | 3,484,522 | 609,671 |
| Events in quadrant B | 2,357,505 | 651,251 |
| Events in quadrant C | 6,574,337 | 533,396 |
| Events in quadrant D | 2,593,793 | 575,507 |
| Mode SS | |||
|---|---|---|---|
| Quadrant | BADHDUFLAG | Total packets | Discarded packets |
| A | 0 | 106 | 0 |
| B | 0 | 106 | 0 |
| C | 0 | 106 | 0 |
| D | 0 | 106 | 0 |
| Mode M0 | |||
|---|---|---|---|
| Quadrant | BADHDUFLAG | Total packets | Discarded packets |
| A | 0 | 13756 | 3 |
| B | 0 | 10663 | 2 |
| C | 0 | 23140 | 2 |
| D | 0 | 11403 | 2 |
| Mode M9 | |||
|---|---|---|---|
| Quadrant | BADHDUFLAG | Total packets | Discarded packets |
| A | 0 | 24 | 0 |
| B | 0 | 24 | 0 |
| C | 0 | 24 | 0 |
| D | 0 | 25 | 0 |
| Quadrant | Total seconds | Saturated seconds | Saturation percentage |
|---|---|---|---|
| A | 5263 | 240 | 4.560137% |
| B | 5263 | 13 | 0.247007% |
| C | 5263 | 1009 | 19.171575% |
| D | 5263 | 42 | 0.798024% |
Noise dominated data is calculated using 1-second bins in cleaned event files. If a bin has >2000 counts, and if more than 50% of those come from <1% of pixels, then it is considered to be noise-dominated and hence unusable.
| Quadrant | # 1 sec bins | Bins with >0 counts | Bins with >2000 counts | High rate bins dominated by noise | Noise dominated (total time) | Noise dominated (detector-on time) | Marked lightcurve |
|---|---|---|---|---|---|---|---|
| A | 7147 | 5264 | 187 | 187 | 2.62% | 3.55% | 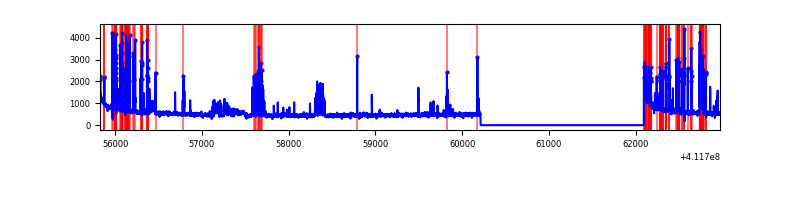 |
| B | 7147 | 5264 | 5 | 5 | 0.07% | 0.09% | 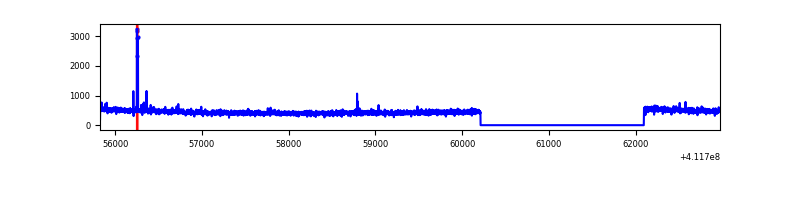 |
| C | 7147 | 5264 | 949 | 949 | 13.28% | 18.03% | 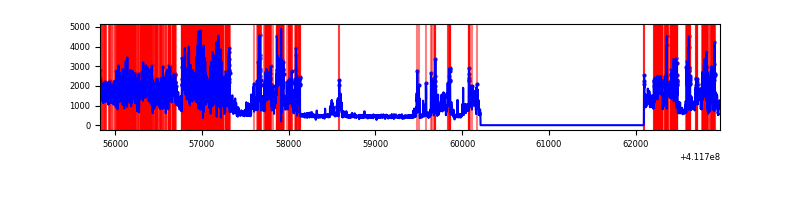 |
| D | 7147 | 5264 | 29 | 29 | 0.41% | 0.55% | 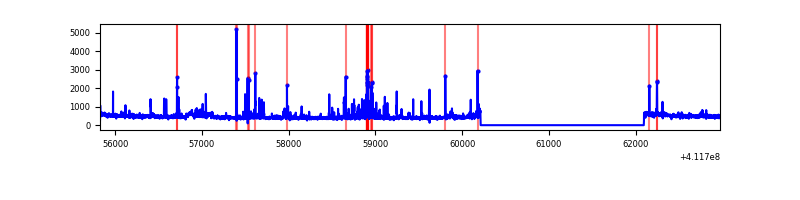 |
Top three noisy pixels from each quadrant. If the there are fewer than three noisy pixels in the level2.evt file, extra rows are filled as -1
| Pixel properties | Quadrant properties | ||||||
|---|---|---|---|---|---|---|---|
| Quadrant | DetID | PixID | Counts | Sigma | Mean | Median | Sigma |
| A | 6 | 10 | 732275 | 6194.46 | 583 | 570 | 118.1 |
| A | 10 | 83 | 426807 | 3608.43 | 583 | 570 | 118.1 |
| A | 13 | 248 | 46816 | 391.51 | 583 | 570 | 118.1 |
| B | 15 | 85 | 26444 | 227.79 | 593 | 575 | 113.6 |
| B | 12 | 111 | 13662 | 115.24 | 593 | 575 | 113.6 |
| B | 11 | 111 | 12532 | 105.29 | 593 | 575 | 113.6 |
| C | 9 | 187 | 4100605 | 32325.25 | 551 | 554 | 126.8 |
| C | 15 | 214 | 207415 | 1630.91 | 551 | 554 | 126.8 |
| C | 3 | 110 | 102995 | 807.66 | 551 | 554 | 126.8 |
| D | 13 | 249 | 147479 | 1040.55 | 583 | 567 | 141.2 |
| D | 2 | 249 | 69682 | 489.53 | 583 | 567 | 141.2 |
| D | 12 | 227 | 36056 | 251.36 | 583 | 567 | 141.2 |
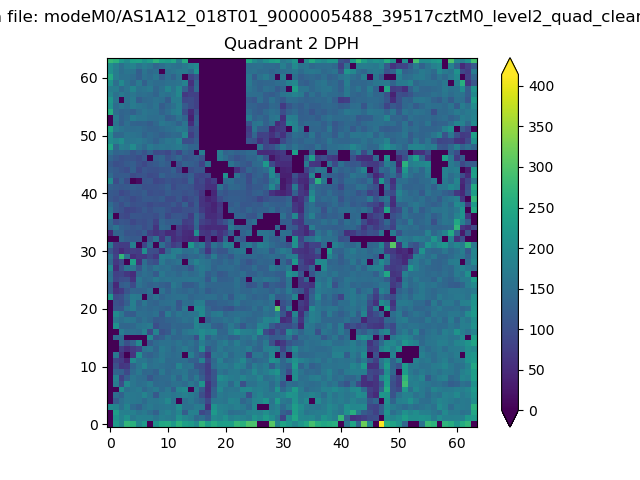
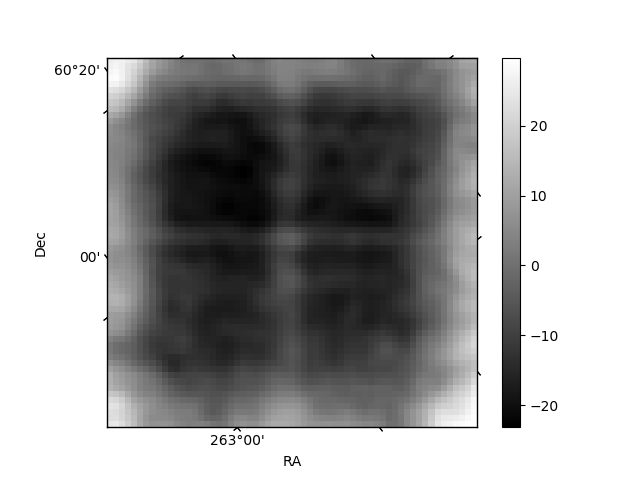
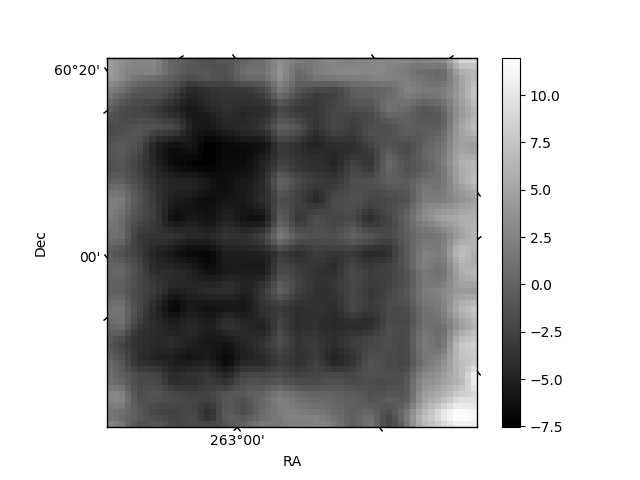
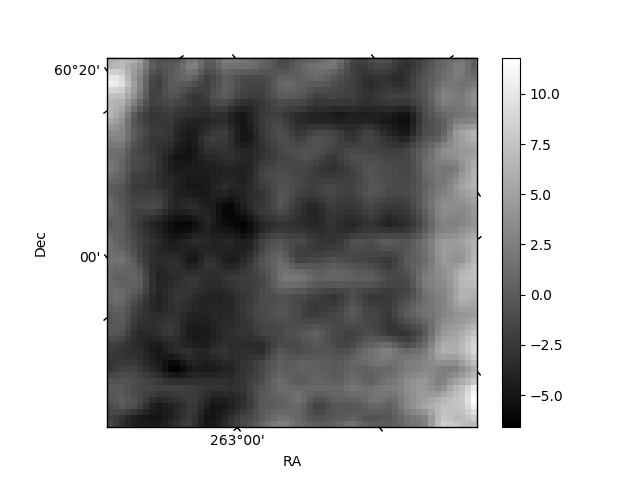
Histogram calculated using DETX and DETY for each event in the final _common_clean file
| Quadrant A | 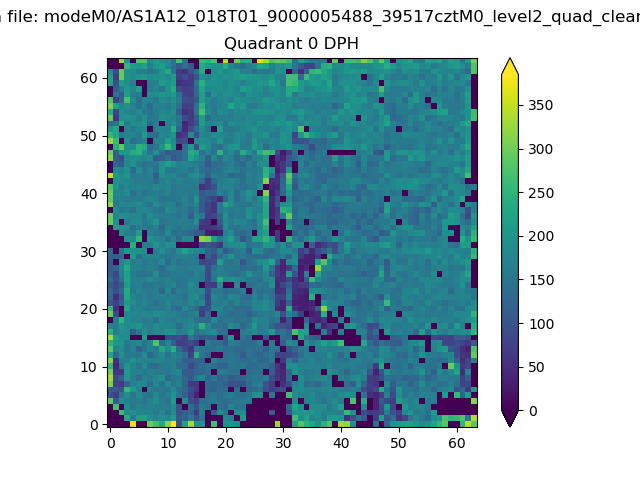 |
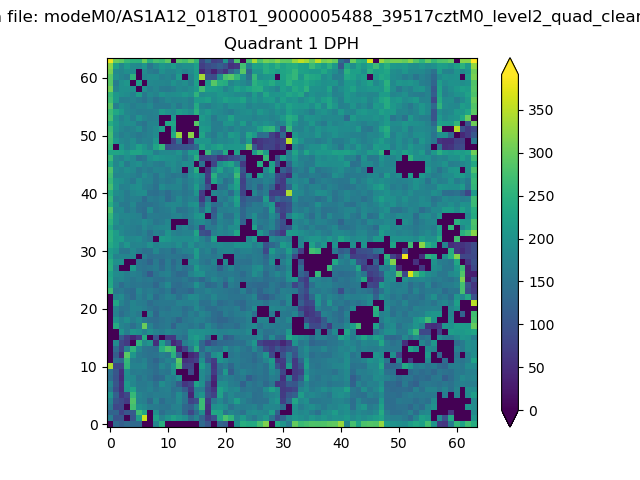 |
Quadrant B |
|---|---|---|---|
| Quadrant D | 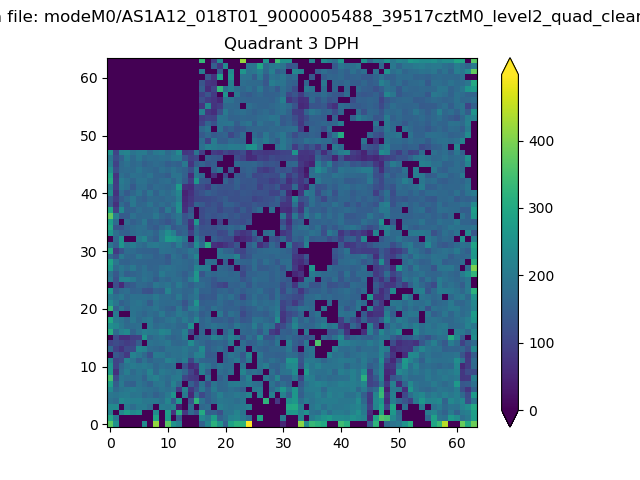 |
 |
Quadrant C |
| Plot type | Count rate plots | Images |
|---|---|---|
| Comparison with Poisson distribution Blue bars denote a histogram of data divided into 1 sec bins. Red curve is a Poisson curve with rate = median count rate of data. |
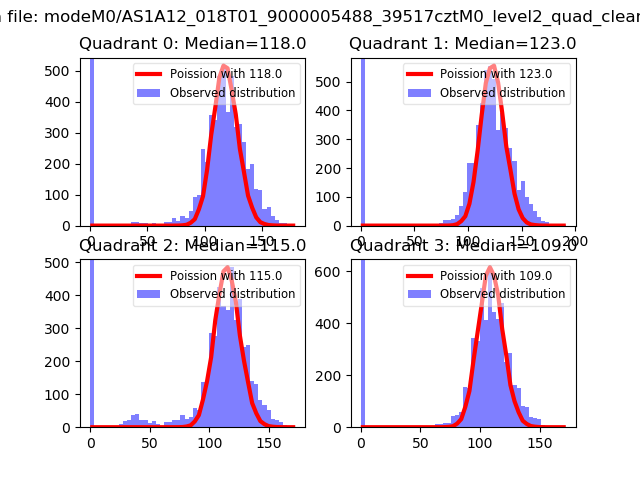 |
 |
| Quadrant-wise count rates Data is divided into 100 sec bins |
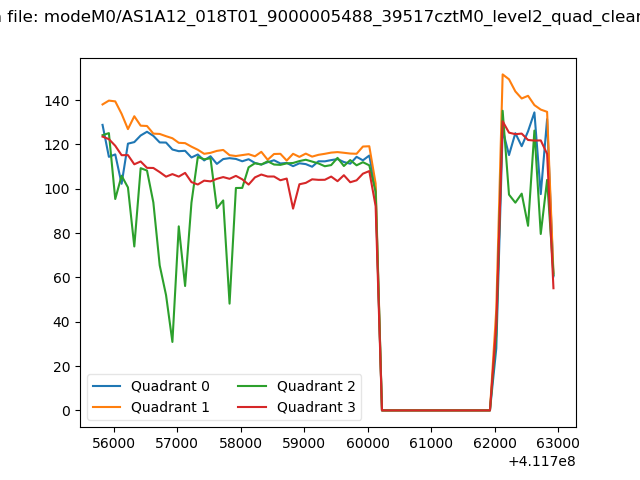 |
|
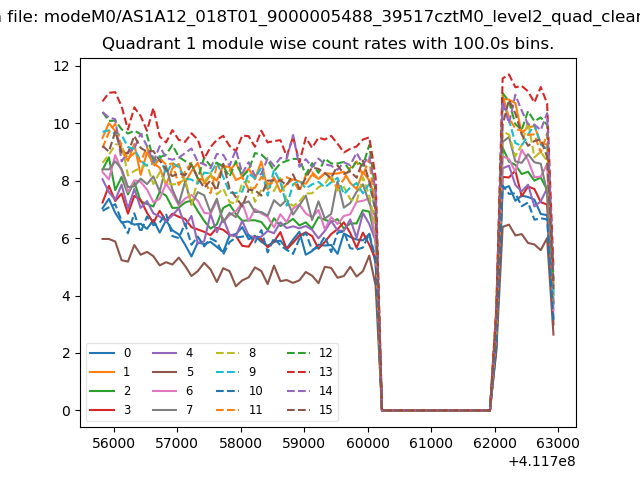
| Module-wise count rates for Quadrant A Data is divided into 100 sec bins |
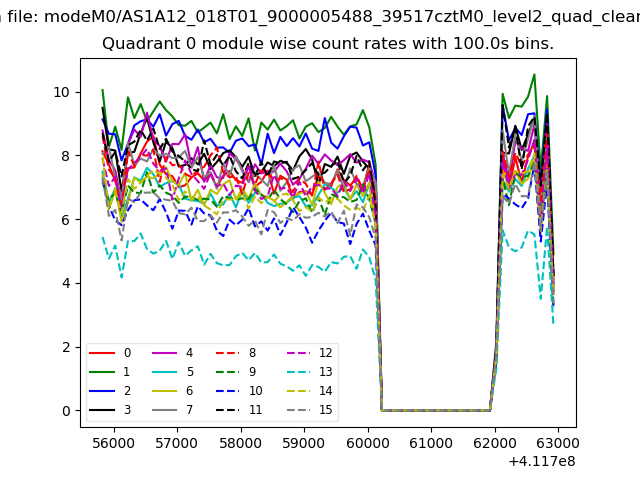 |
 |
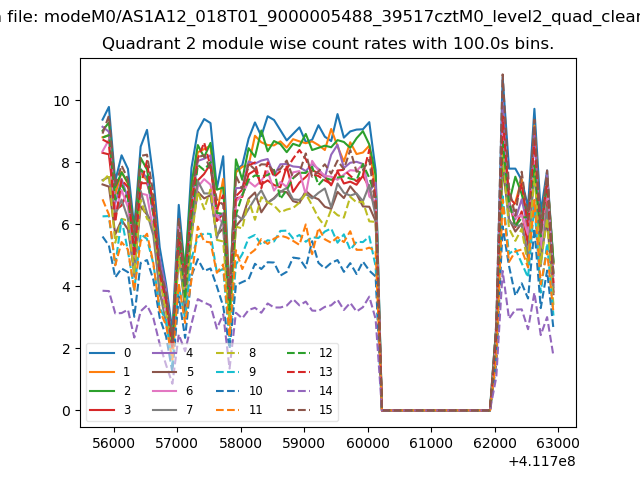
| Module-wise count rates for Quadrant B Data is divided into 100 sec bins |
 |
 |
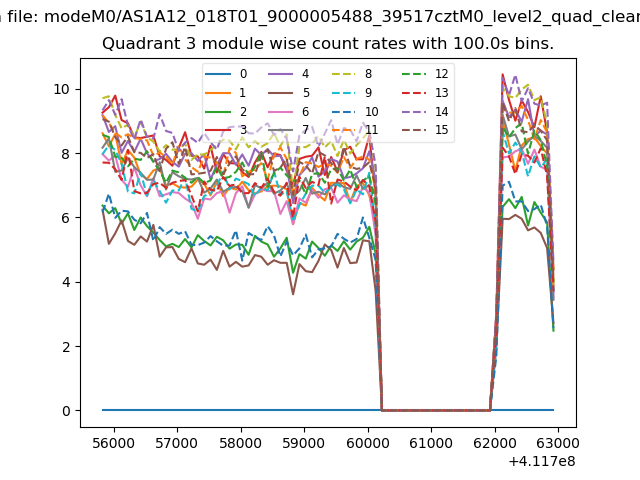
| Module-wise count rates for Quadrant C Data is divided into 100 sec bins |
 |
 |
| Module-wise count rates for Quadrant D Data is divided into 100 sec bins |
 |
 |
| Parameter | Plot |
|---|---|
| CZT HV Monitor | 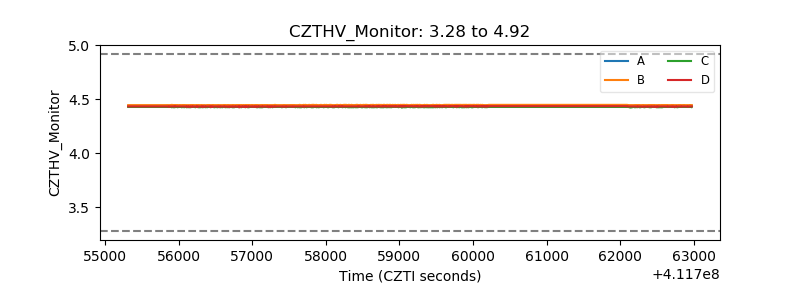 |
| D_VDD | 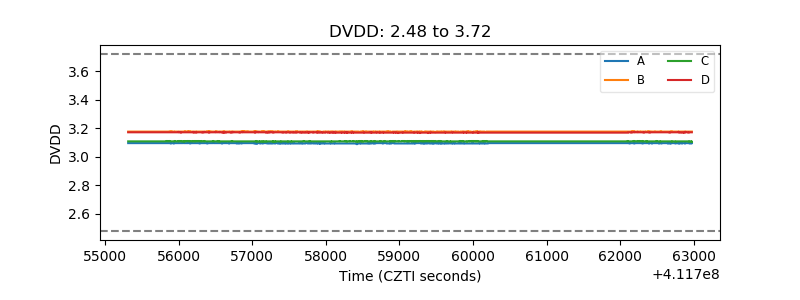 |
| Temperature 1 | 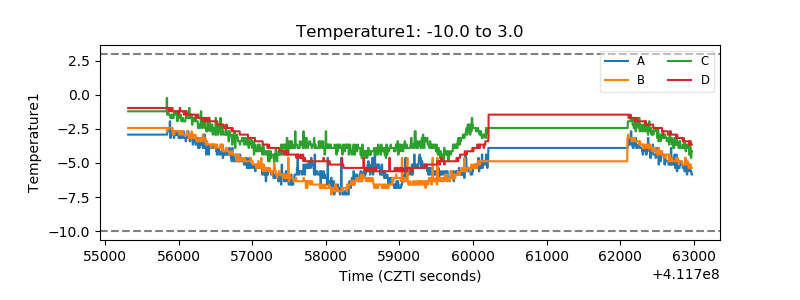 |
| Veto HV Monitor | 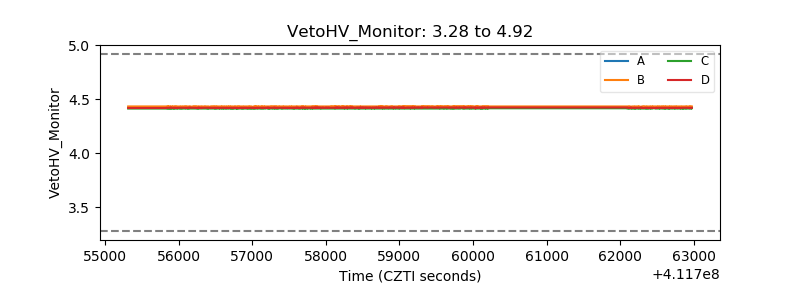 |
| Veto LLD | 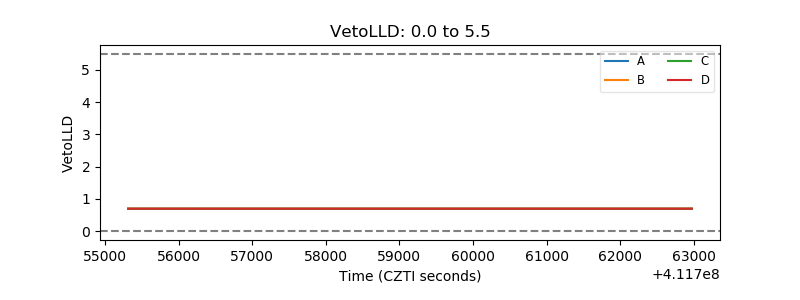 |
| Alpha Counter | 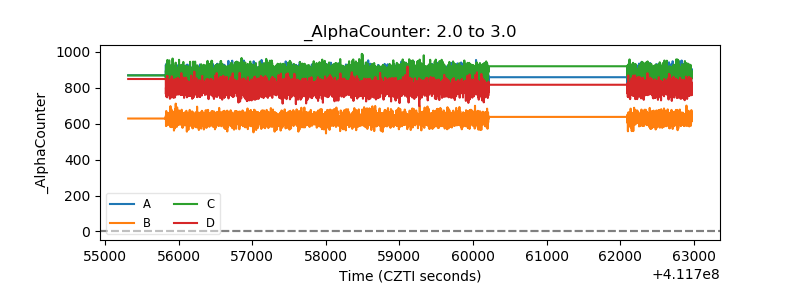 |
| _CPM_Rate | 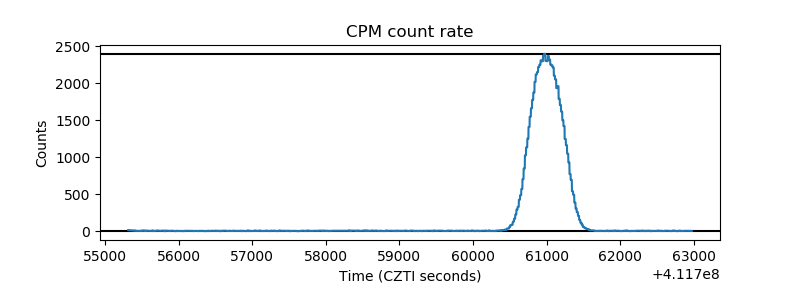 |
| CZT Counter | 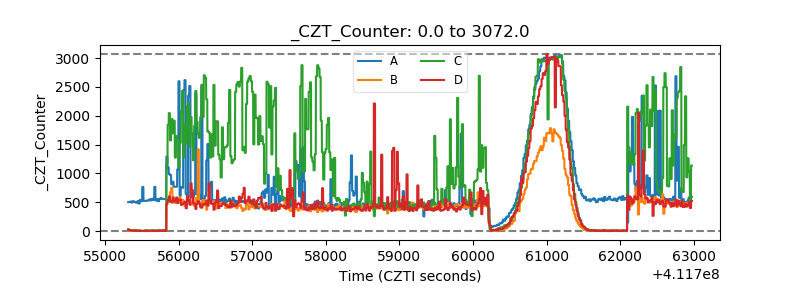 |
| +2.5 Volts monitor | 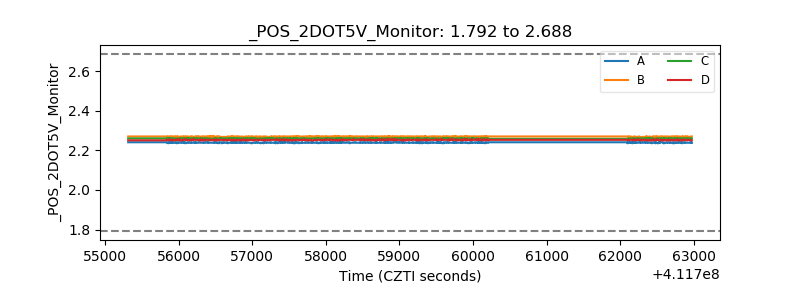 |
| +5 Volts monitor | 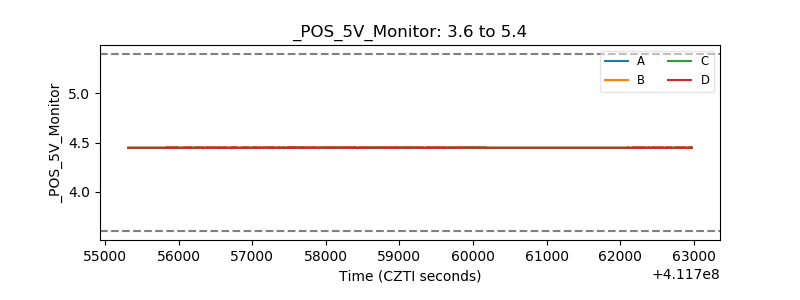 |
| _ROLL_ROT | 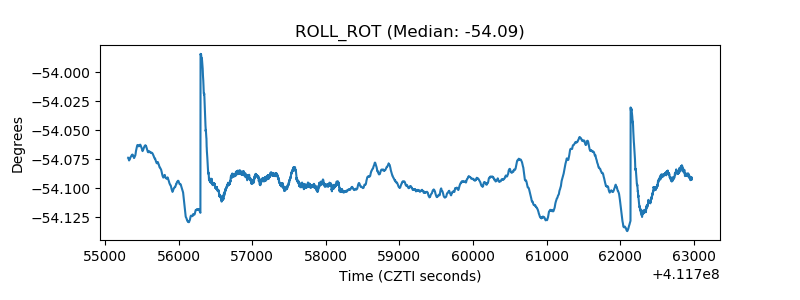 |
| _Roll_DEC | 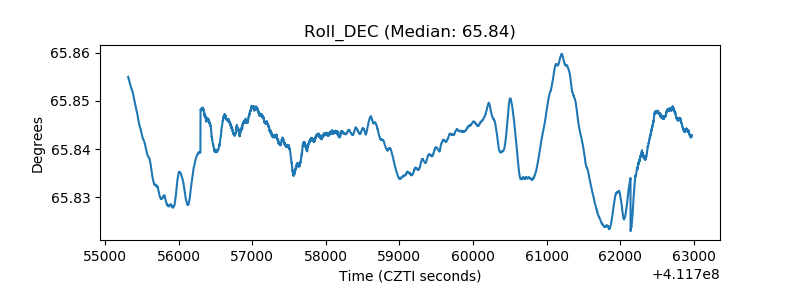 |
| _Roll_RA | 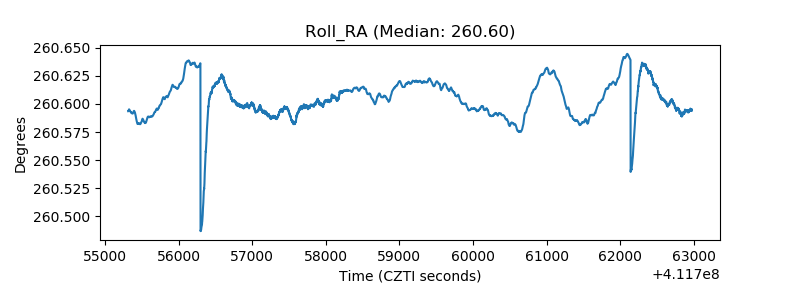 |
| Veto Counter | 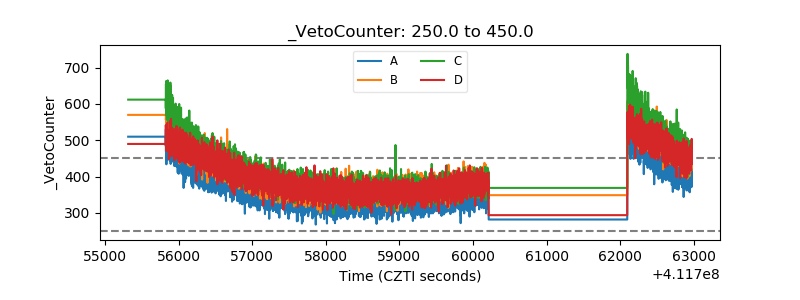 |