| Param | Original file | Final file |
|---|---|---|
| Filename | modeM0/AS1A12_018T01_9000005488_39518cztM0_level2.fits | modeM0/AS1A12_018T01_9000005488_39518cztM0_level2_quad_clean.evt |
| Size (bytes) | 350,040,960 | 89,979,840 |
| Size | 333.8 MB | 85.8 MB |
| Events in quadrant A | 3,098,678 | 605,851 |
| Events in quadrant B | 2,244,629 | 641,219 |
| Events in quadrant C | 4,800,434 | 561,217 |
| Events in quadrant D | 2,425,227 | 566,759 |
| Mode SS | |||
|---|---|---|---|
| Quadrant | BADHDUFLAG | Total packets | Discarded packets |
| A | 0 | 102 | 0 |
| B | 0 | 102 | 0 |
| C | 0 | 102 | 0 |
| D | 0 | 102 | 0 |
| Mode M0 | |||
|---|---|---|---|
| Quadrant | BADHDUFLAG | Total packets | Discarded packets |
| A | 0 | 12374 | 3 |
| B | 0 | 10024 | 2 |
| C | 0 | 17713 | 2 |
| D | 0 | 10759 | 2 |
| Mode M9 | |||
|---|---|---|---|
| Quadrant | BADHDUFLAG | Total packets | Discarded packets |
| A | 0 | 20 | 0 |
| B | 0 | 20 | 0 |
| C | 0 | 20 | 0 |
| D | 0 | 21 | 0 |
| Quadrant | Total seconds | Saturated seconds | Saturation percentage |
|---|---|---|---|
| A | 4983 | 159 | 3.190849% |
| B | 4983 | 5 | 0.100341% |
| C | 4983 | 556 | 11.157937% |
| D | 4983 | 22 | 0.441501% |
Noise dominated data is calculated using 1-second bins in cleaned event files. If a bin has >2000 counts, and if more than 50% of those come from <1% of pixels, then it is considered to be noise-dominated and hence unusable.
| Quadrant | # 1 sec bins | Bins with >0 counts | Bins with >2000 counts | High rate bins dominated by noise | Noise dominated (total time) | Noise dominated (detector-on time) | Marked lightcurve |
|---|---|---|---|---|---|---|---|
| A | 6986 | 4984 | 137 | 137 | 1.96% | 2.75% |  |
| B | 6986 | 4984 | 0 | 0 | 0.00% | 0.00% | 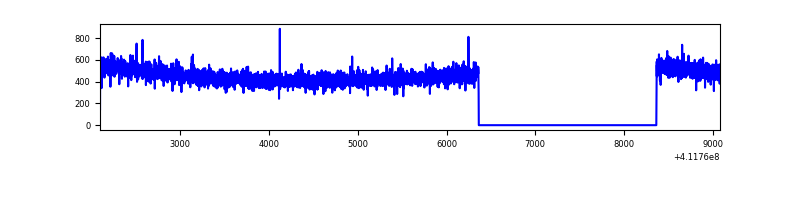 |
| C | 6986 | 4984 | 498 | 498 | 7.13% | 9.99% | 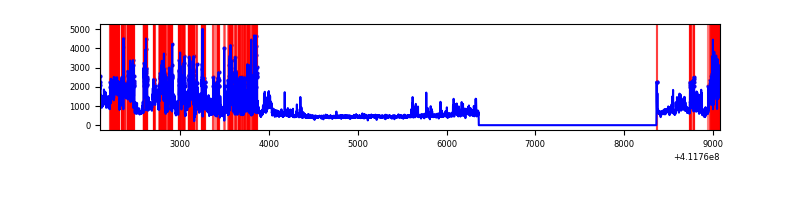 |
| D | 6986 | 4984 | 17 | 17 | 0.24% | 0.34% | 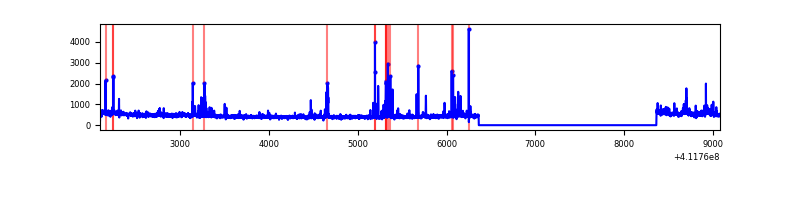 |
Top three noisy pixels from each quadrant. If the there are fewer than three noisy pixels in the level2.evt file, extra rows are filled as -1
| Pixel properties | Quadrant properties | ||||||
|---|---|---|---|---|---|---|---|
| Quadrant | DetID | PixID | Counts | Sigma | Mean | Median | Sigma |
| A | 6 | 10 | 479959 | 4186.64 | 565 | 555 | 114.5 |
| A | 10 | 83 | 413849 | 3609.3 | 565 | 555 | 114.5 |
| A | 13 | 248 | 11686 | 97.21 | 565 | 555 | 114.5 |
| B | 12 | 111 | 12931 | 114.81 | 570 | 556 | 107.8 |
| B | 11 | 111 | 11877 | 105.03 | 570 | 556 | 107.8 |
| B | 14 | 111 | 11382 | 100.44 | 570 | 556 | 107.8 |
| C | 9 | 187 | 2422314 | 19285.08 | 544 | 546 | 125.6 |
| C | 15 | 214 | 203340 | 1614.89 | 544 | 546 | 125.6 |
| C | 15 | 208 | 34954 | 274.0 | 544 | 546 | 125.6 |
| D | 13 | 249 | 123536 | 899.97 | 561 | 545 | 136.7 |
| D | 2 | 249 | 57076 | 413.66 | 561 | 545 | 136.7 |
| D | 12 | 227 | 42060 | 303.78 | 561 | 545 | 136.7 |
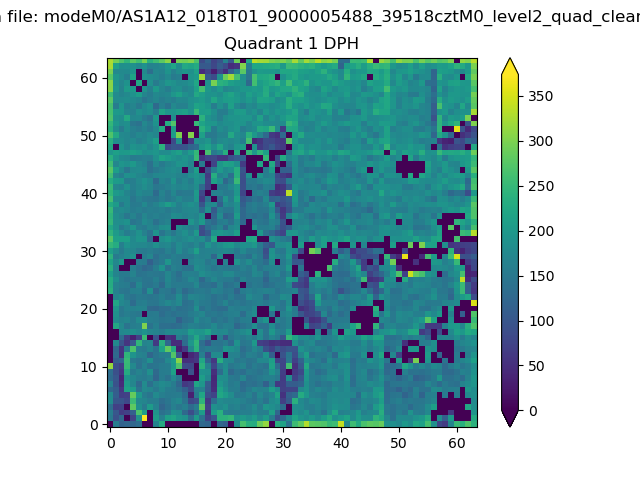
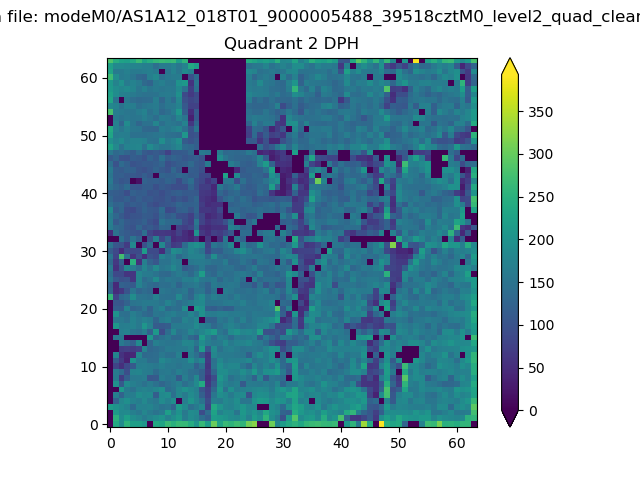
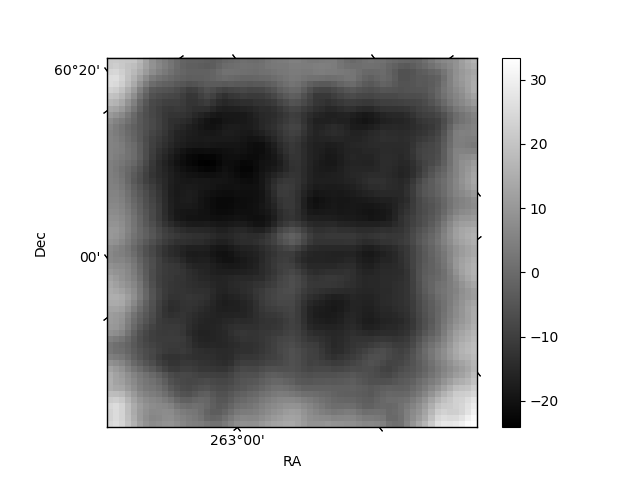
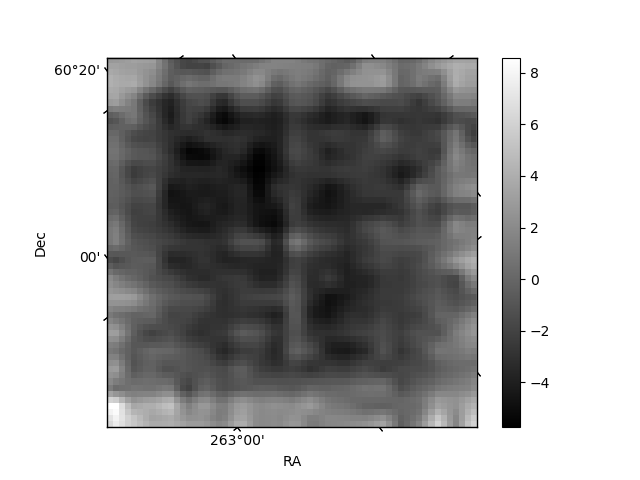
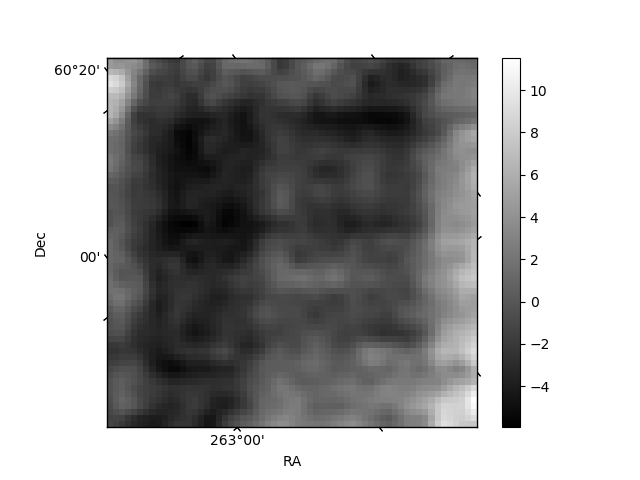
Histogram calculated using DETX and DETY for each event in the final _common_clean file
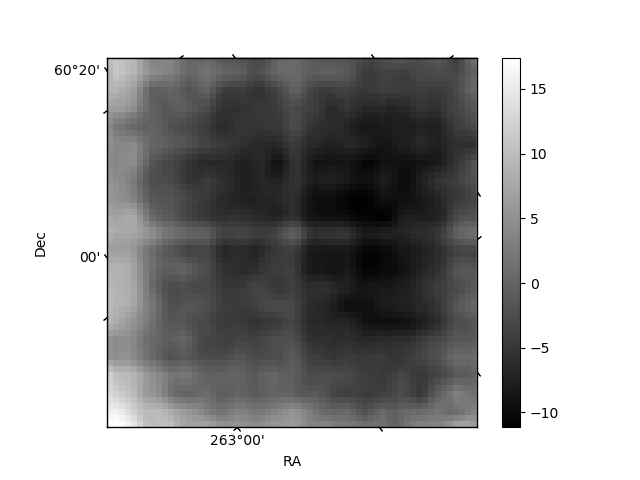
| Quadrant A | 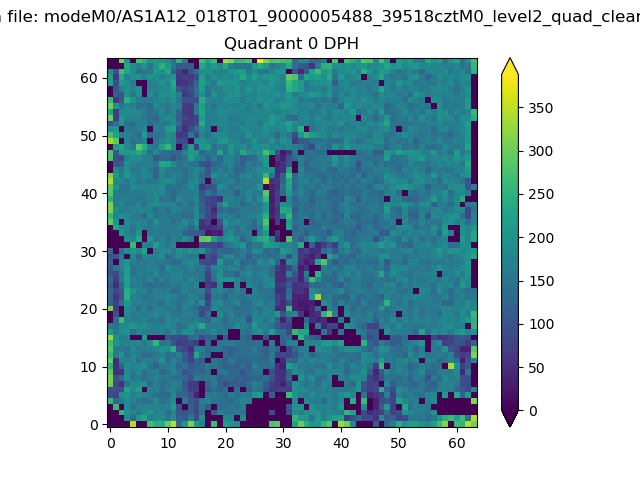 |
 |
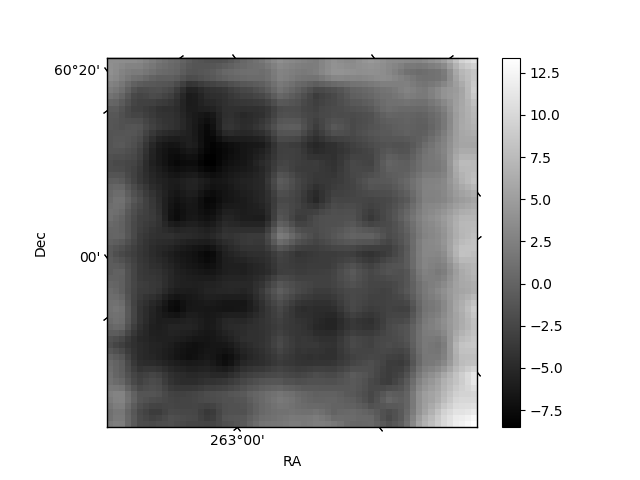
Quadrant B |
|---|---|---|---|
| Quadrant D | 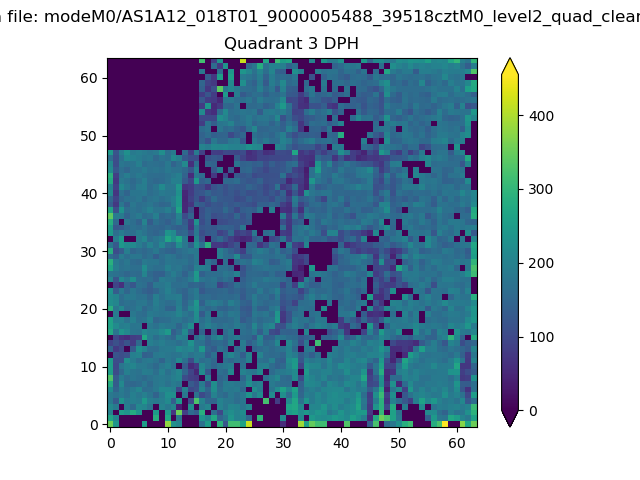 |
 |
Quadrant C |
| Plot type | Count rate plots | Images |
|---|---|---|
| Comparison with Poisson distribution Blue bars denote a histogram of data divided into 1 sec bins. Red curve is a Poisson curve with rate = median count rate of data. |
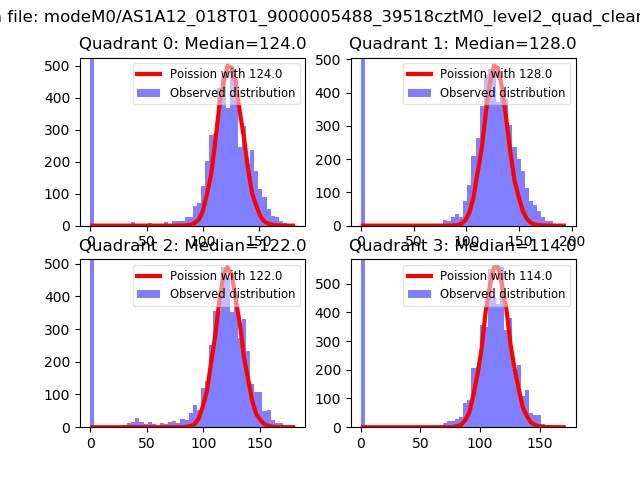 |
 |
| Quadrant-wise count rates Data is divided into 100 sec bins |
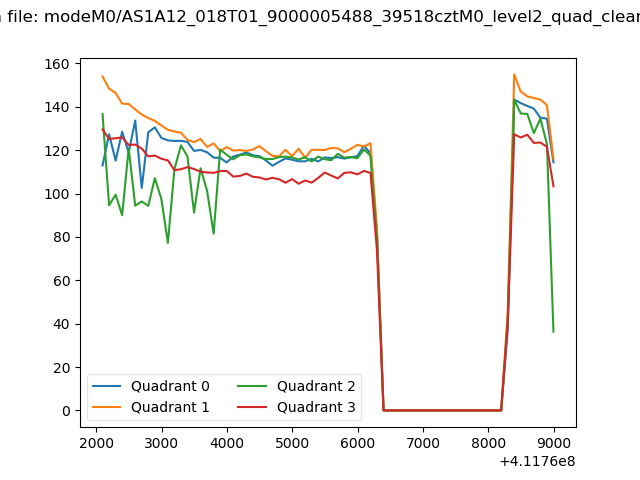 |
|
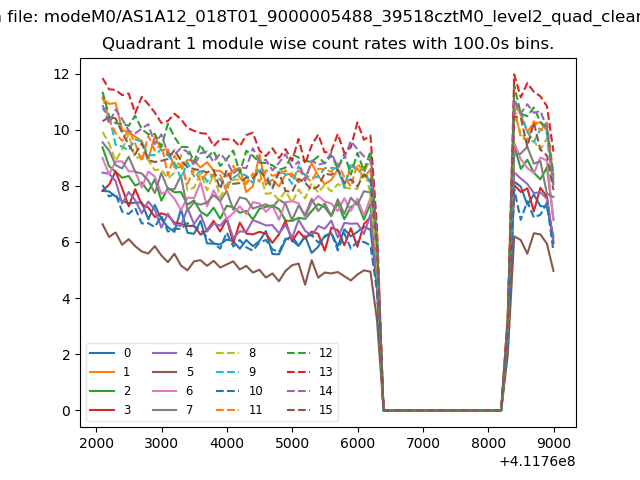
| Module-wise count rates for Quadrant A Data is divided into 100 sec bins |
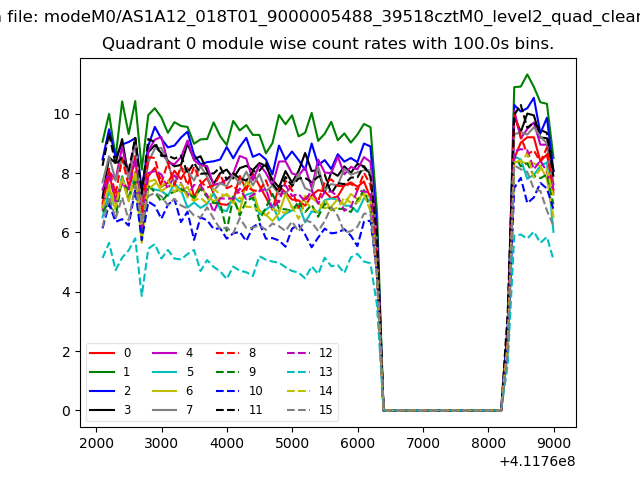 |
 |
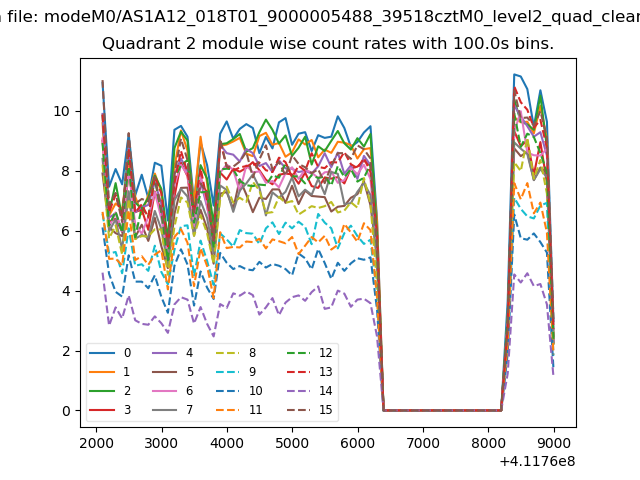
| Module-wise count rates for Quadrant B Data is divided into 100 sec bins |
 |
 |
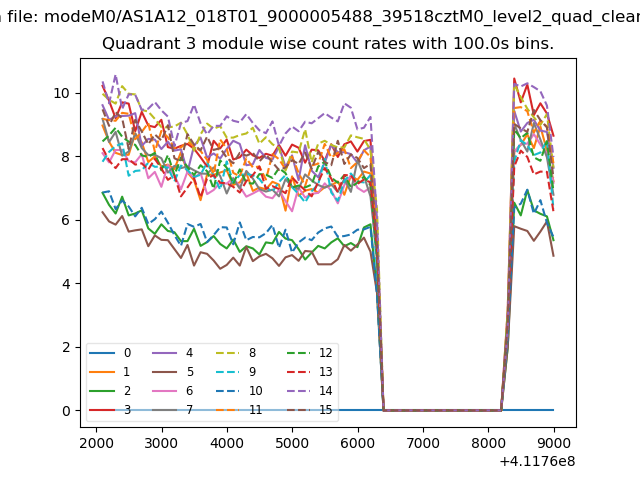
| Module-wise count rates for Quadrant C Data is divided into 100 sec bins |
 |
 |
| Module-wise count rates for Quadrant D Data is divided into 100 sec bins |
 |
 |
| Parameter | Plot |
|---|---|
| CZT HV Monitor | 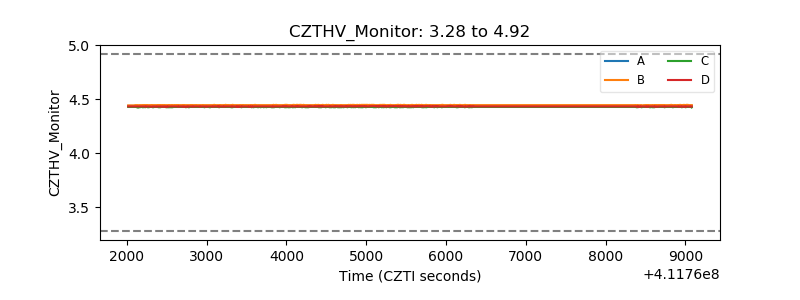 |
| D_VDD | 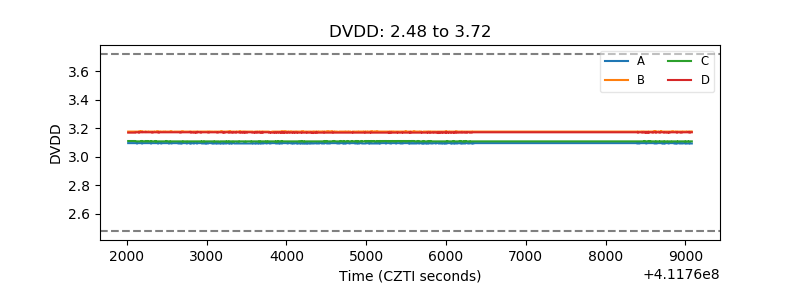 |
| Temperature 1 | 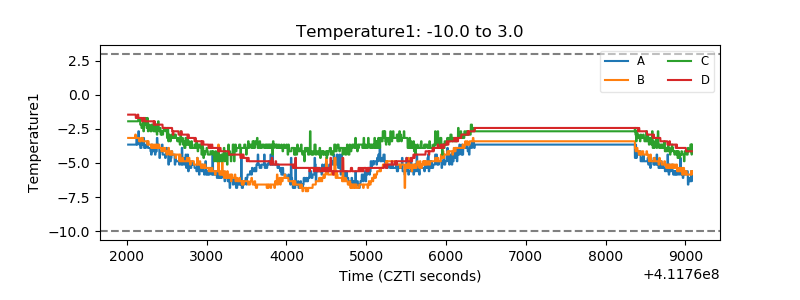 |
| Veto HV Monitor | 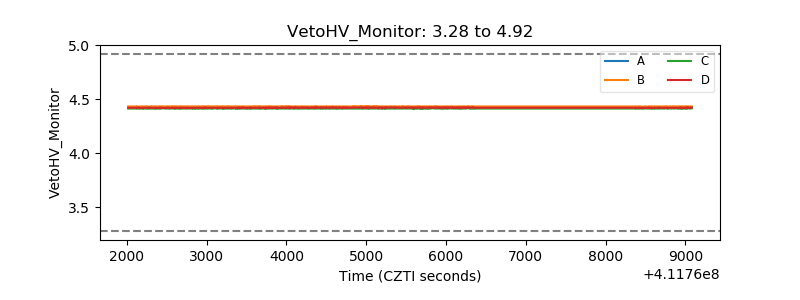 |
| Veto LLD | 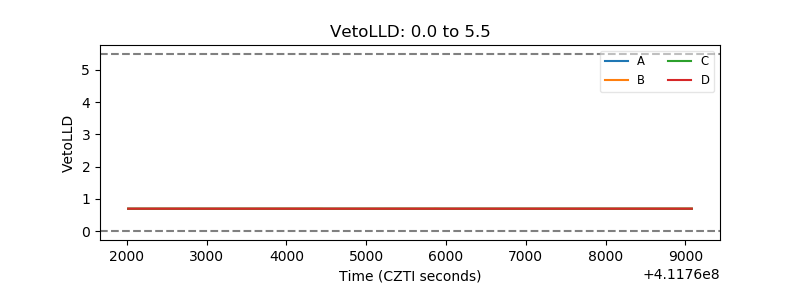 |
| Alpha Counter | 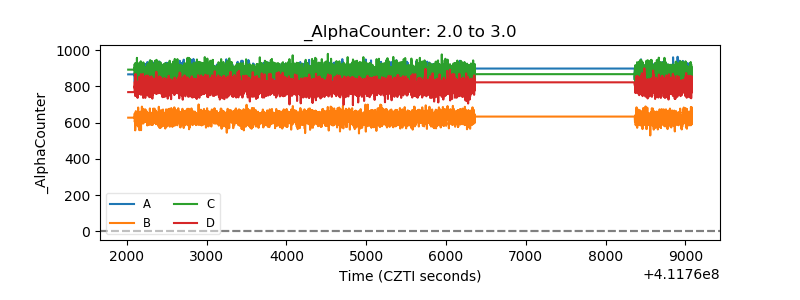 |
| _CPM_Rate | 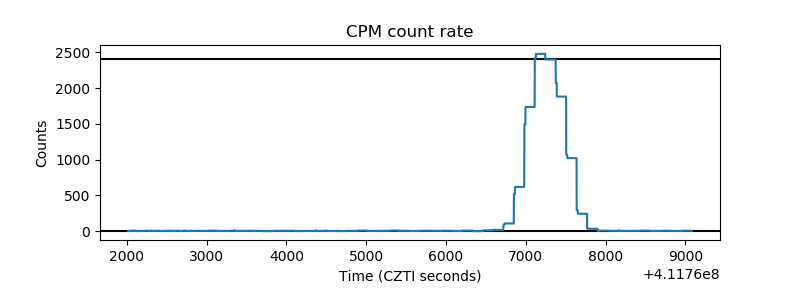 |
| CZT Counter | 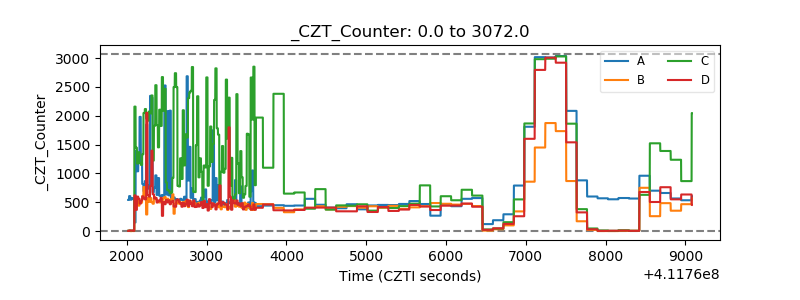 |
| +2.5 Volts monitor | 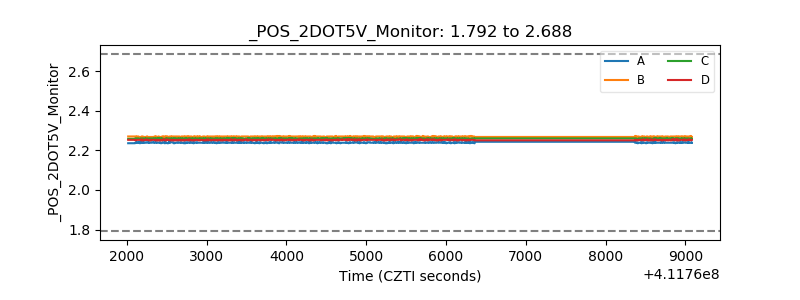 |
| +5 Volts monitor | 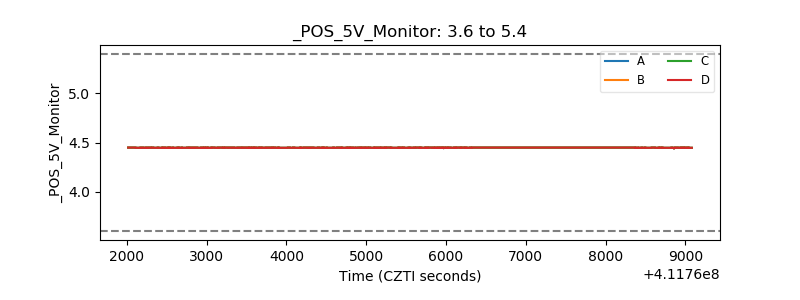 |
| _ROLL_ROT | 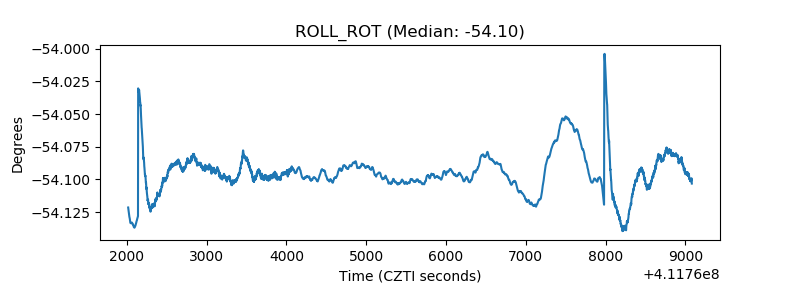 |
| _Roll_DEC | 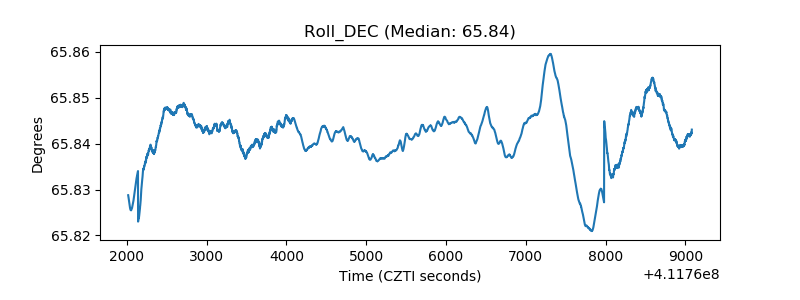 |
| _Roll_RA | 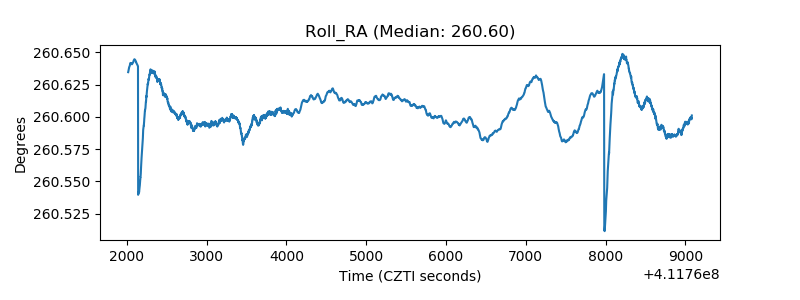 |
| Veto Counter | 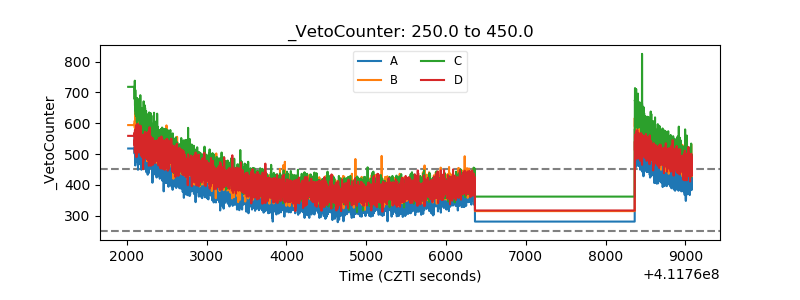 |