| Param | Original file | Final file |
|---|---|---|
| Filename | modeM0/AS1A12_018T01_9000005488_39519cztM0_level2.fits | modeM0/AS1A12_018T01_9000005488_39519cztM0_level2_quad_clean.evt |
| Size (bytes) | 334,517,760 | 89,400,960 |
| Size | 319.0 MB | 85.3 MB |
| Events in quadrant A | 2,585,938 | 605,589 |
| Events in quadrant B | 2,213,587 | 631,329 |
| Events in quadrant C | 3,724,297 | 584,776 |
| Events in quadrant D | 3,477,781 | 542,354 |
| Mode SS | |||
|---|---|---|---|
| Quadrant | BADHDUFLAG | Total packets | Discarded packets |
| A | 0 | 100 | 0 |
| B | 0 | 100 | 0 |
| C | 0 | 100 | 0 |
| D | 0 | 100 | 0 |
| Mode M0 | |||
|---|---|---|---|
| Quadrant | BADHDUFLAG | Total packets | Discarded packets |
| A | 0 | 10788 | 3 |
| B | 0 | 9880 | 2 |
| C | 0 | 14387 | 2 |
| D | 0 | 13627 | 2 |
| Mode M9 | |||
|---|---|---|---|
| Quadrant | BADHDUFLAG | Total packets | Discarded packets |
| A | 0 | 35 | 0 |
| B | 0 | 35 | 0 |
| C | 0 | 35 | 0 |
| D | 0 | 36 | 0 |
| Quadrant | Total seconds | Saturated seconds | Saturation percentage |
|---|---|---|---|
| A | 4892 | 16 | 0.327065% |
| B | 4892 | 6 | 0.122649% |
| C | 4892 | 237 | 4.844644% |
| D | 4892 | 164 | 3.352412% |
Noise dominated data is calculated using 1-second bins in cleaned event files. If a bin has >2000 counts, and if more than 50% of those come from <1% of pixels, then it is considered to be noise-dominated and hence unusable.
| Quadrant | # 1 sec bins | Bins with >0 counts | Bins with >2000 counts | High rate bins dominated by noise | Noise dominated (total time) | Noise dominated (detector-on time) | Marked lightcurve |
|---|---|---|---|---|---|---|---|
| A | 6985 | 4893 | 6 | 6 | 0.09% | 0.12% | 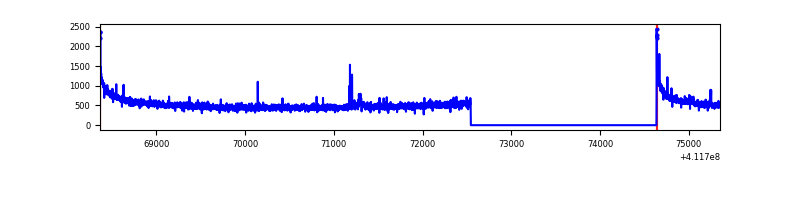 |
| B | 6985 | 4893 | 0 | 0 | 0.00% | 0.00% | 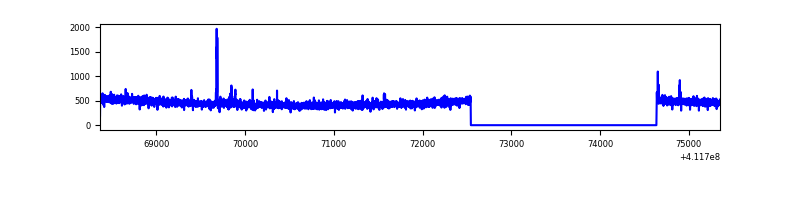 |
| C | 6985 | 4893 | 202 | 202 | 2.89% | 4.13% | 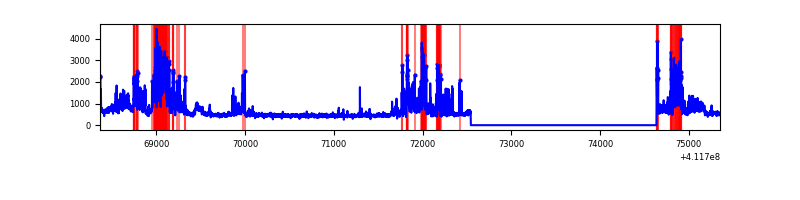 |
| D | 6985 | 4893 | 192 | 192 | 2.75% | 3.92% | 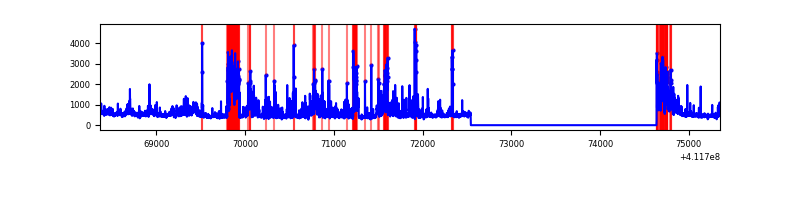 |
Top three noisy pixels from each quadrant. If the there are fewer than three noisy pixels in the level2.evt file, extra rows are filled as -1
| Pixel properties | Quadrant properties | ||||||
|---|---|---|---|---|---|---|---|
| Quadrant | DetID | PixID | Counts | Sigma | Mean | Median | Sigma |
| A | 10 | 83 | 407439 | 3637.41 | 552 | 542 | 111.9 |
| A | 15 | 174 | 21776 | 189.82 | 552 | 542 | 111.9 |
| A | 13 | 248 | 8960 | 75.25 | 552 | 542 | 111.9 |
| B | 5 | 255 | 31929 | 298.06 | 556 | 543 | 105.3 |
| B | 12 | 111 | 12891 | 117.27 | 556 | 543 | 105.3 |
| B | 11 | 111 | 11678 | 105.75 | 556 | 543 | 105.3 |
| C | 9 | 187 | 1361010 | 10880.24 | 542 | 547 | 125.0 |
| C | 15 | 214 | 203758 | 1625.17 | 542 | 547 | 125.0 |
| C | 4 | 111 | 12040 | 91.91 | 542 | 547 | 125.0 |
| D | 12 | 227 | 1047496 | 7966.82 | 539 | 525 | 131.4 |
| D | 13 | 249 | 239428 | 1817.91 | 539 | 525 | 131.4 |
| D | 2 | 249 | 104401 | 790.43 | 539 | 525 | 131.4 |
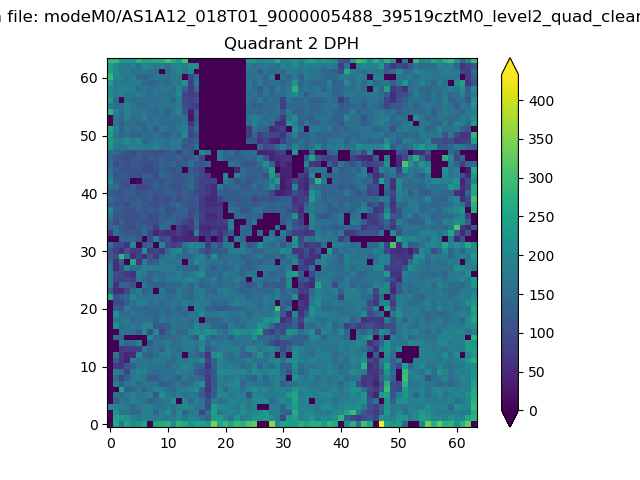
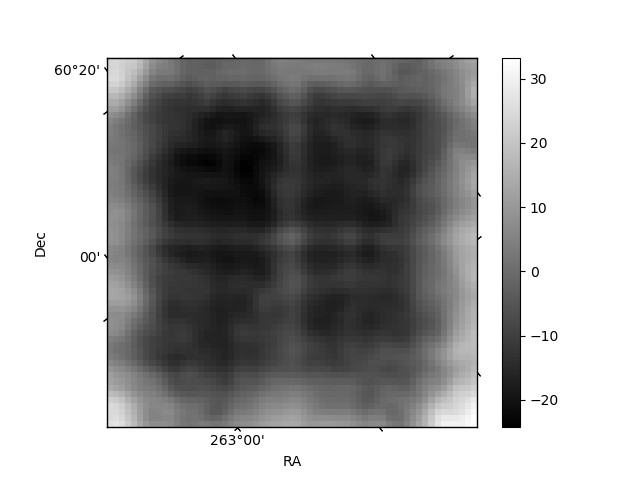
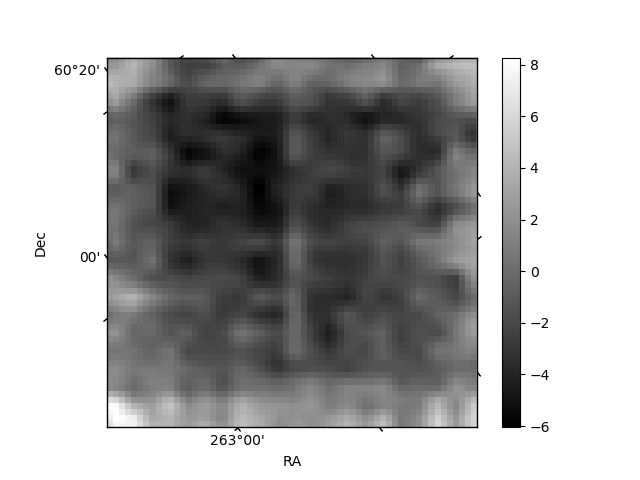
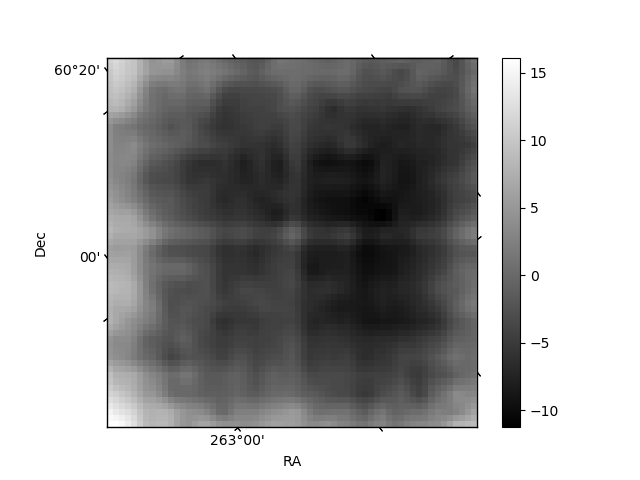
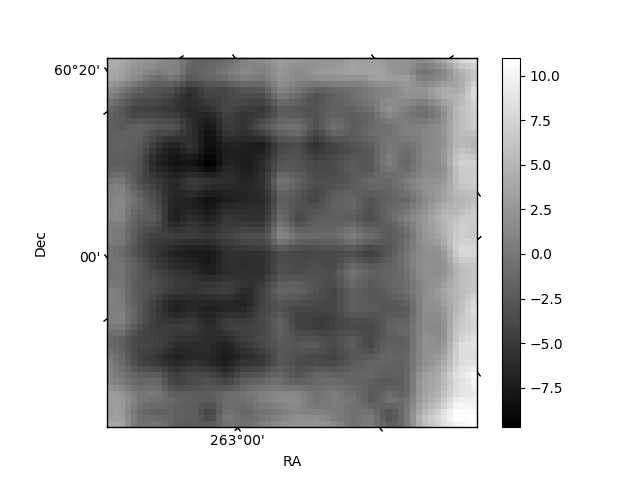
Histogram calculated using DETX and DETY for each event in the final _common_clean file
| Quadrant A | 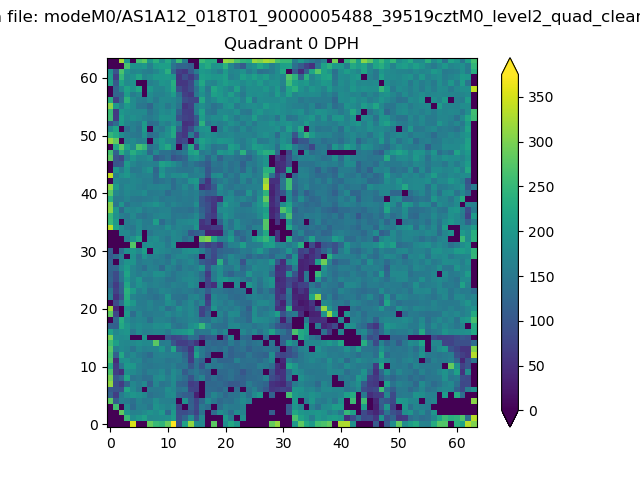 |
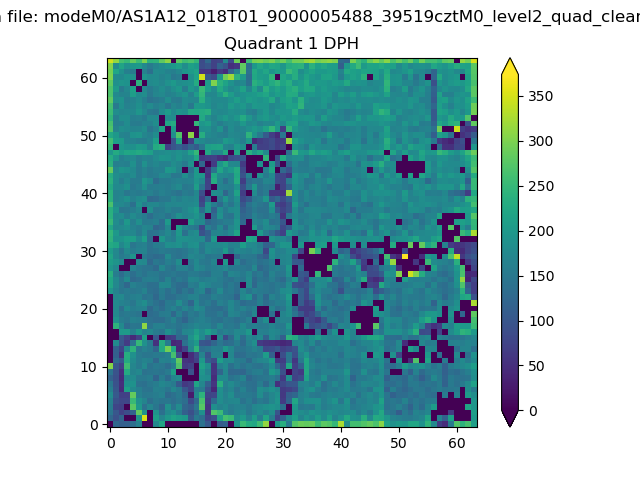 |
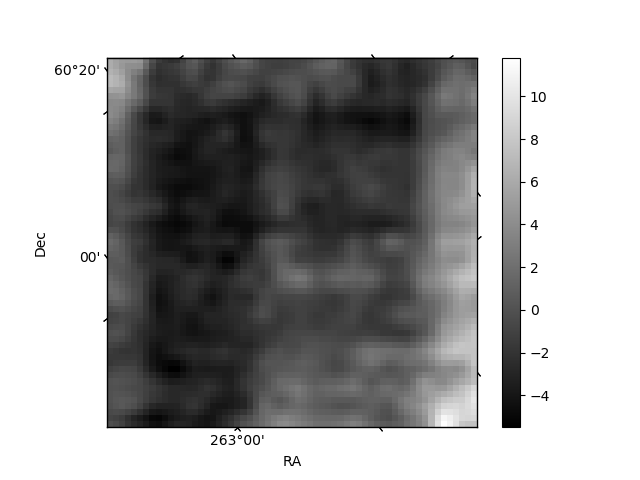
Quadrant B |
|---|---|---|---|
| Quadrant D | 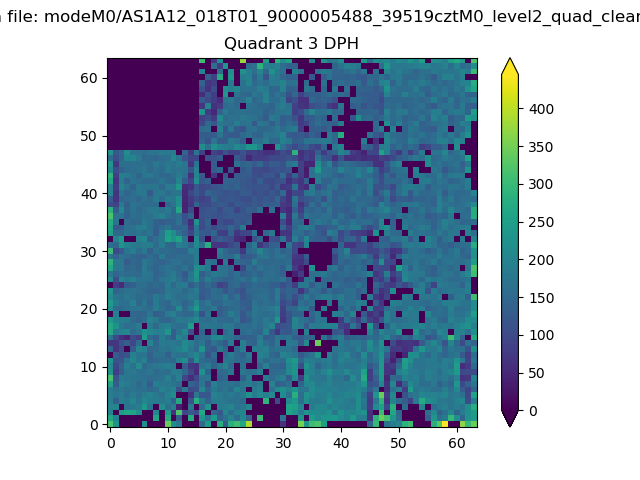 |
 |
Quadrant C |
| Plot type | Count rate plots | Images |
|---|---|---|
| Comparison with Poisson distribution Blue bars denote a histogram of data divided into 1 sec bins. Red curve is a Poisson curve with rate = median count rate of data. |
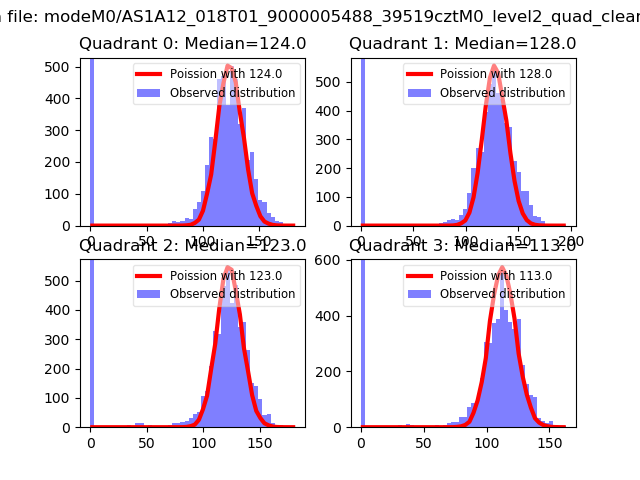 |
 |
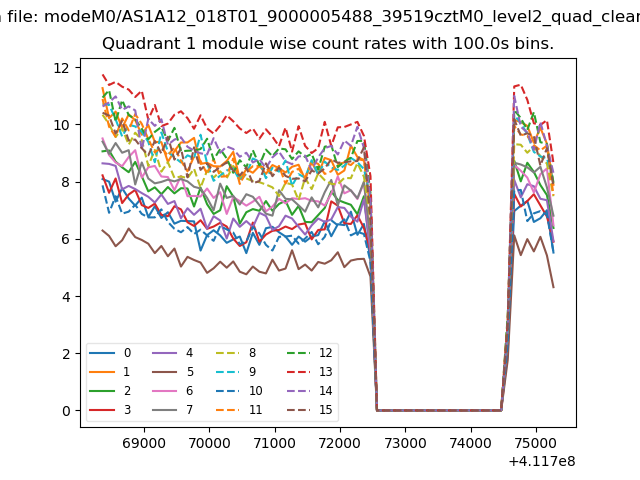
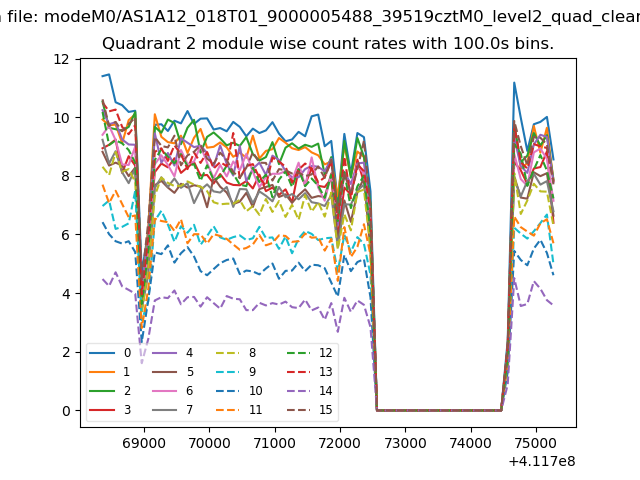
| Quadrant-wise count rates Data is divided into 100 sec bins |
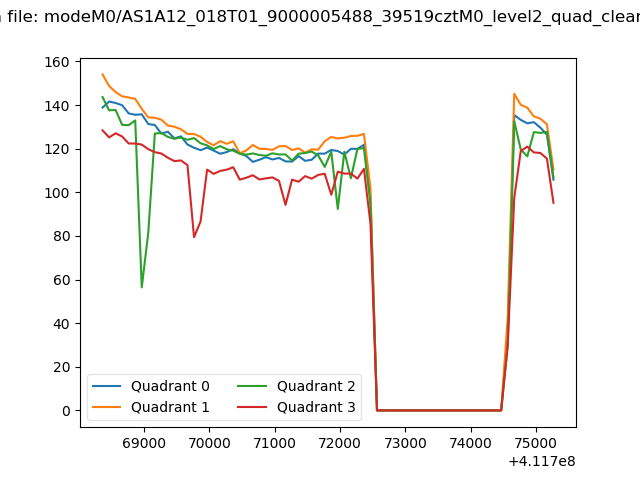 |
|
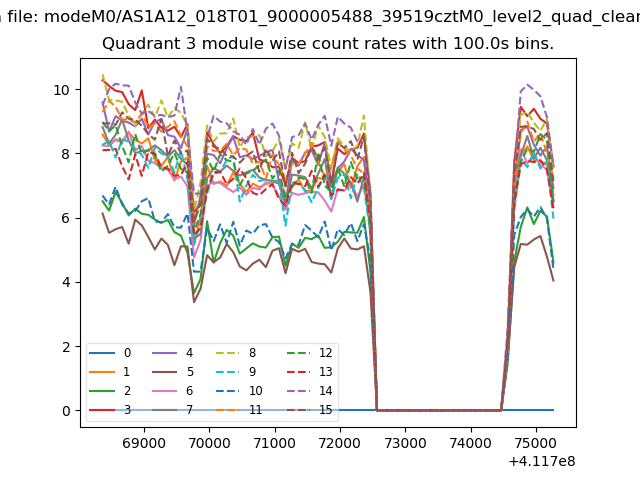
| Module-wise count rates for Quadrant A Data is divided into 100 sec bins |
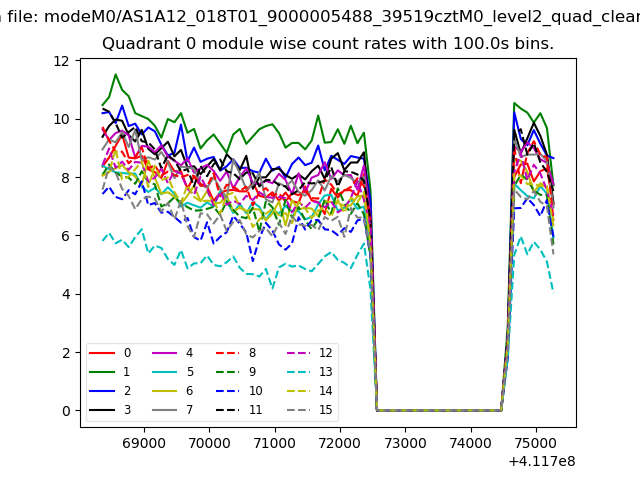 |
 |
| Module-wise count rates for Quadrant B Data is divided into 100 sec bins |
 |
 |
| Module-wise count rates for Quadrant C Data is divided into 100 sec bins |
 |
 |
| Module-wise count rates for Quadrant D Data is divided into 100 sec bins |
 |
 |
| Parameter | Plot |
|---|---|
| CZT HV Monitor | 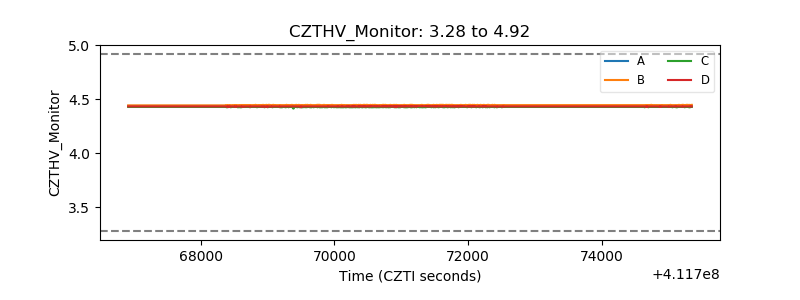 |
| D_VDD | 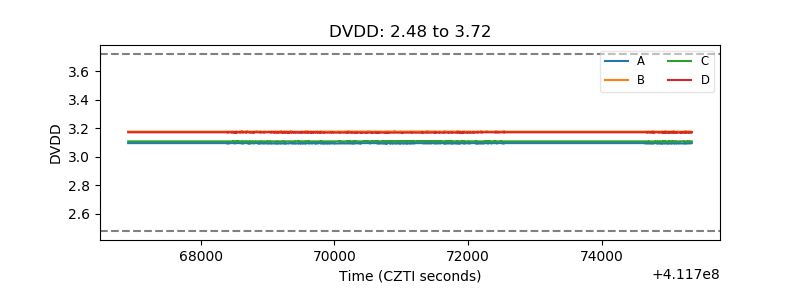 |
| Temperature 1 | 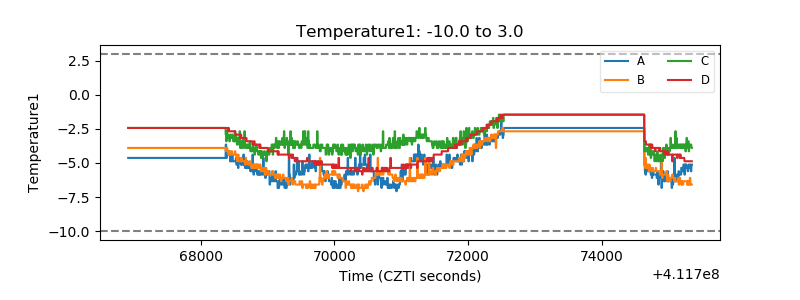 |
| Veto HV Monitor | 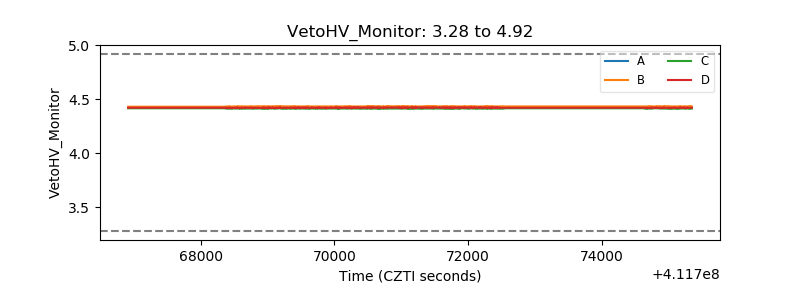 |
| Veto LLD | 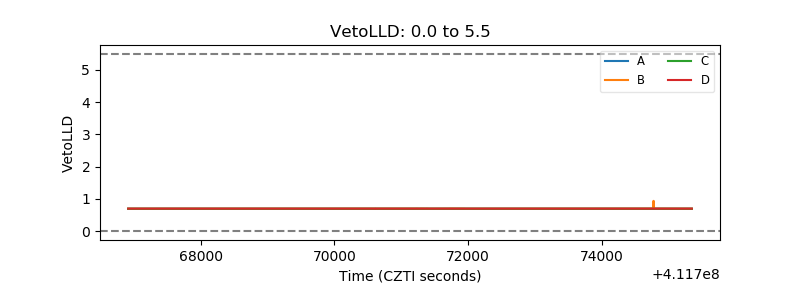 |
| Alpha Counter | 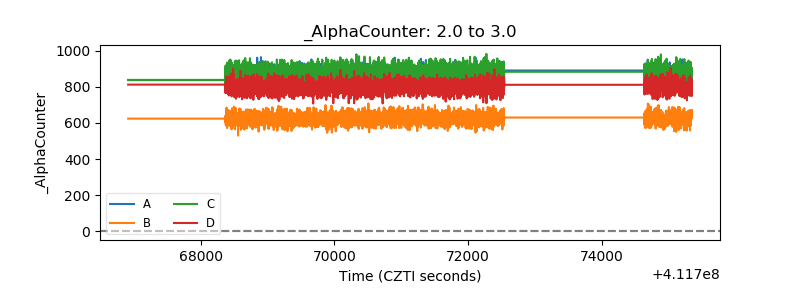 |
| _CPM_Rate |  |
| CZT Counter | 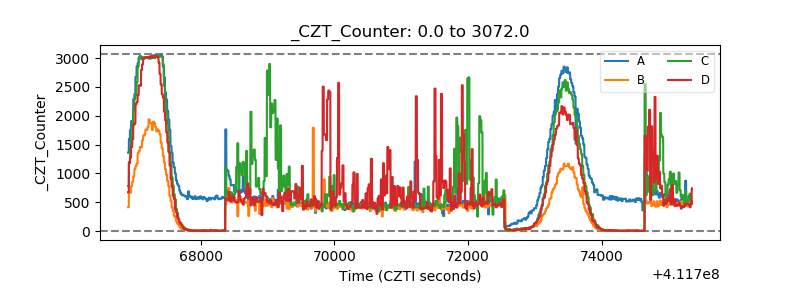 |
| +2.5 Volts monitor | 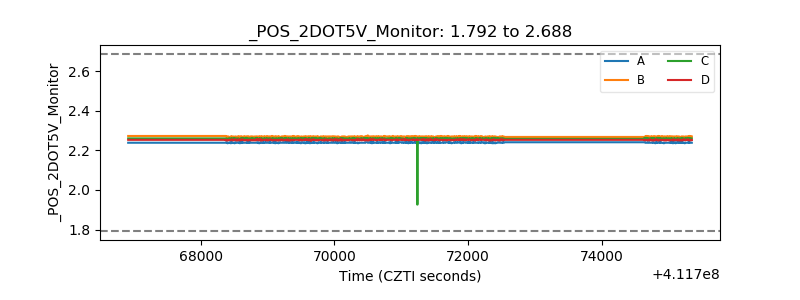 |
| +5 Volts monitor | 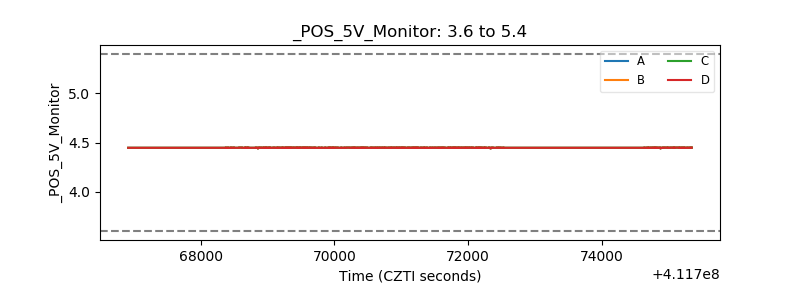 |
| _ROLL_ROT | 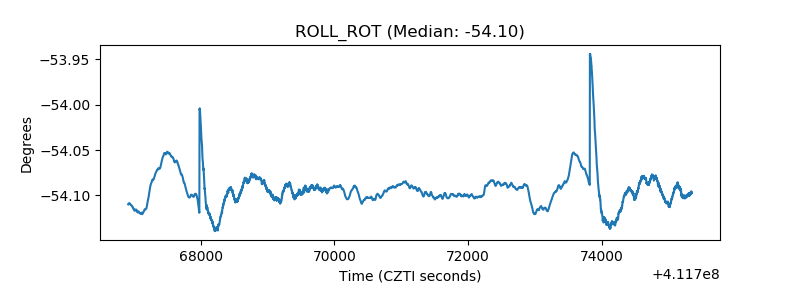 |
| _Roll_DEC | 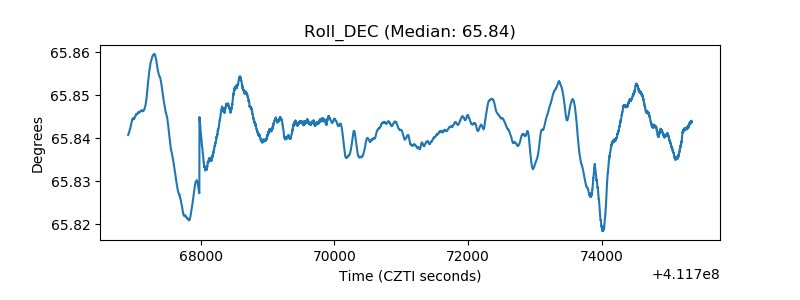 |
| _Roll_RA | 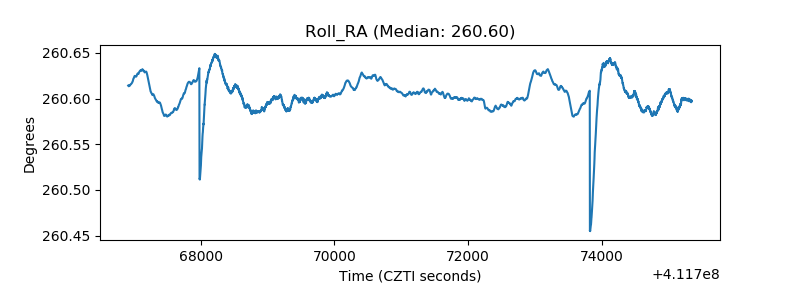 |
| Veto Counter | 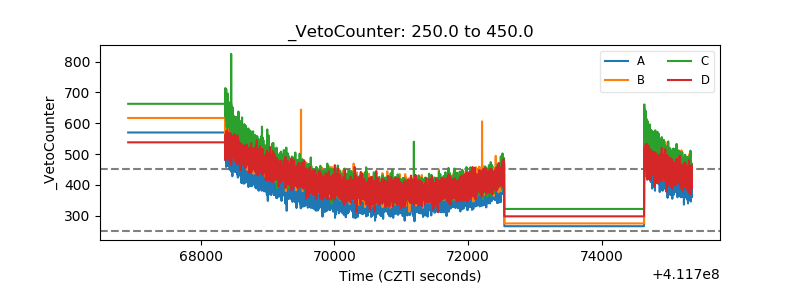 |