| Param | Original file | Final file |
|---|---|---|
| Filename | modeM0/AS1A12_018T01_9000005488_39520cztM0_level2.fits | modeM0/AS1A12_018T01_9000005488_39520cztM0_level2_quad_clean.evt |
| Size (bytes) | 307,440,000 | 87,045,120 |
| Size | 293.2 MB | 83.0 MB |
| Events in quadrant A | 2,547,400 | 588,330 |
| Events in quadrant B | 2,156,342 | 610,018 |
| Events in quadrant C | 3,166,093 | 572,224 |
| Events in quadrant D | 3,125,879 | 519,638 |
| Mode SS | |||
|---|---|---|---|
| Quadrant | BADHDUFLAG | Total packets | Discarded packets |
| A | 0 | 100 | 0 |
| B | 0 | 100 | 0 |
| C | 0 | 100 | 0 |
| D | 0 | 100 | 0 |
| Mode M0 | |||
|---|---|---|---|
| Quadrant | BADHDUFLAG | Total packets | Discarded packets |
| A | 0 | 10737 | 3 |
| B | 0 | 9921 | 2 |
| C | 0 | 12547 | 2 |
| D | 0 | 12814 | 2 |
| Mode M9 | |||
|---|---|---|---|
| Quadrant | BADHDUFLAG | Total packets | Discarded packets |
| A | 0 | 38 | 0 |
| B | 0 | 38 | 0 |
| C | 0 | 38 | 0 |
| D | 0 | 39 | 0 |
| Quadrant | Total seconds | Saturated seconds | Saturation percentage |
|---|---|---|---|
| A | 4932 | 14 | 0.283861% |
| B | 4932 | 5 | 0.101379% |
| C | 4932 | 148 | 3.000811% |
| D | 4932 | 214 | 4.339011% |
Noise dominated data is calculated using 1-second bins in cleaned event files. If a bin has >2000 counts, and if more than 50% of those come from <1% of pixels, then it is considered to be noise-dominated and hence unusable.
| Quadrant | # 1 sec bins | Bins with >0 counts | Bins with >2000 counts | High rate bins dominated by noise | Noise dominated (total time) | Noise dominated (detector-on time) | Marked lightcurve |
|---|---|---|---|---|---|---|---|
| A | 7055 | 4933 | 5 | 5 | 0.07% | 0.10% | 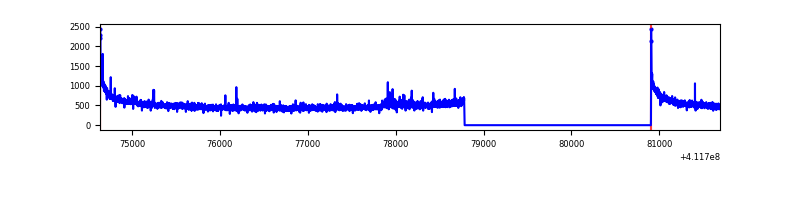 |
| B | 7055 | 4933 | 0 | 0 | 0.00% | 0.00% | 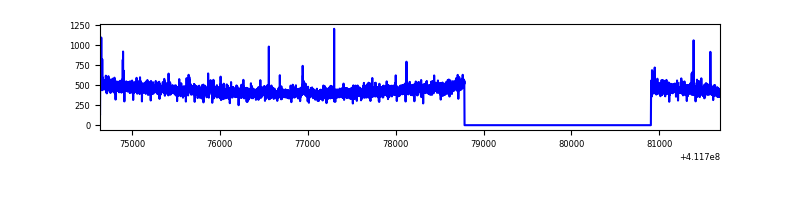 |
| C | 7055 | 4933 | 126 | 126 | 1.79% | 2.55% | 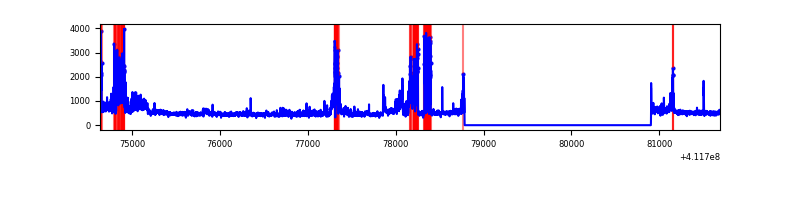 |
| D | 7055 | 4933 | 191 | 191 | 2.71% | 3.87% | 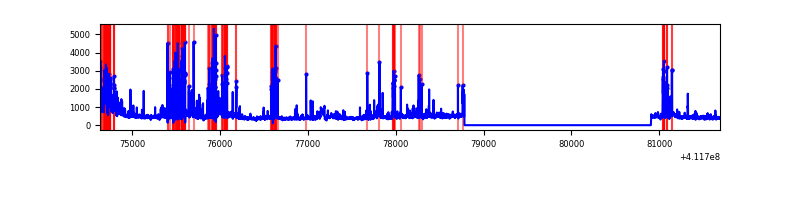 |
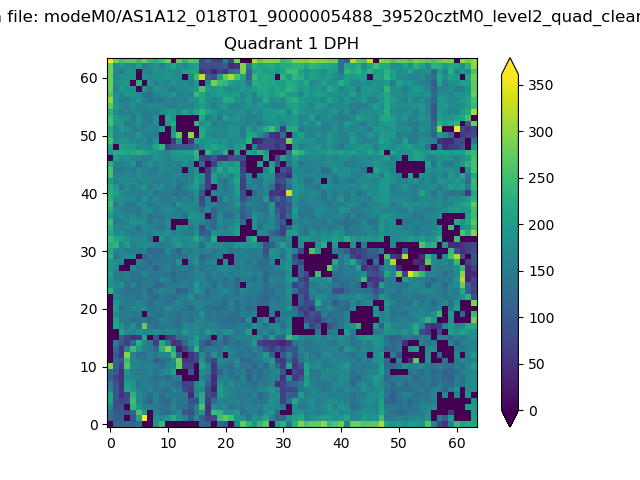
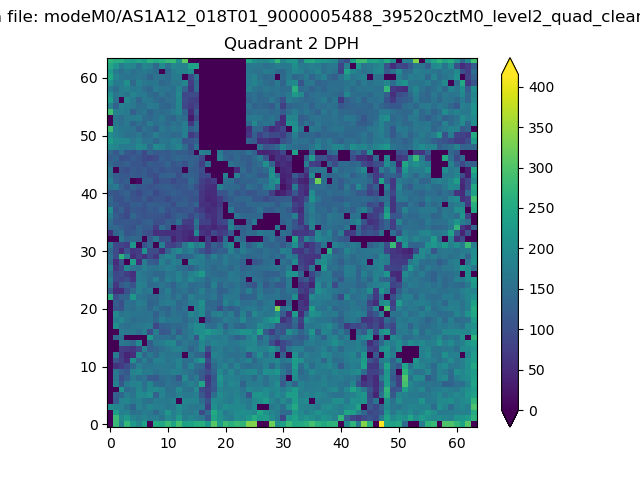
Top three noisy pixels from each quadrant. If the there are fewer than three noisy pixels in the level2.evt file, extra rows are filled as -1
| Pixel properties | Quadrant properties | ||||||
|---|---|---|---|---|---|---|---|
| Quadrant | DetID | PixID | Counts | Sigma | Mean | Median | Sigma |
| A | 10 | 83 | 405619 | 3689.95 | 539 | 530 | 109.8 |
| A | 15 | 222 | 42676 | 383.91 | 539 | 530 | 109.8 |
| A | 13 | 6 | 7093 | 59.78 | 539 | 530 | 109.8 |
| B | 5 | 255 | 24095 | 228.29 | 542 | 530 | 103.2 |
| B | 12 | 111 | 12915 | 119.98 | 542 | 530 | 103.2 |
| B | 11 | 111 | 11667 | 107.89 | 542 | 530 | 103.2 |
| C | 9 | 187 | 795742 | 6532.12 | 527 | 533 | 121.7 |
| C | 15 | 214 | 206606 | 1692.76 | 527 | 533 | 121.7 |
| C | 15 | 208 | 83821 | 684.16 | 527 | 533 | 121.7 |
| D | 12 | 227 | 646652 | 5119.24 | 518 | 504 | 126.2 |
| D | 2 | 249 | 251730 | 1990.39 | 518 | 504 | 126.2 |
| D | 13 | 249 | 222408 | 1758.08 | 518 | 504 | 126.2 |
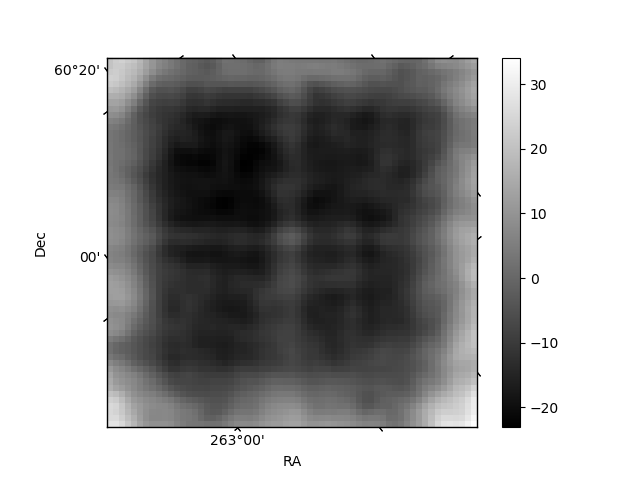
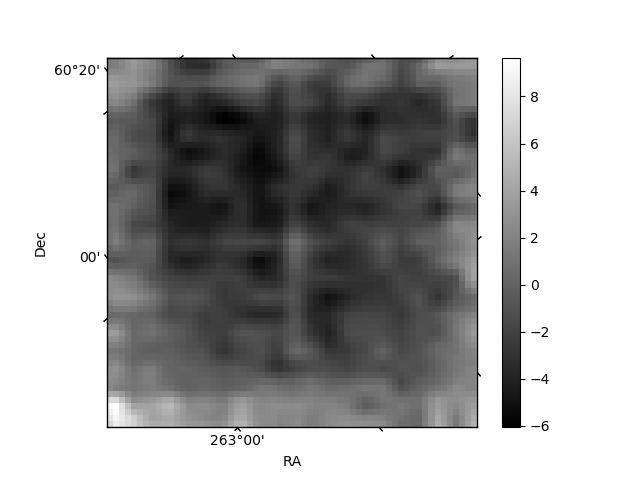
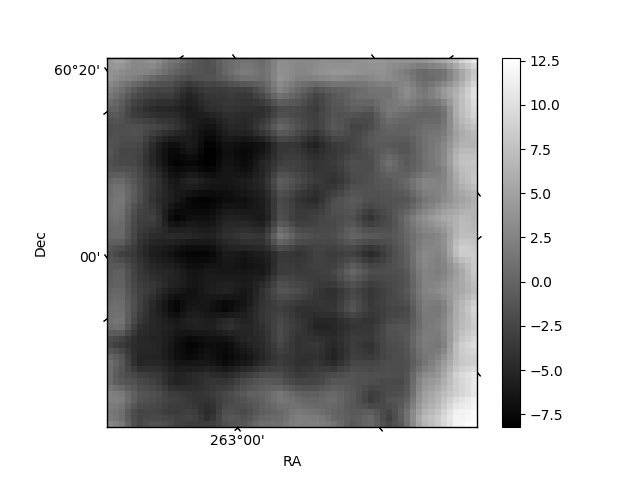
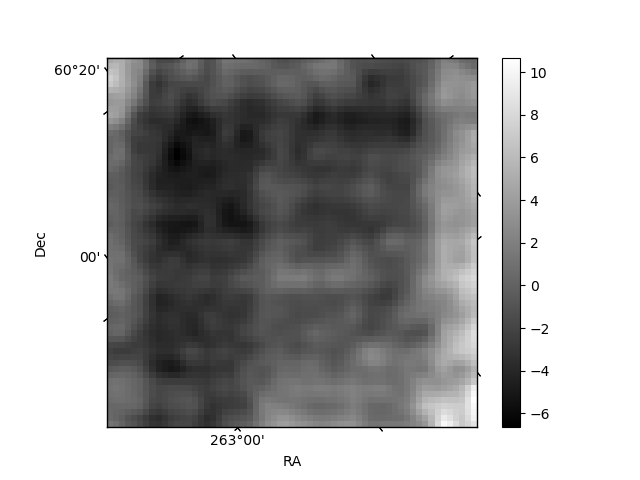
Histogram calculated using DETX and DETY for each event in the final _common_clean file
| Quadrant A | 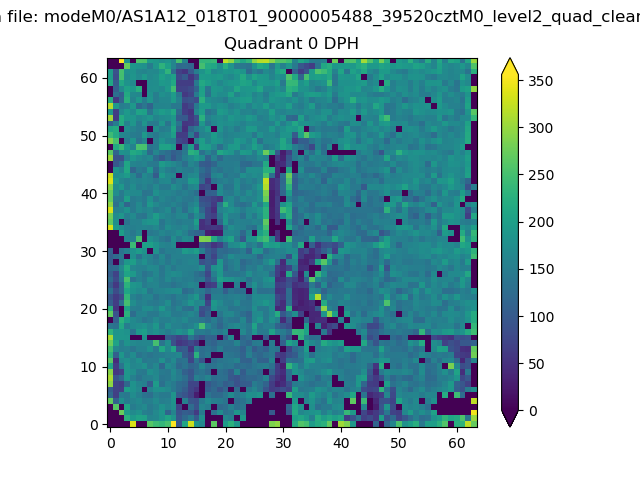 |
 |
Quadrant B |
|---|---|---|---|
| Quadrant D | 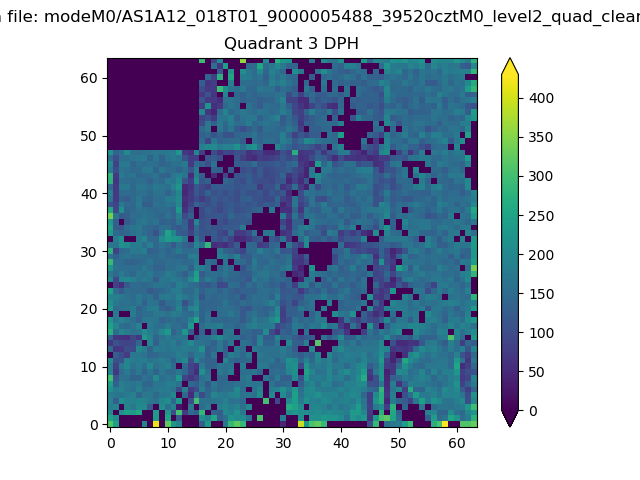 |
 |
Quadrant C |
| Plot type | Count rate plots | Images |
|---|---|---|
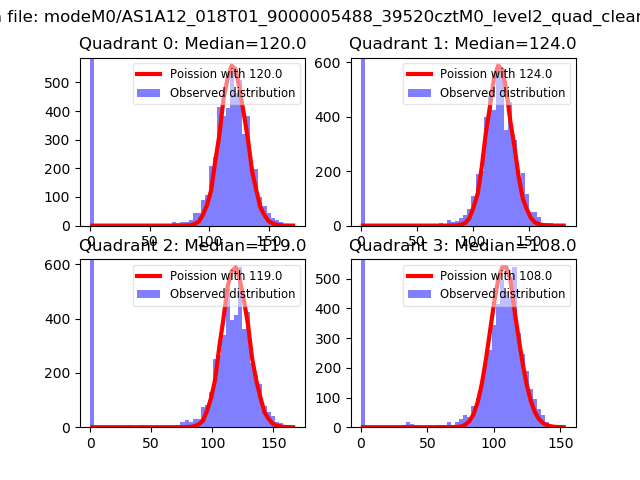
| Comparison with Poisson distribution Blue bars denote a histogram of data divided into 1 sec bins. Red curve is a Poisson curve with rate = median count rate of data. |
 |
 |
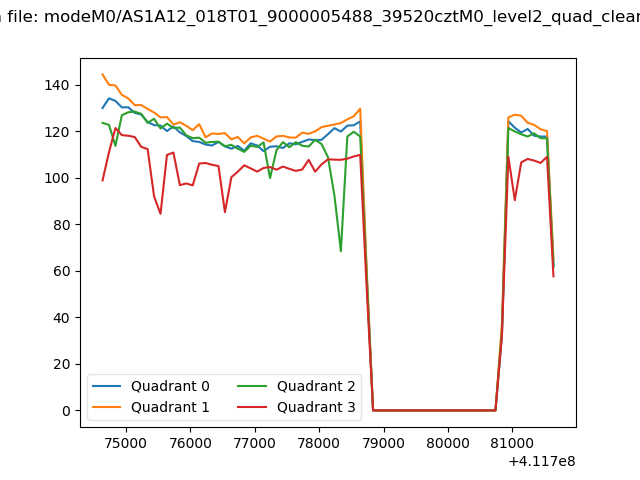
| Quadrant-wise count rates Data is divided into 100 sec bins |
 |
|
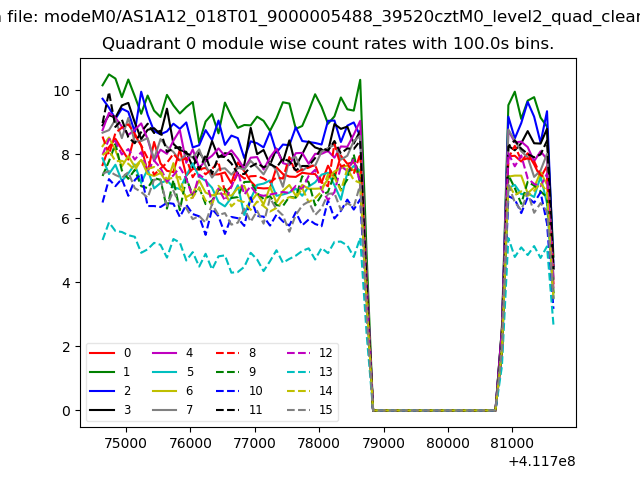
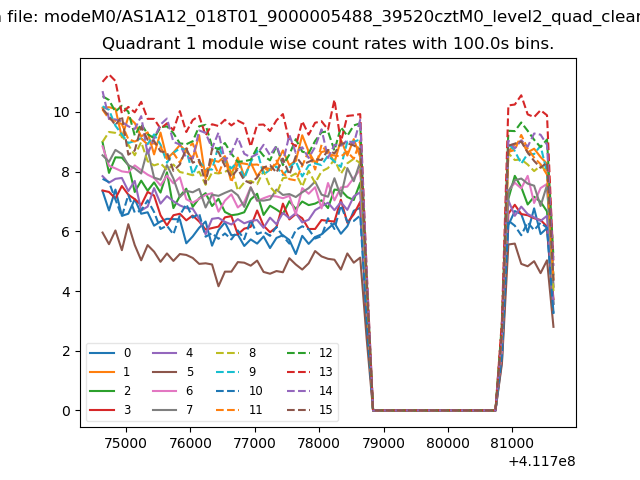
| Module-wise count rates for Quadrant A Data is divided into 100 sec bins |
 |
 |
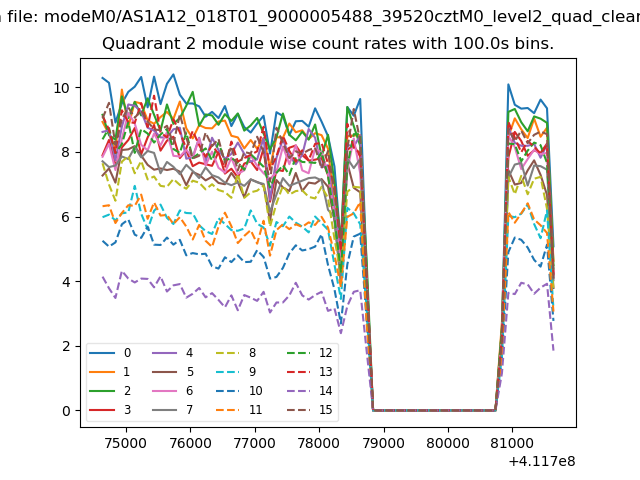
| Module-wise count rates for Quadrant B Data is divided into 100 sec bins |
 |
 |
| Module-wise count rates for Quadrant C Data is divided into 100 sec bins |
 |
 |
| Module-wise count rates for Quadrant D Data is divided into 100 sec bins |
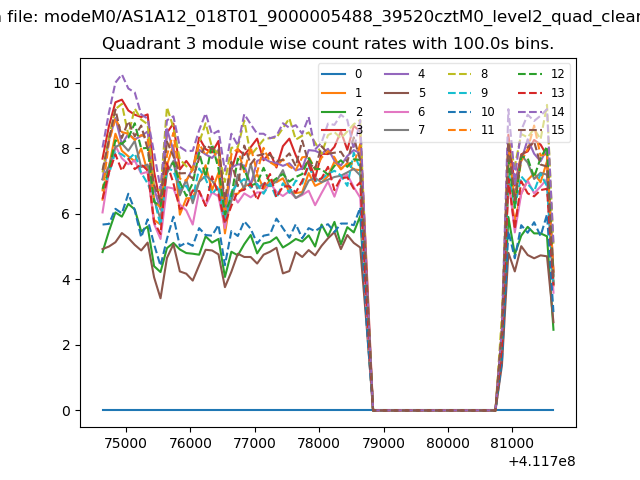 |
 |
| Parameter | Plot |
|---|---|
| CZT HV Monitor | 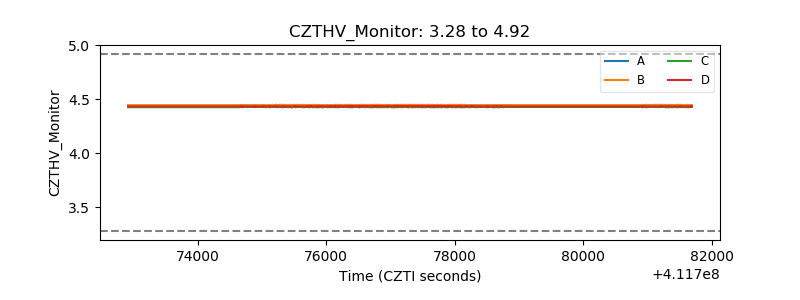 |
| D_VDD | 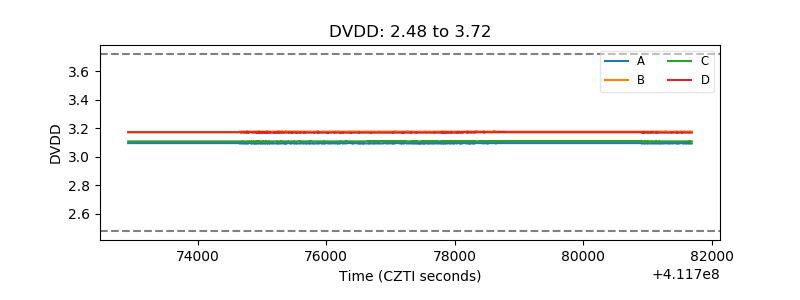 |
| Temperature 1 | 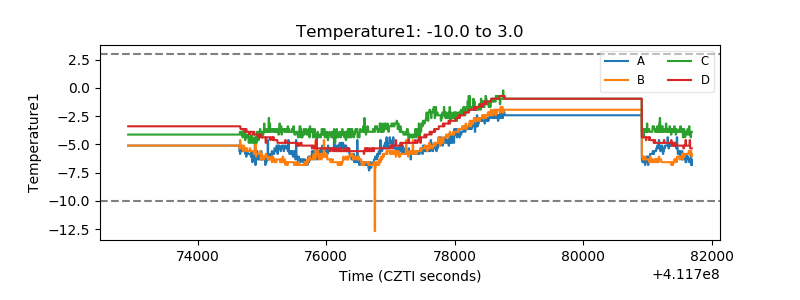 |
| Veto HV Monitor | 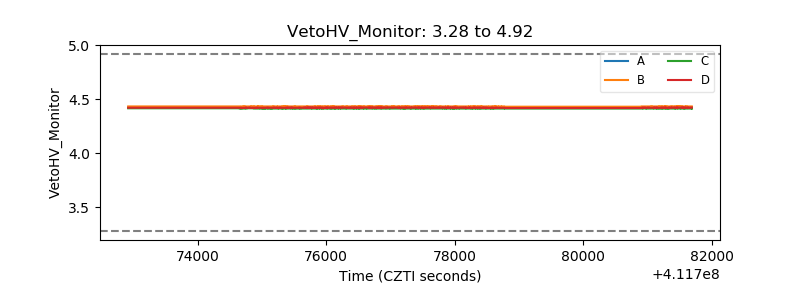 |
| Veto LLD | 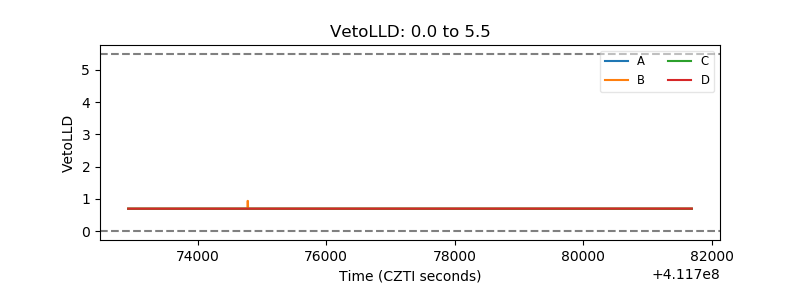 |
| Alpha Counter | 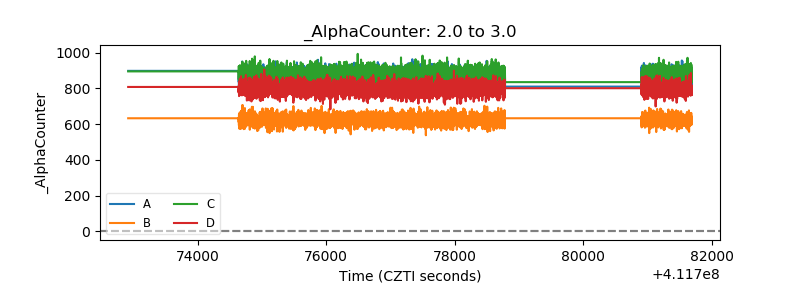 |
| _CPM_Rate | 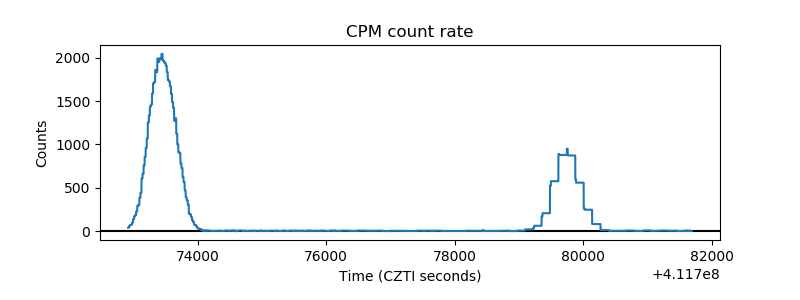 |
| CZT Counter | 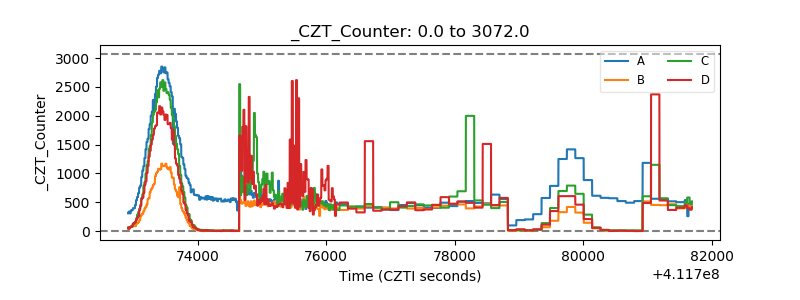 |
| +2.5 Volts monitor | 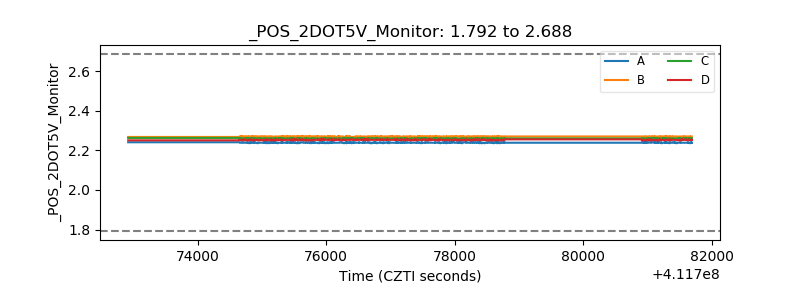 |
| +5 Volts monitor | 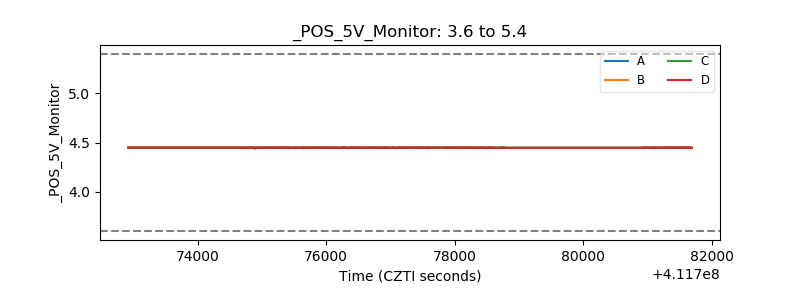 |
| _ROLL_ROT | 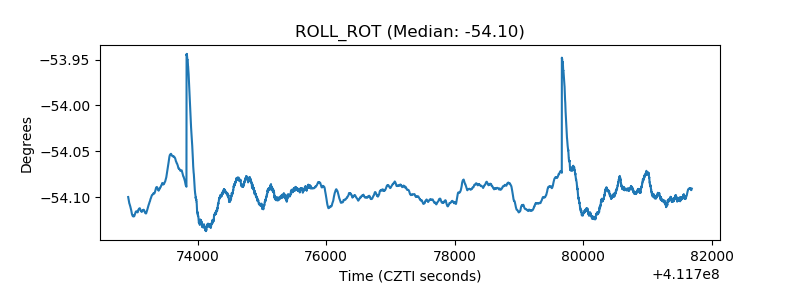 |
| _Roll_DEC | 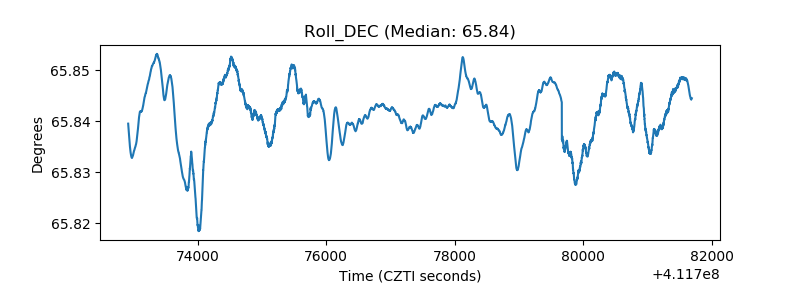 |
| _Roll_RA | 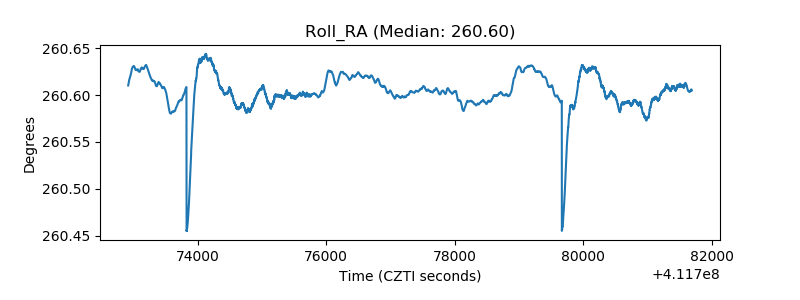 |
| Veto Counter | 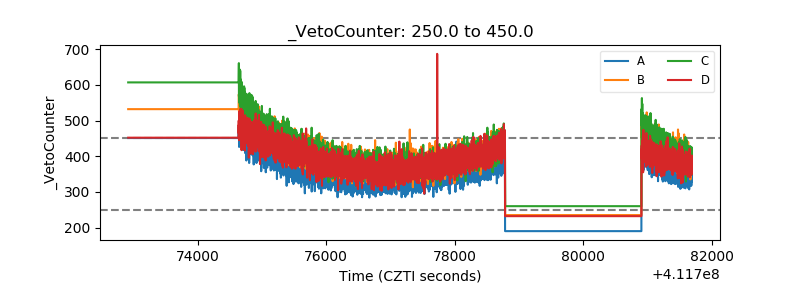 |