| Param | Original file | Final file |
|---|---|---|
| Filename | modeM0/AS1A12_018T01_9000005488_39521cztM0_level2.fits | modeM0/AS1A12_018T01_9000005488_39521cztM0_level2_quad_clean.evt |
| Size (bytes) | 293,414,400 | 87,834,240 |
| Size | 279.8 MB | 83.8 MB |
| Events in quadrant A | 2,678,571 | 585,616 |
| Events in quadrant B | 2,246,372 | 605,502 |
| Events in quadrant C | 2,874,873 | 579,405 |
| Events in quadrant D | 2,657,396 | 526,252 |
| Mode SS | |||
|---|---|---|---|
| Quadrant | BADHDUFLAG | Total packets | Discarded packets |
| A | 0 | 106 | 0 |
| B | 0 | 106 | 0 |
| C | 0 | 106 | 0 |
| D | 0 | 106 | 0 |
| Mode M0 | |||
|---|---|---|---|
| Quadrant | BADHDUFLAG | Total packets | Discarded packets |
| A | 0 | 11343 | 3 |
| B | 0 | 10591 | 2 |
| C | 0 | 11776 | 2 |
| D | 0 | 11919 | 2 |
| Mode M9 | |||
|---|---|---|---|
| Quadrant | BADHDUFLAG | Total packets | Discarded packets |
| A | 0 | 39 | 0 |
| B | 0 | 39 | 0 |
| C | 0 | 39 | 0 |
| D | 0 | 40 | 0 |
| Quadrant | Total seconds | Saturated seconds | Saturation percentage |
|---|---|---|---|
| A | 5179 | 19 | 0.366866% |
| B | 5179 | 12 | 0.231705% |
| C | 5179 | 40 | 0.772350% |
| D | 5179 | 107 | 2.066036% |
Noise dominated data is calculated using 1-second bins in cleaned event files. If a bin has >2000 counts, and if more than 50% of those come from <1% of pixels, then it is considered to be noise-dominated and hence unusable.
| Quadrant | # 1 sec bins | Bins with >0 counts | Bins with >2000 counts | High rate bins dominated by noise | Noise dominated (total time) | Noise dominated (detector-on time) | Marked lightcurve |
|---|---|---|---|---|---|---|---|
| A | 7272 | 5180 | 16 | 16 | 0.22% | 0.31% | 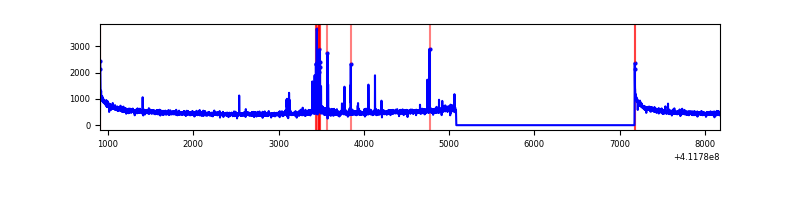 |
| B | 7272 | 5180 | 5 | 5 | 0.07% | 0.10% | 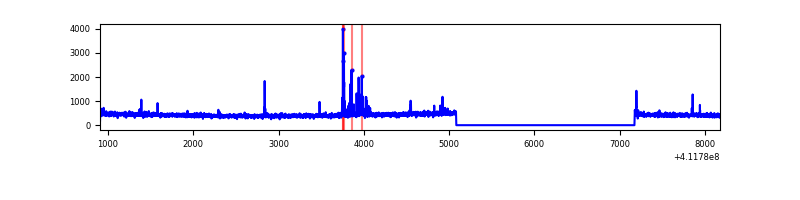 |
| C | 7272 | 5180 | 40 | 40 | 0.55% | 0.77% | 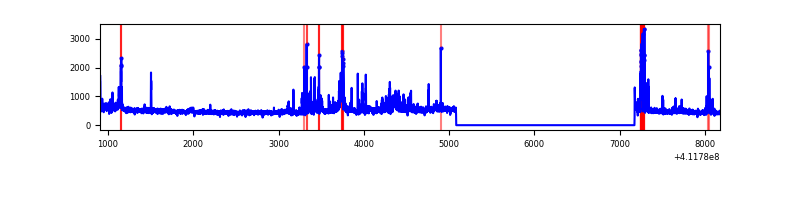 |
| D | 7272 | 5180 | 76 | 76 | 1.05% | 1.47% |  |
Top three noisy pixels from each quadrant. If the there are fewer than three noisy pixels in the level2.evt file, extra rows are filled as -1
| Pixel properties | Quadrant properties | ||||||
|---|---|---|---|---|---|---|---|
| Quadrant | DetID | PixID | Counts | Sigma | Mean | Median | Sigma |
| A | 10 | 83 | 420639 | 3765.56 | 548 | 540 | 111.6 |
| A | 6 | 10 | 93167 | 830.26 | 548 | 540 | 111.6 |
| A | 15 | 222 | 24050 | 210.73 | 548 | 540 | 111.6 |
| B | 5 | 255 | 92444 | 866.98 | 549 | 534 | 106.0 |
| B | 12 | 111 | 13158 | 119.08 | 549 | 534 | 106.0 |
| B | 11 | 111 | 12038 | 108.51 | 549 | 534 | 106.0 |
| C | 9 | 187 | 384607 | 3081.19 | 535 | 541 | 124.6 |
| C | 15 | 214 | 217699 | 1742.16 | 535 | 541 | 124.6 |
| C | 15 | 208 | 163538 | 1307.65 | 535 | 541 | 124.6 |
| D | 2 | 249 | 232486 | 1823.06 | 526 | 512 | 127.2 |
| D | 13 | 171 | 133427 | 1044.56 | 526 | 512 | 127.2 |
| D | 12 | 227 | 114510 | 895.9 | 526 | 512 | 127.2 |
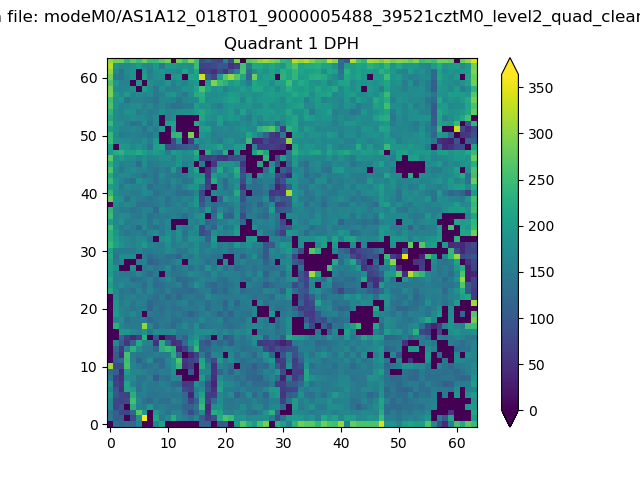
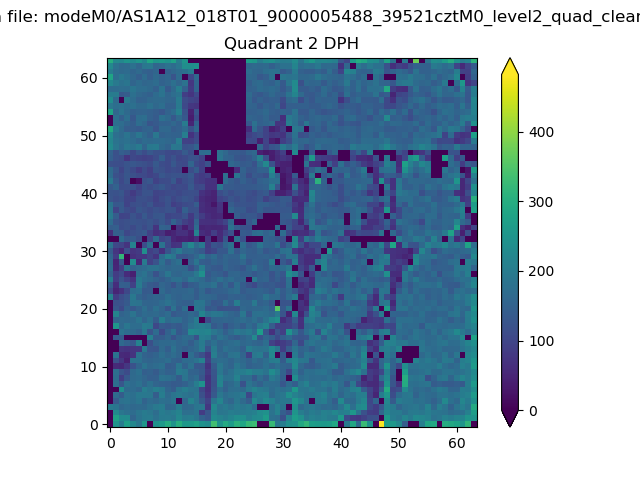
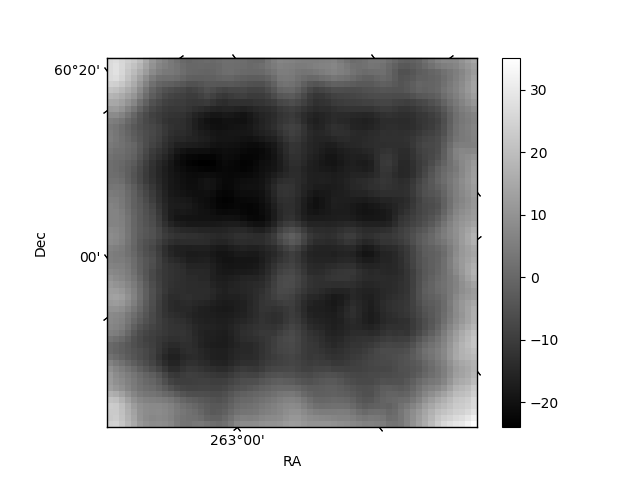
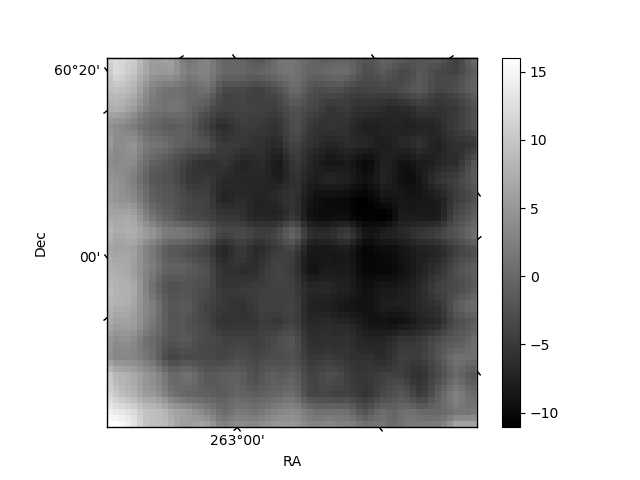
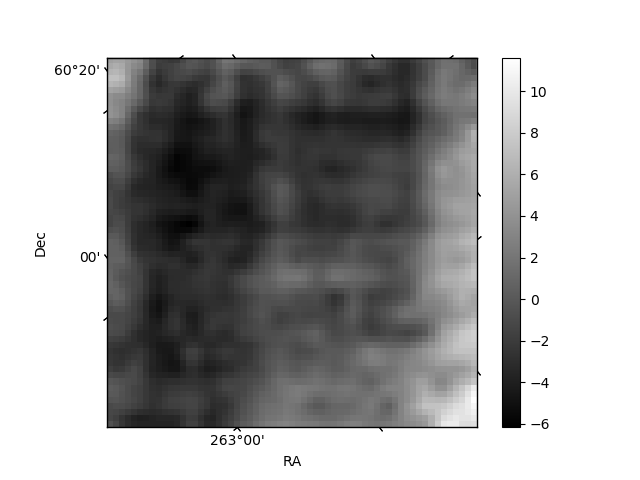
Histogram calculated using DETX and DETY for each event in the final _common_clean file
| Quadrant A | 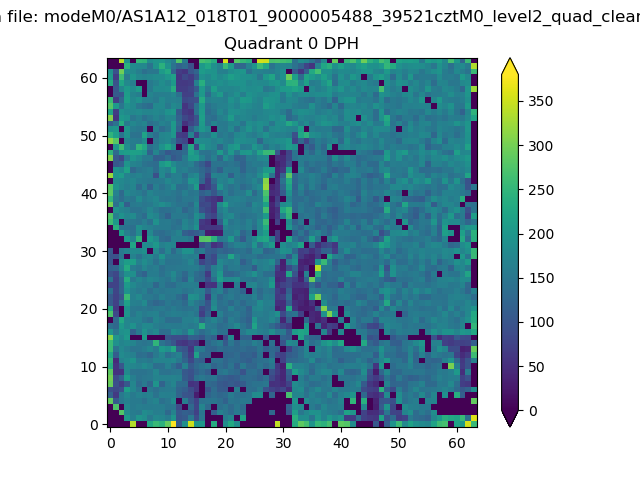 |
 |
Quadrant B |
|---|---|---|---|
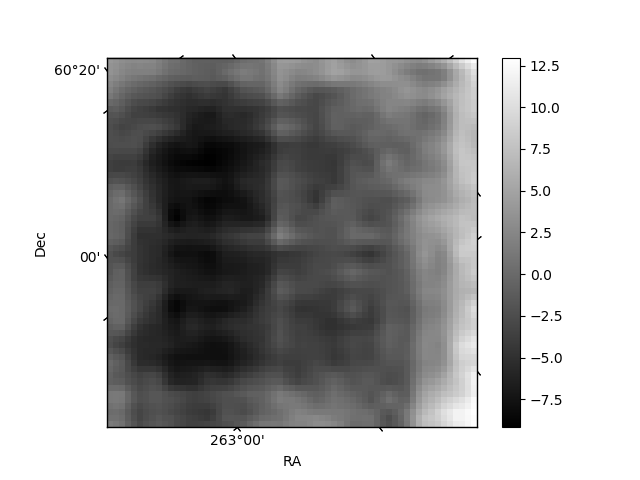
| Quadrant D | 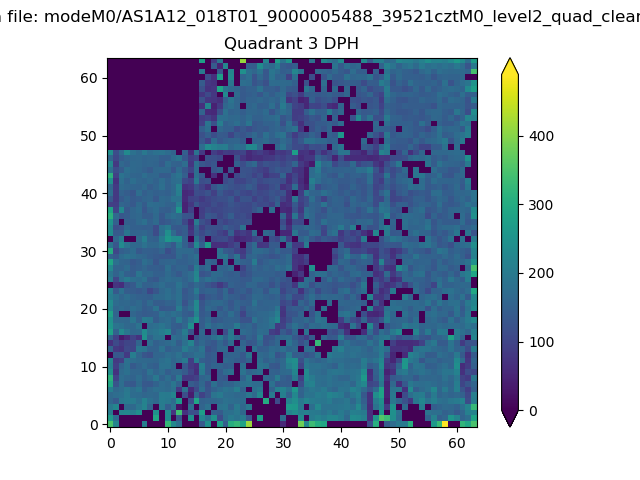 |
 |
Quadrant C |
| Plot type | Count rate plots | Images |
|---|---|---|
| Comparison with Poisson distribution Blue bars denote a histogram of data divided into 1 sec bins. Red curve is a Poisson curve with rate = median count rate of data. |
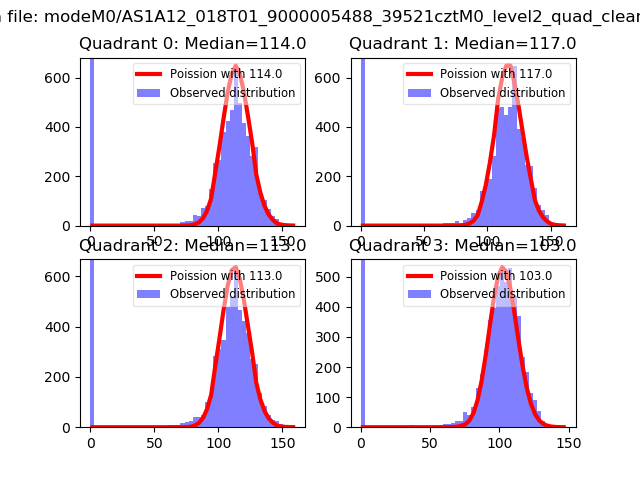 |
 |
| Quadrant-wise count rates Data is divided into 100 sec bins |
 |
|
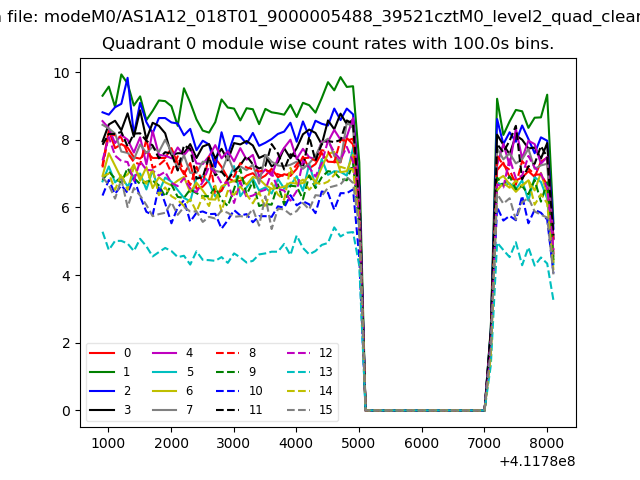
| Module-wise count rates for Quadrant A Data is divided into 100 sec bins |
 |
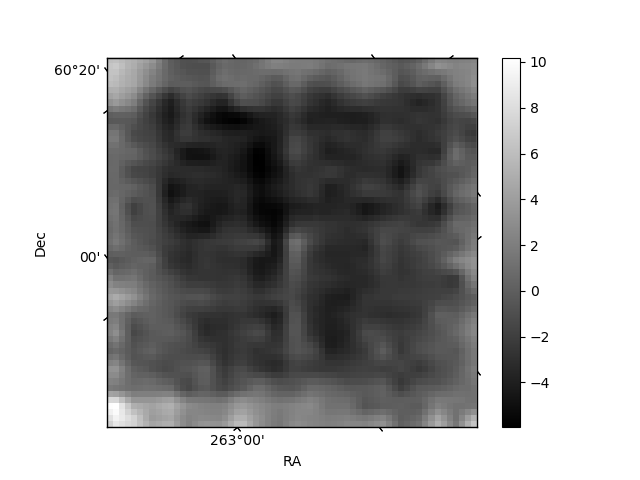 |
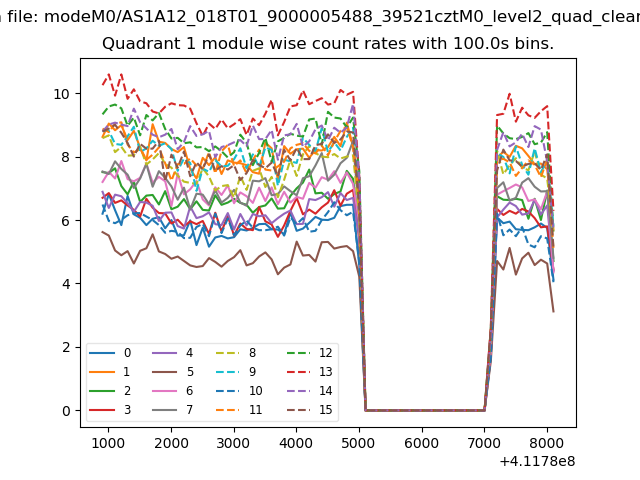
| Module-wise count rates for Quadrant B Data is divided into 100 sec bins |
 |
 |
| Module-wise count rates for Quadrant C Data is divided into 100 sec bins |
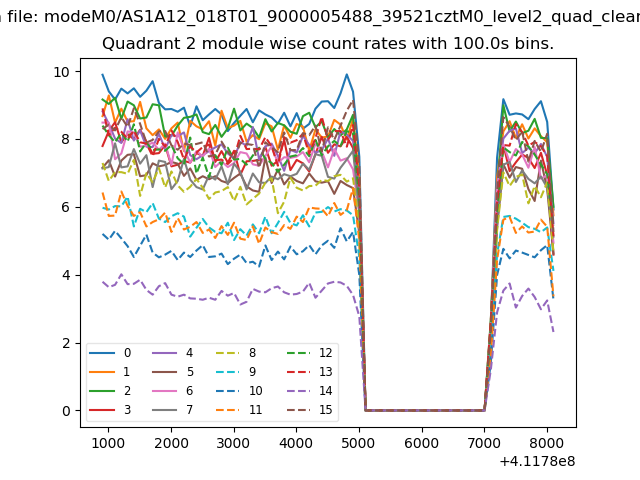 |
 |
| Module-wise count rates for Quadrant D Data is divided into 100 sec bins |
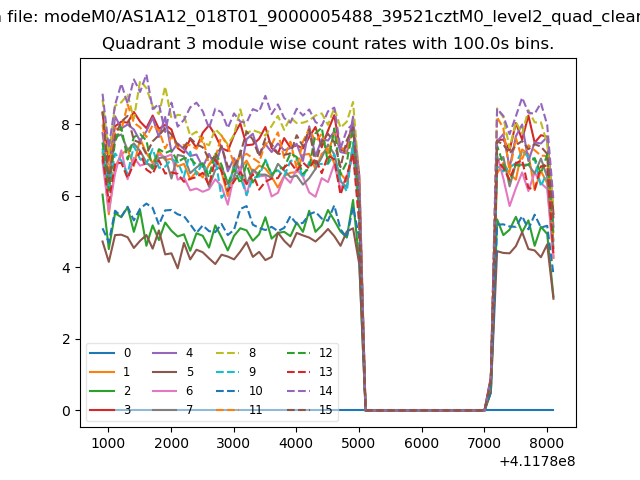 |
 |
| Parameter | Plot |
|---|---|
| CZT HV Monitor | 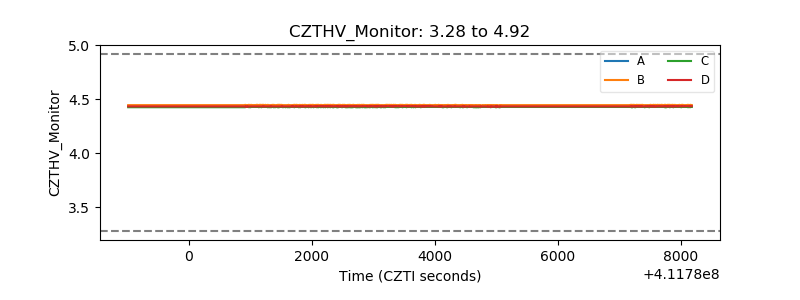 |
| D_VDD | 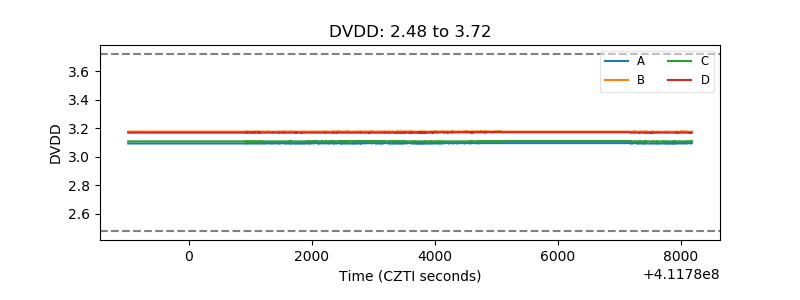 |
| Temperature 1 | 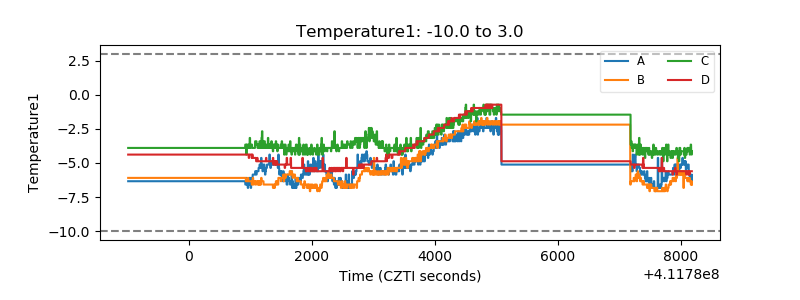 |
| Veto HV Monitor | 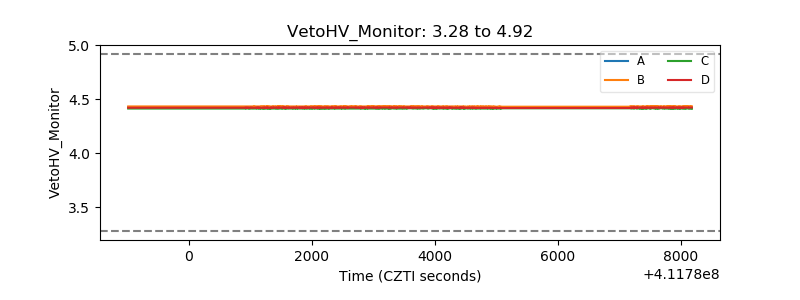 |
| Veto LLD | 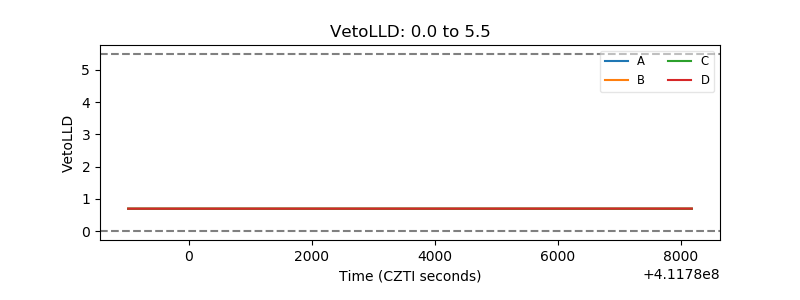 |
| Alpha Counter | 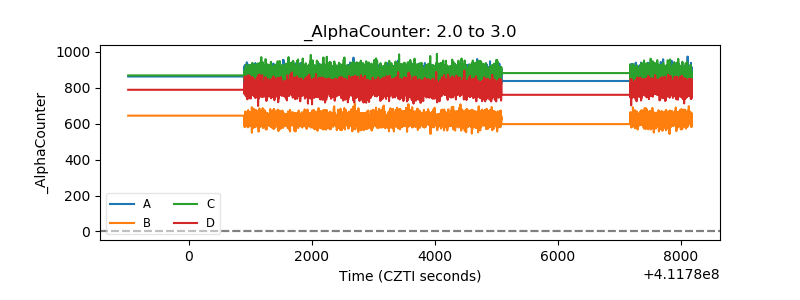 |
| _CPM_Rate | 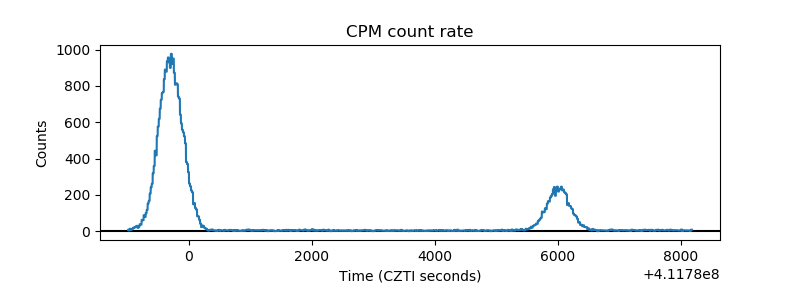 |
| CZT Counter | 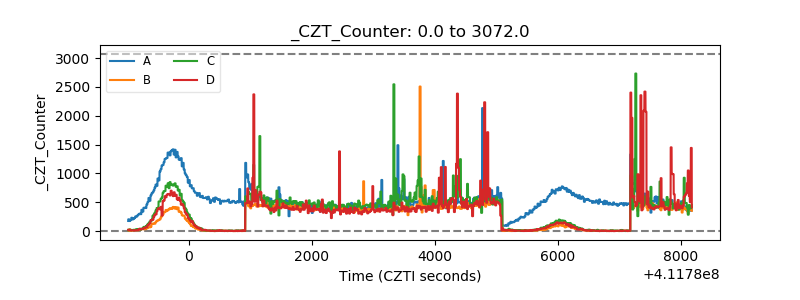 |
| +2.5 Volts monitor | 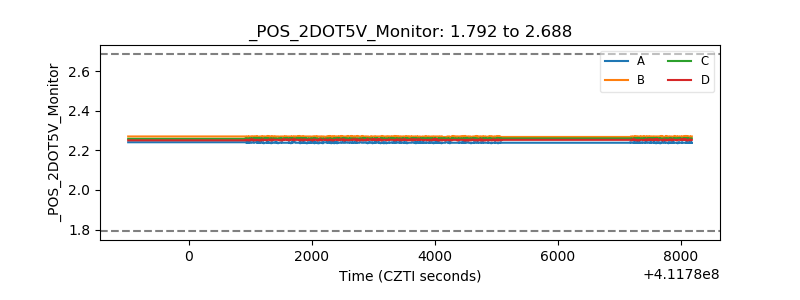 |
| +5 Volts monitor | 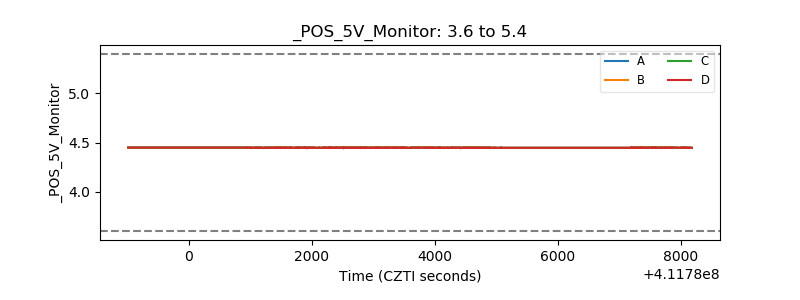 |
| _ROLL_ROT | 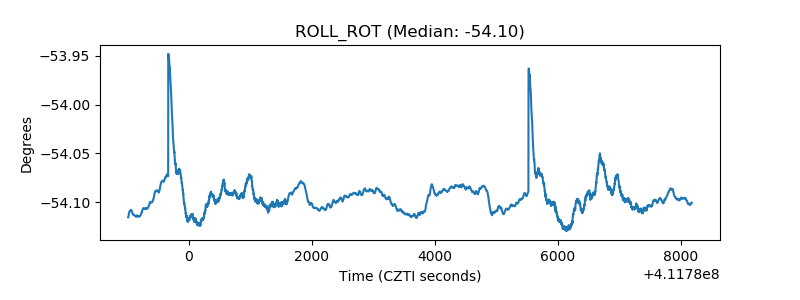 |
| _Roll_DEC | 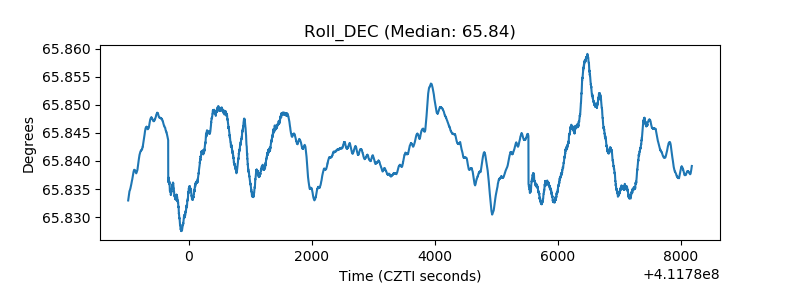 |
| _Roll_RA | 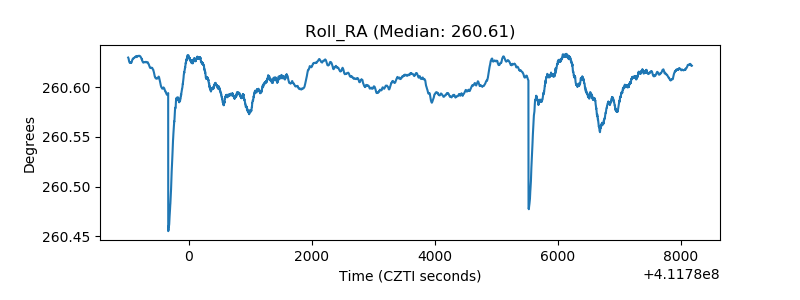 |
| Veto Counter | 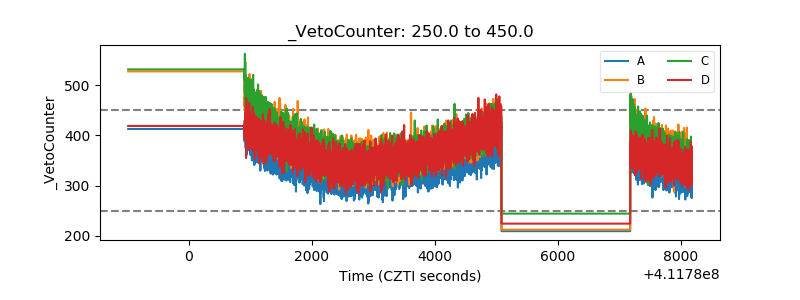 |