| Param | Original file | Final file |
|---|---|---|
| Filename | modeM0/AS1A12_018T01_9000005488_39522cztM0_level2.fits | modeM0/AS1A12_018T01_9000005488_39522cztM0_level2_quad_clean.evt |
| Size (bytes) | 327,314,880 | 88,266,240 |
| Size | 312.2 MB | 84.2 MB |
| Events in quadrant A | 3,052,329 | 582,502 |
| Events in quadrant B | 2,303,636 | 608,631 |
| Events in quadrant C | 3,287,727 | 575,231 |
| Events in quadrant D | 3,053,898 | 530,448 |
| Mode SS | |||
|---|---|---|---|
| Quadrant | BADHDUFLAG | Total packets | Discarded packets |
| A | 0 | 108 | 0 |
| B | 0 | 108 | 0 |
| C | 0 | 108 | 0 |
| D | 0 | 108 | 0 |
| Mode M0 | |||
|---|---|---|---|
| Quadrant | BADHDUFLAG | Total packets | Discarded packets |
| A | 0 | 12579 | 3 |
| B | 0 | 10973 | 2 |
| C | 0 | 13476 | 2 |
| D | 0 | 13140 | 2 |
| Mode M9 | |||
|---|---|---|---|
| Quadrant | BADHDUFLAG | Total packets | Discarded packets |
| A | 0 | 25 | 0 |
| B | 0 | 25 | 0 |
| C | 0 | 25 | 0 |
| D | 0 | 26 | 0 |
| Quadrant | Total seconds | Saturated seconds | Saturation percentage |
|---|---|---|---|
| A | 5373 | 102 | 1.898381% |
| B | 5373 | 25 | 0.465289% |
| C | 5373 | 60 | 1.116695% |
| D | 5373 | 104 | 1.935604% |
Noise dominated data is calculated using 1-second bins in cleaned event files. If a bin has >2000 counts, and if more than 50% of those come from <1% of pixels, then it is considered to be noise-dominated and hence unusable.
| Quadrant | # 1 sec bins | Bins with >0 counts | Bins with >2000 counts | High rate bins dominated by noise | Noise dominated (total time) | Noise dominated (detector-on time) | Marked lightcurve |
|---|---|---|---|---|---|---|---|
| A | 7226 | 5374 | 80 | 80 | 1.11% | 1.49% | 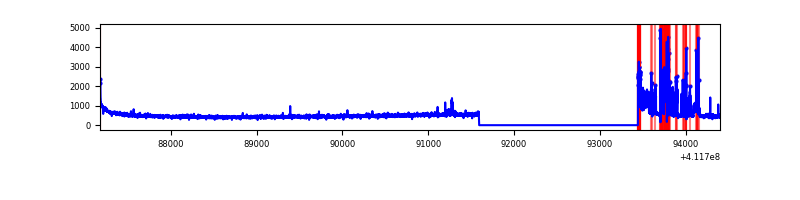 |
| B | 7226 | 5374 | 14 | 14 | 0.19% | 0.26% | 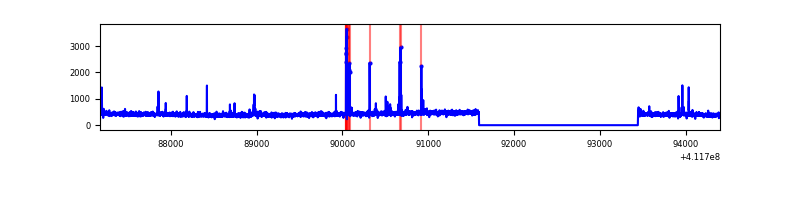 |
| C | 7226 | 5374 | 59 | 59 | 0.82% | 1.10% |  |
| D | 7226 | 5374 | 93 | 93 | 1.29% | 1.73% | 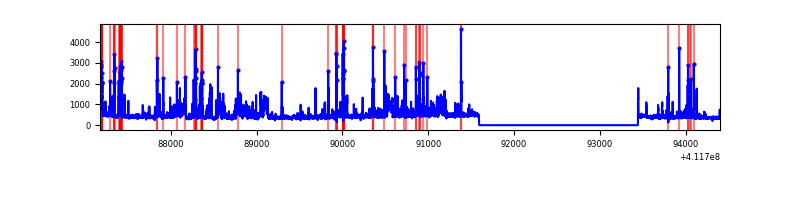 |
Top three noisy pixels from each quadrant. If the there are fewer than three noisy pixels in the level2.evt file, extra rows are filled as -1
| Pixel properties | Quadrant properties | ||||||
|---|---|---|---|---|---|---|---|
| Quadrant | DetID | PixID | Counts | Sigma | Mean | Median | Sigma |
| A | 10 | 83 | 422289 | 3732.36 | 560 | 549 | 113.0 |
| A | 6 | 10 | 421525 | 3725.6 | 560 | 549 | 113.0 |
| A | 15 | 222 | 29999 | 260.63 | 560 | 549 | 113.0 |
| B | 5 | 255 | 99583 | 909.4 | 562 | 545 | 108.9 |
| B | 12 | 111 | 13637 | 120.21 | 562 | 545 | 108.9 |
| B | 11 | 111 | 12672 | 111.35 | 562 | 545 | 108.9 |
| C | 9 | 187 | 801771 | 6302.84 | 546 | 549 | 127.1 |
| C | 15 | 214 | 226691 | 1778.95 | 546 | 549 | 127.1 |
| C | 15 | 208 | 116011 | 908.29 | 546 | 549 | 127.1 |
| D | 12 | 227 | 483092 | 3680.04 | 539 | 524 | 131.1 |
| D | 2 | 249 | 176177 | 1339.52 | 539 | 524 | 131.1 |
| D | 13 | 249 | 136391 | 1036.11 | 539 | 524 | 131.1 |
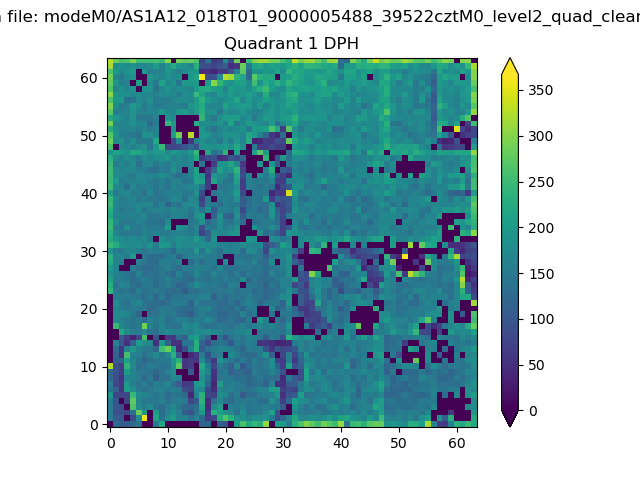
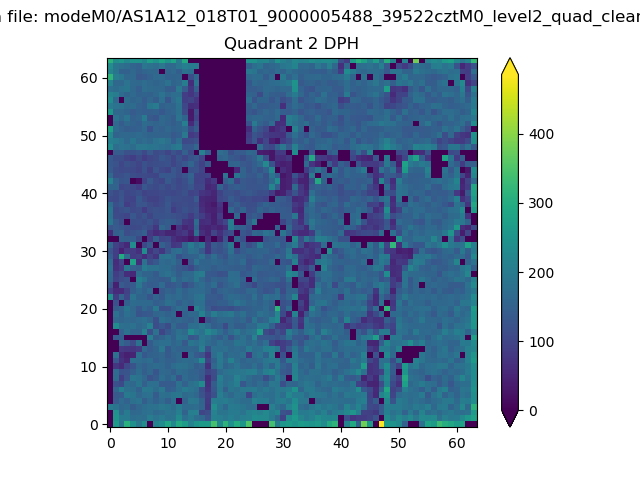
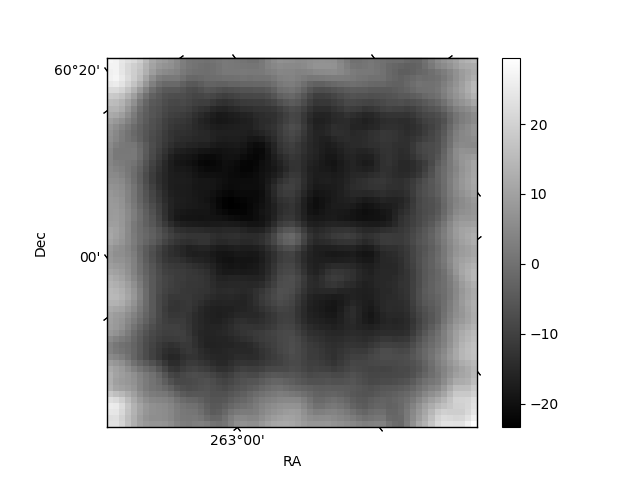
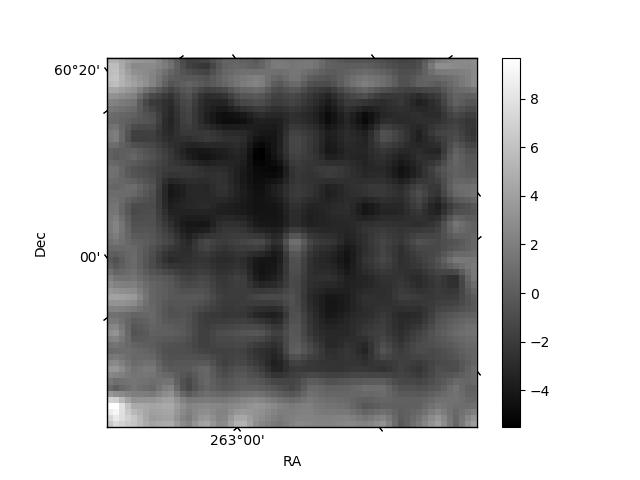
Histogram calculated using DETX and DETY for each event in the final _common_clean file
| Quadrant A | 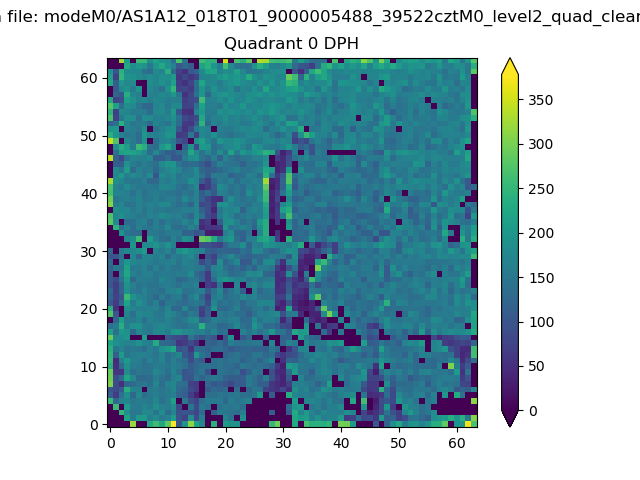 |
 |
Quadrant B |
|---|---|---|---|
| Quadrant D | 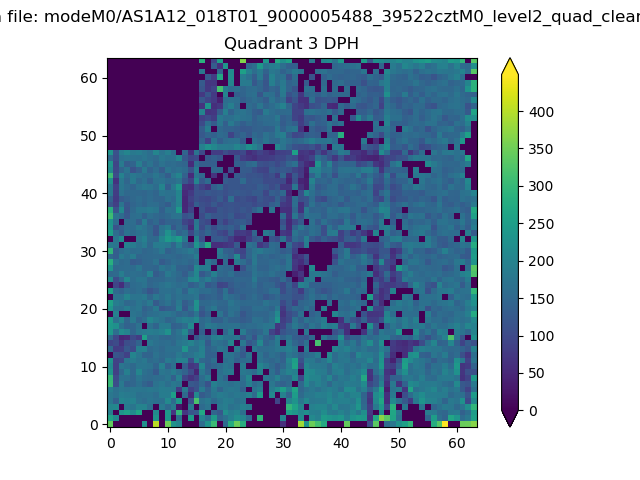 |
 |
Quadrant C |
| Plot type | Count rate plots | Images |
|---|---|---|
| Comparison with Poisson distribution Blue bars denote a histogram of data divided into 1 sec bins. Red curve is a Poisson curve with rate = median count rate of data. |
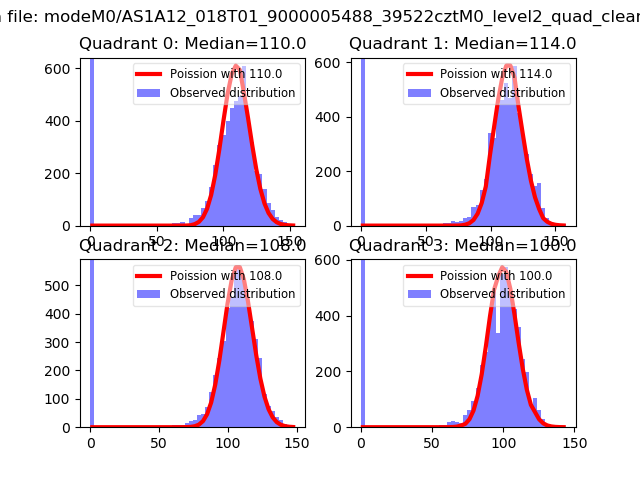 |
 |
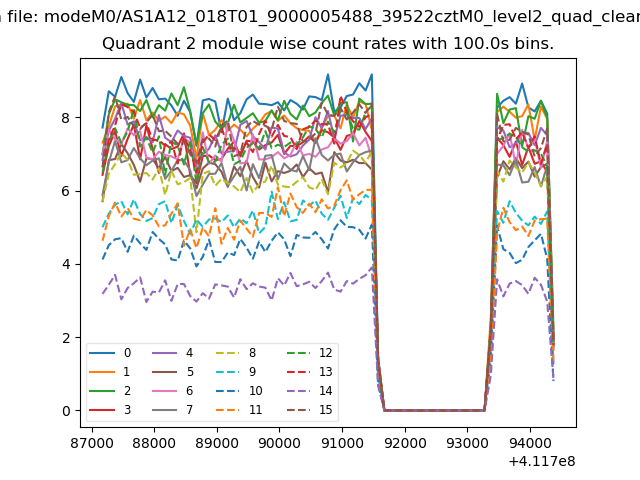
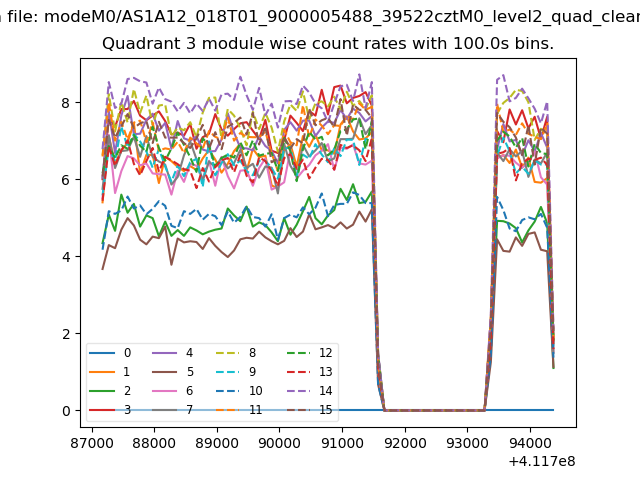
| Quadrant-wise count rates Data is divided into 100 sec bins |
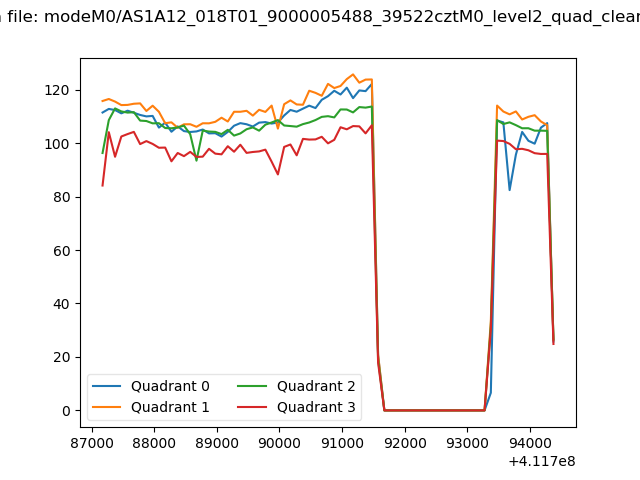 |
|
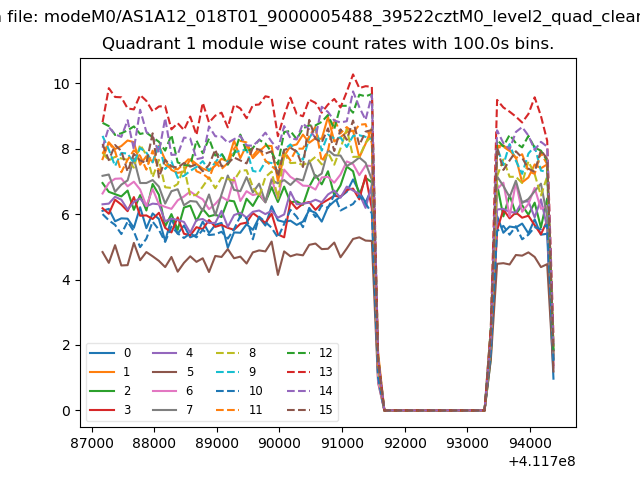
| Module-wise count rates for Quadrant A Data is divided into 100 sec bins |
 |
 |
| Module-wise count rates for Quadrant B Data is divided into 100 sec bins |
 |
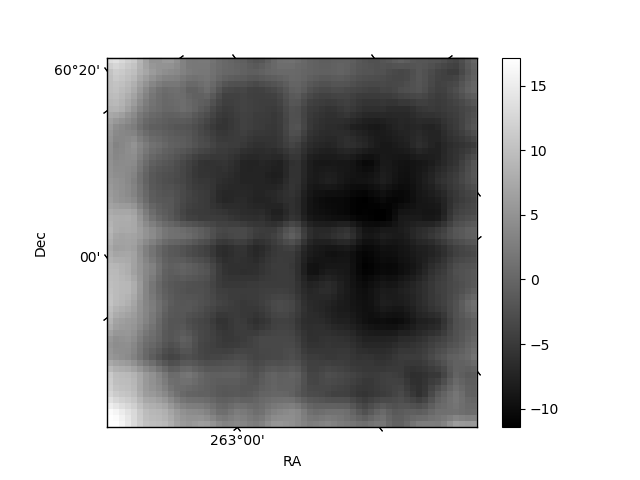 |
| Module-wise count rates for Quadrant C Data is divided into 100 sec bins |
 |
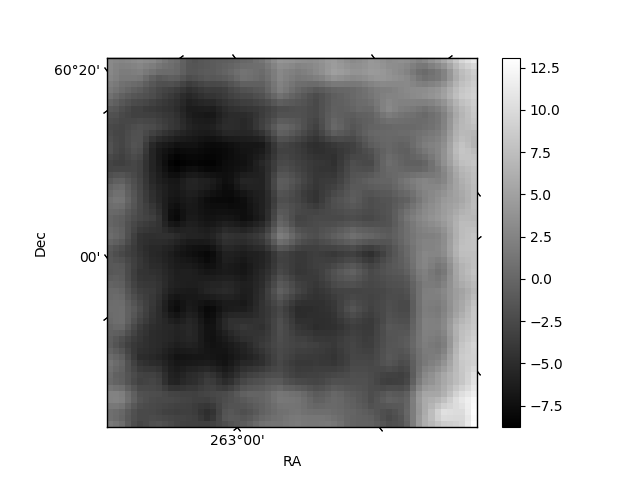 |
| Module-wise count rates for Quadrant D Data is divided into 100 sec bins |
 |
 |
| Parameter | Plot |
|---|---|
| CZT HV Monitor | 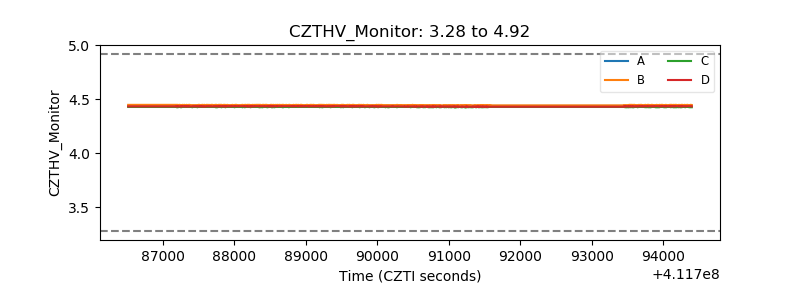 |
| D_VDD | 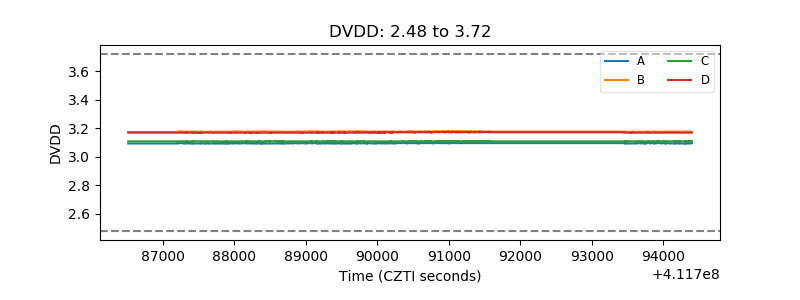 |
| Temperature 1 | 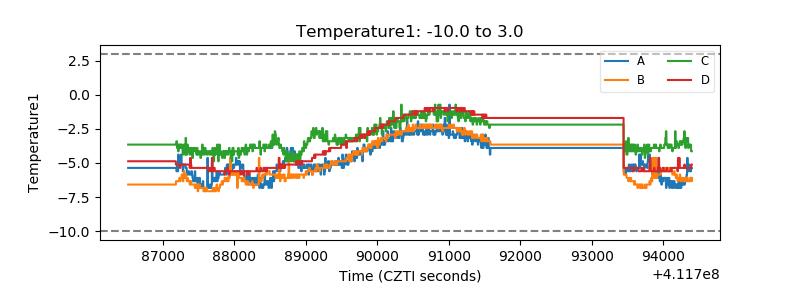 |
| Veto HV Monitor |  |
| Veto LLD | 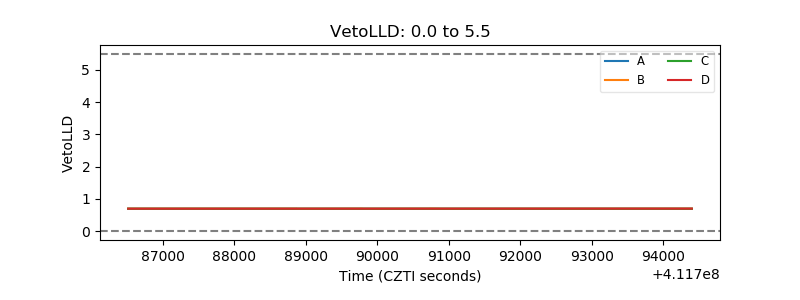 |
| Alpha Counter | 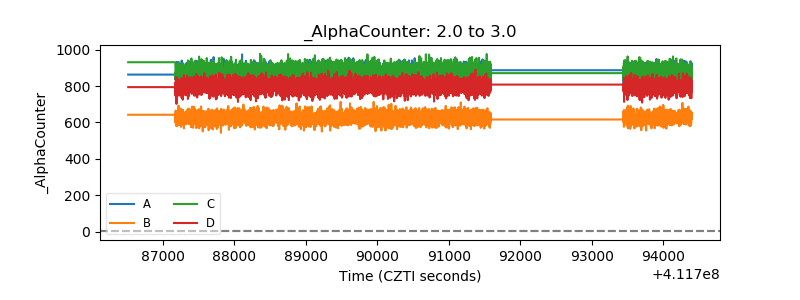 |
| _CPM_Rate | 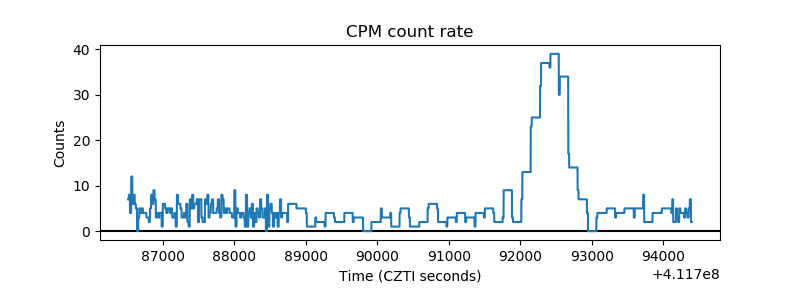 |
| CZT Counter | 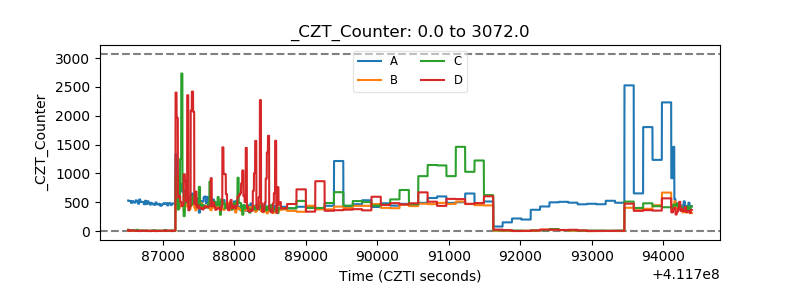 |
| +2.5 Volts monitor | 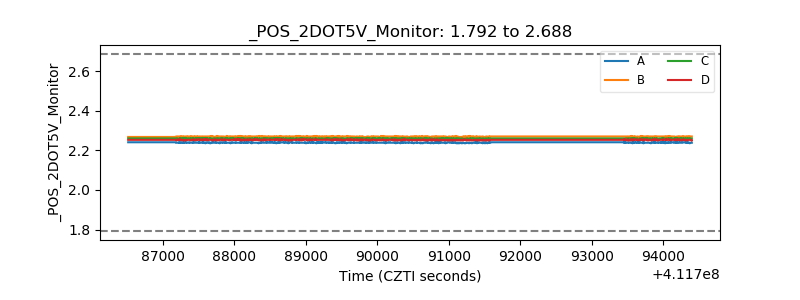 |
| +5 Volts monitor | 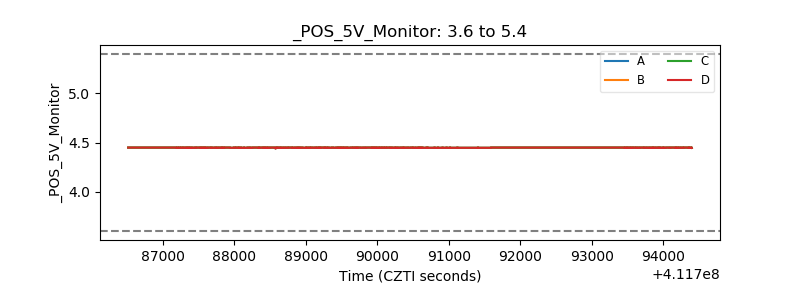 |
| _ROLL_ROT | 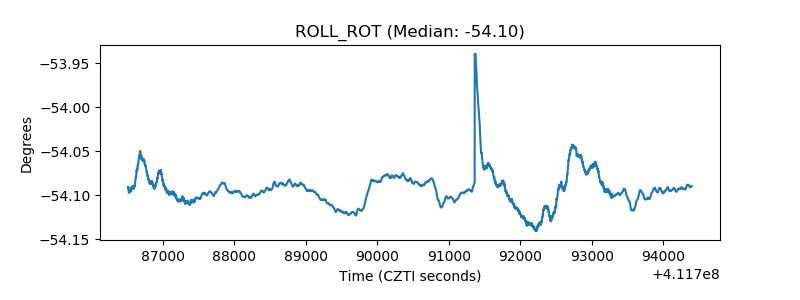 |
| _Roll_DEC |  |
| _Roll_RA | 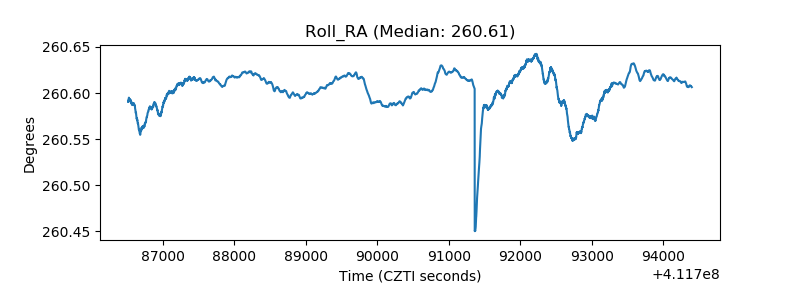 |
| Veto Counter | 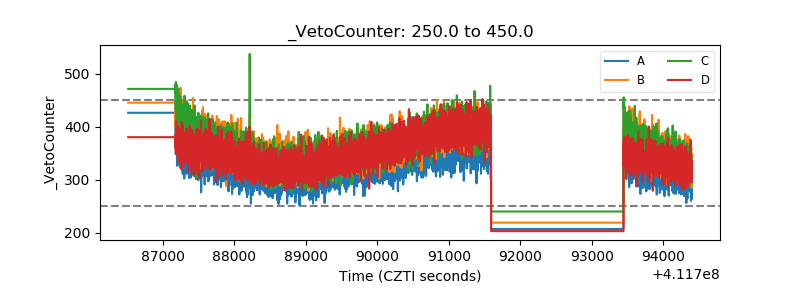 |