| Param | Original file | Final file |
|---|---|---|
| Filename | modeM0/AS1A12_018T01_9000005488_39523cztM0_level2.fits | modeM0/AS1A12_018T01_9000005488_39523cztM0_level2_quad_clean.evt |
| Size (bytes) | 387,817,920 | 87,572,160 |
| Size | 369.9 MB | 83.5 MB |
| Events in quadrant A | 3,913,055 | 583,623 |
| Events in quadrant B | 2,361,070 | 617,286 |
| Events in quadrant C | 5,001,096 | 520,516 |
| Events in quadrant D | 2,648,532 | 542,126 |
| Mode SS | |||
|---|---|---|---|
| Quadrant | BADHDUFLAG | Total packets | Discarded packets |
| A | 0 | 112 | 0 |
| B | 0 | 112 | 0 |
| C | 0 | 112 | 0 |
| D | 0 | 112 | 0 |
| Mode M0 | |||
|---|---|---|---|
| Quadrant | BADHDUFLAG | Total packets | Discarded packets |
| A | 0 | 15023 | 3 |
| B | 0 | 11305 | 2 |
| C | 0 | 18693 | 2 |
| D | 0 | 12134 | 2 |
| Mode M9 | |||
|---|---|---|---|
| Quadrant | BADHDUFLAG | Total packets | Discarded packets |
| A | 0 | 23 | 0 |
| B | 0 | 23 | 0 |
| C | 0 | 23 | 0 |
| D | 0 | 24 | 0 |
| Quadrant | Total seconds | Saturated seconds | Saturation percentage |
|---|---|---|---|
| A | 5548 | 231 | 4.163663% |
| B | 5548 | 27 | 0.486662% |
| C | 5548 | 750 | 13.518385% |
| D | 5548 | 43 | 0.775054% |
Noise dominated data is calculated using 1-second bins in cleaned event files. If a bin has >2000 counts, and if more than 50% of those come from <1% of pixels, then it is considered to be noise-dominated and hence unusable.
| Quadrant | # 1 sec bins | Bins with >0 counts | Bins with >2000 counts | High rate bins dominated by noise | Noise dominated (total time) | Noise dominated (detector-on time) | Marked lightcurve |
|---|---|---|---|---|---|---|---|
| A | 7071 | 5549 | 196 | 196 | 2.77% | 3.53% | 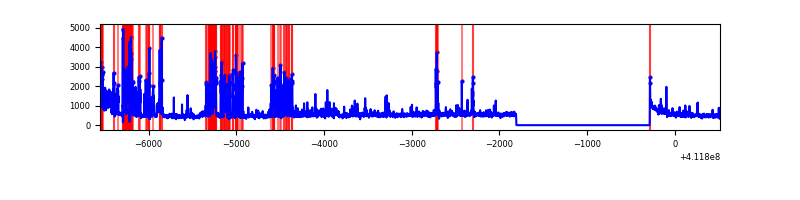 |
| B | 7071 | 5549 | 13 | 13 | 0.18% | 0.23% | 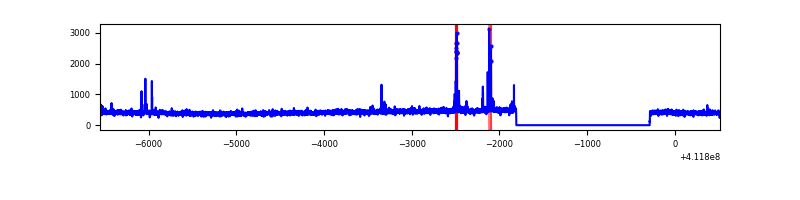 |
| C | 7071 | 5549 | 698 | 698 | 9.87% | 12.58% | 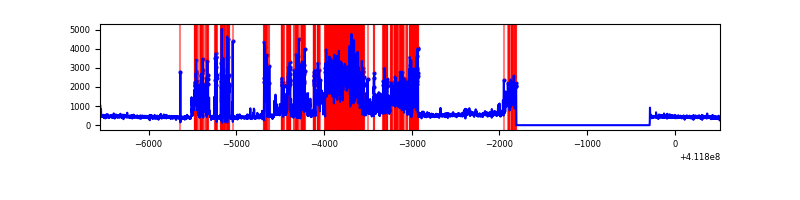 |
| D | 7071 | 5549 | 30 | 30 | 0.42% | 0.54% | 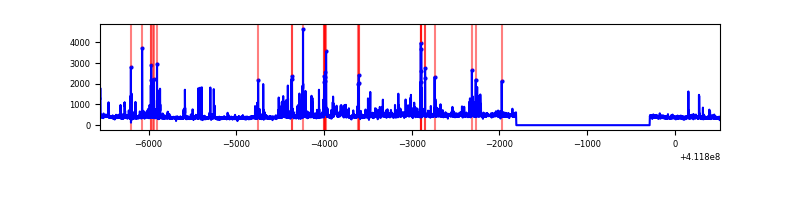 |
Top three noisy pixels from each quadrant. If the there are fewer than three noisy pixels in the level2.evt file, extra rows are filled as -1
| Pixel properties | Quadrant properties | ||||||
|---|---|---|---|---|---|---|---|
| Quadrant | DetID | PixID | Counts | Sigma | Mean | Median | Sigma |
| A | 6 | 10 | 741816 | 6283.83 | 577 | 564 | 118.0 |
| A | 15 | 222 | 467163 | 3955.51 | 577 | 564 | 118.0 |
| A | 10 | 83 | 431865 | 3656.28 | 577 | 564 | 118.0 |
| B | 15 | 85 | 58412 | 517.36 | 581 | 565 | 111.8 |
| B | 5 | 255 | 16303 | 140.75 | 581 | 565 | 111.8 |
| B | 12 | 111 | 14198 | 121.93 | 581 | 565 | 111.8 |
| C | 9 | 187 | 2449168 | 19618.94 | 538 | 542 | 124.8 |
| C | 15 | 214 | 223680 | 1787.83 | 538 | 542 | 124.8 |
| C | 15 | 208 | 217707 | 1739.97 | 538 | 542 | 124.8 |
| D | 13 | 249 | 131479 | 953.06 | 566 | 548 | 137.4 |
| D | 2 | 249 | 122633 | 888.67 | 566 | 548 | 137.4 |
| D | 12 | 227 | 75166 | 543.15 | 566 | 548 | 137.4 |
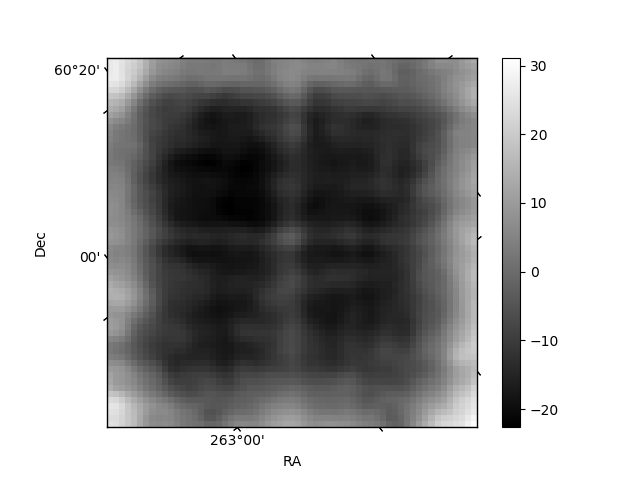
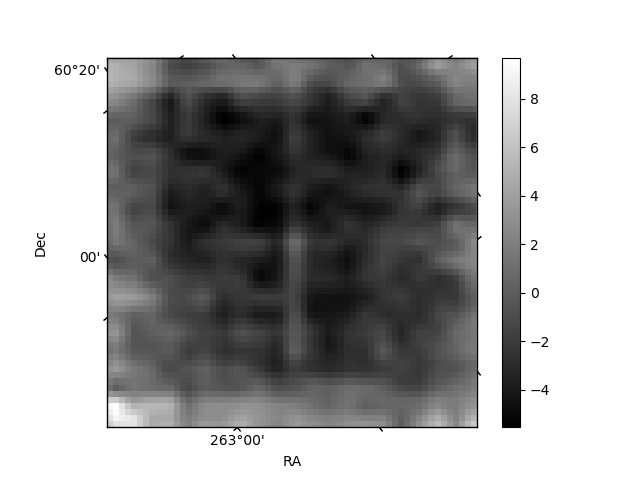
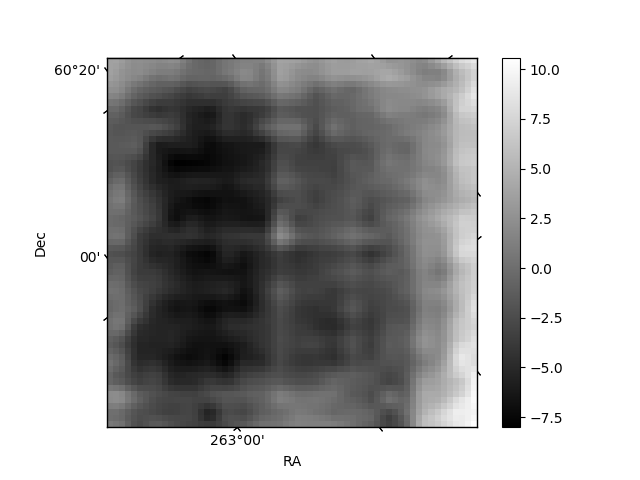
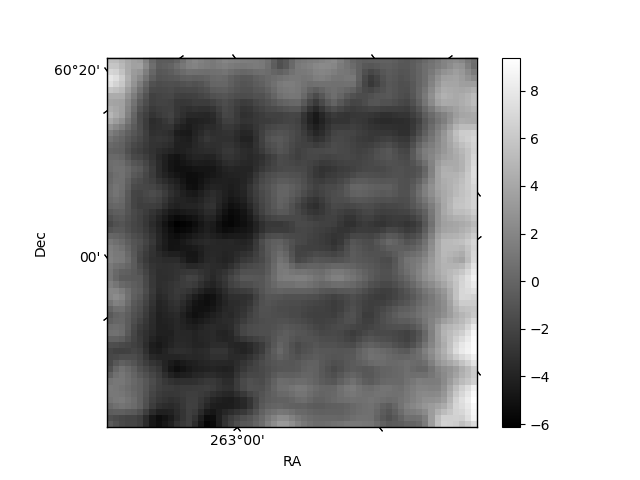
Histogram calculated using DETX and DETY for each event in the final _common_clean file
| Quadrant A | 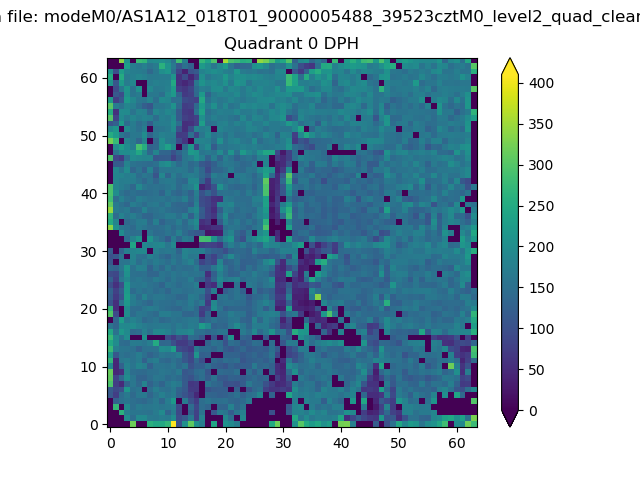 |
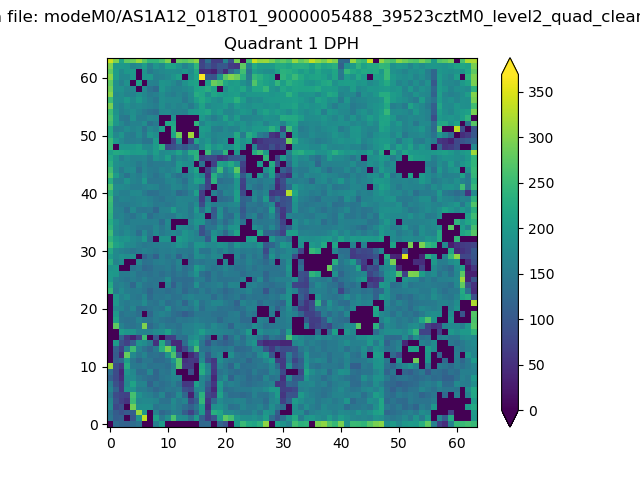 |
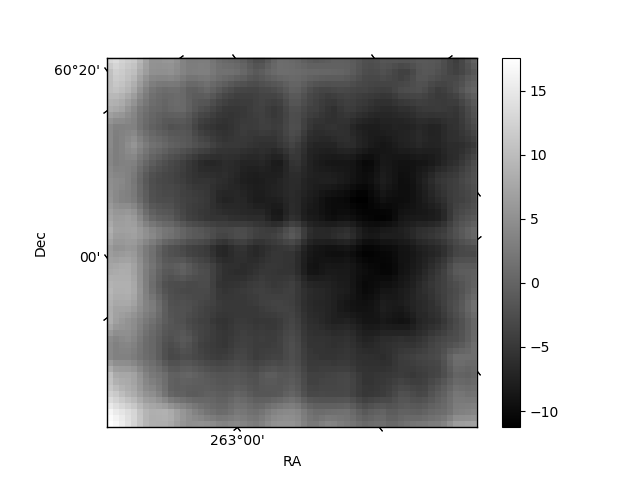
Quadrant B |
|---|---|---|---|
| Quadrant D | 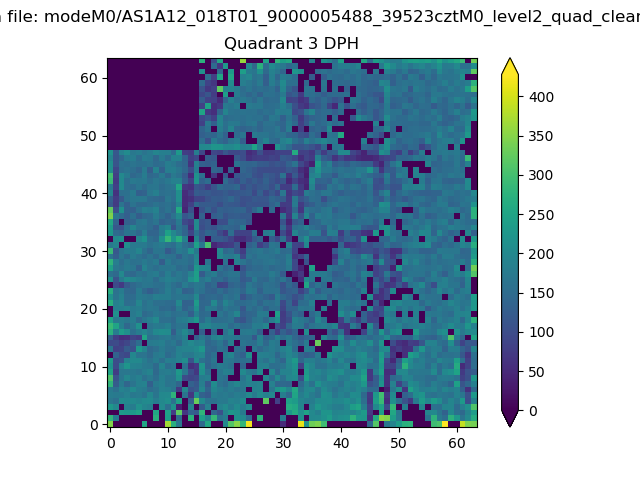 |
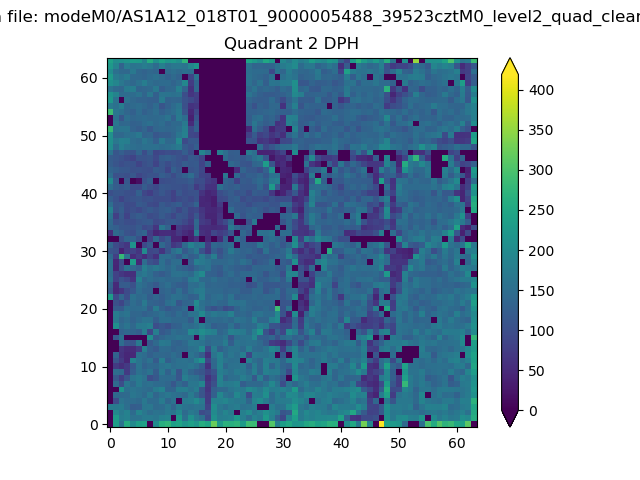 |
Quadrant C |
| Plot type | Count rate plots | Images |
|---|---|---|
| Comparison with Poisson distribution Blue bars denote a histogram of data divided into 1 sec bins. Red curve is a Poisson curve with rate = median count rate of data. |
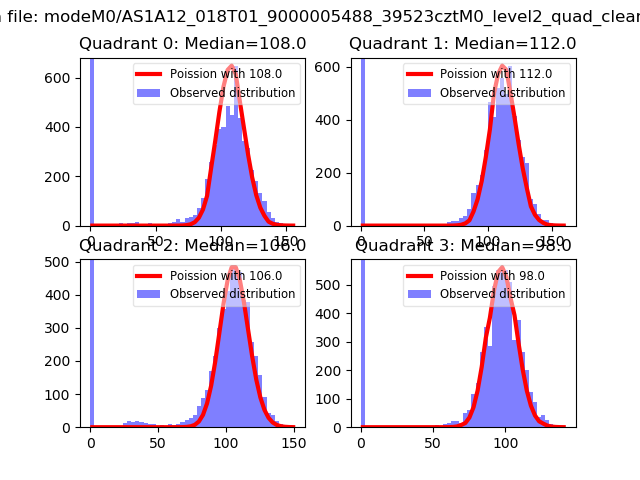 |
 |
| Quadrant-wise count rates Data is divided into 100 sec bins |
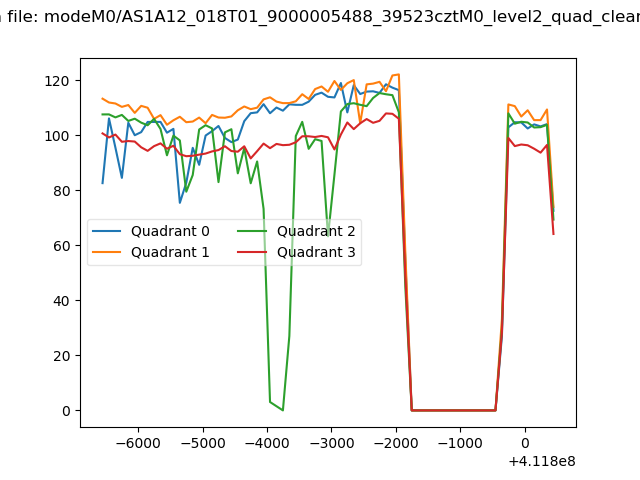 |
|
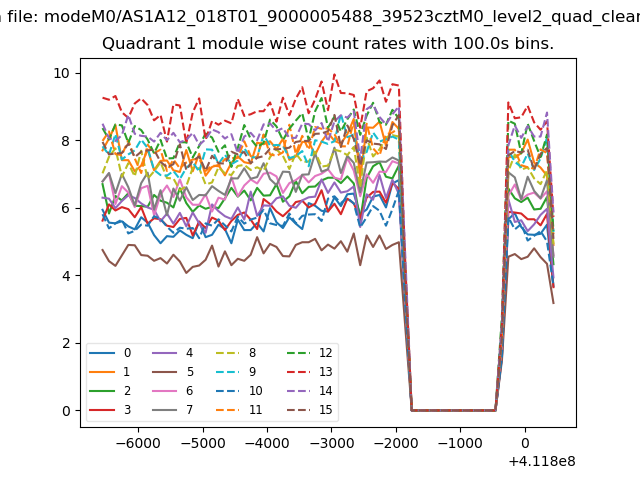
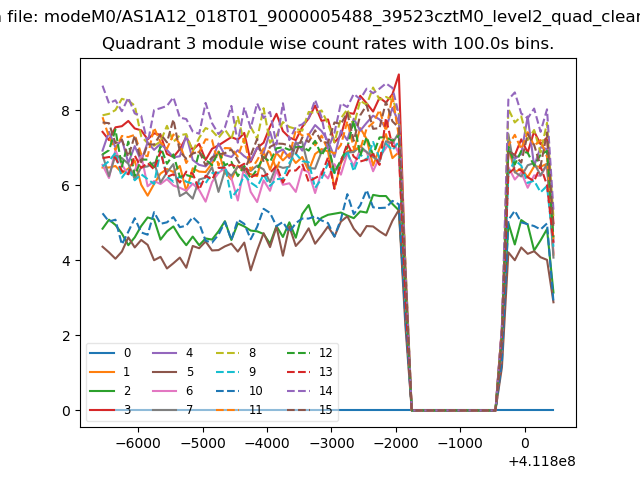
| Module-wise count rates for Quadrant A Data is divided into 100 sec bins |
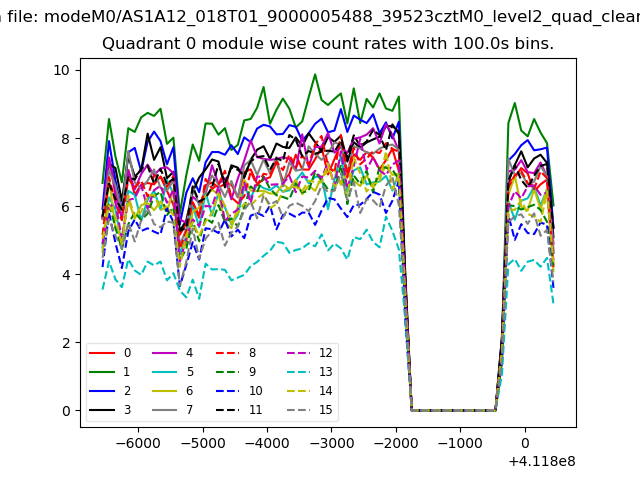 |
 |
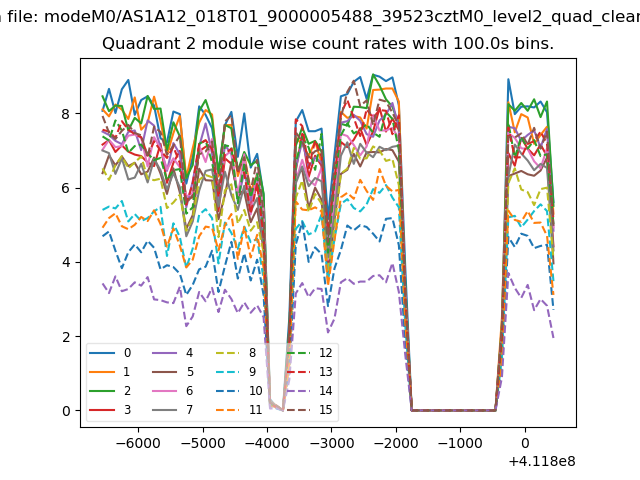
| Module-wise count rates for Quadrant B Data is divided into 100 sec bins |
 |
 |
| Module-wise count rates for Quadrant C Data is divided into 100 sec bins |
 |
 |
| Module-wise count rates for Quadrant D Data is divided into 100 sec bins |
 |
 |
| Parameter | Plot |
|---|---|
| CZT HV Monitor | 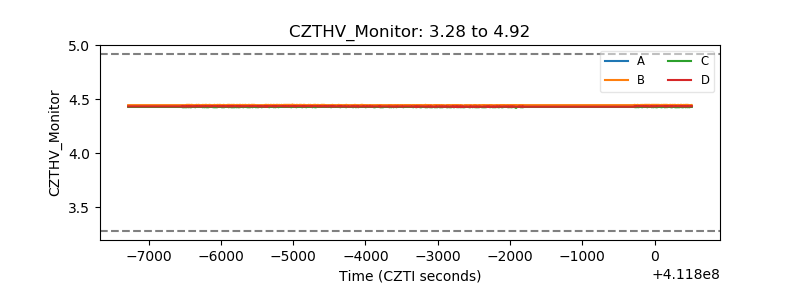 |
| D_VDD | 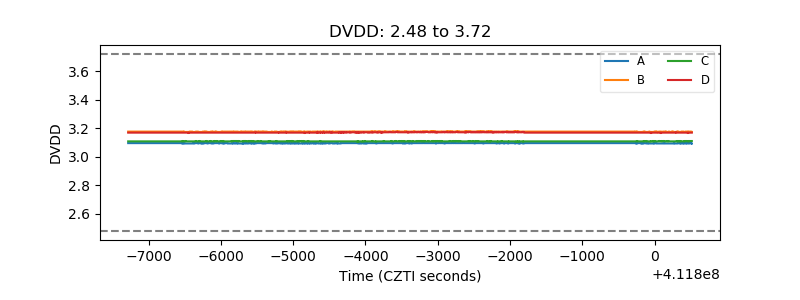 |
| Temperature 1 | 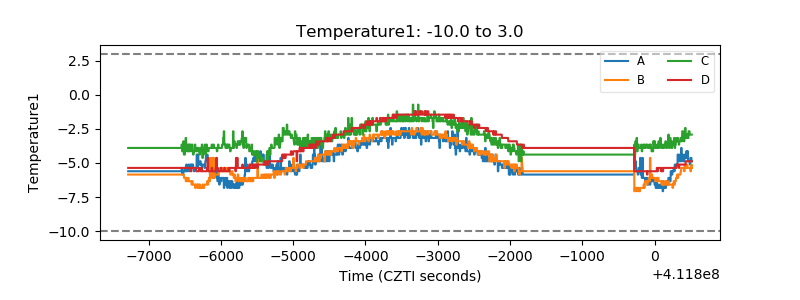 |
| Veto HV Monitor |  |
| Veto LLD | 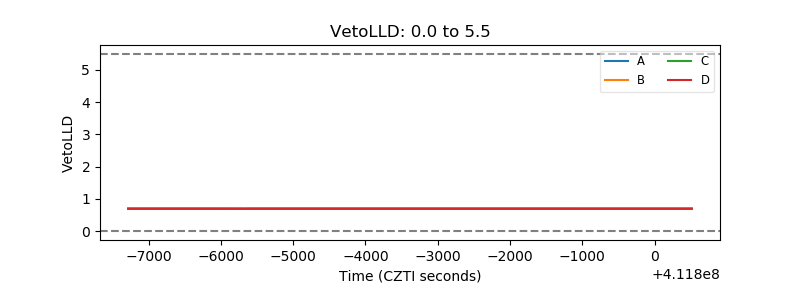 |
| Alpha Counter | 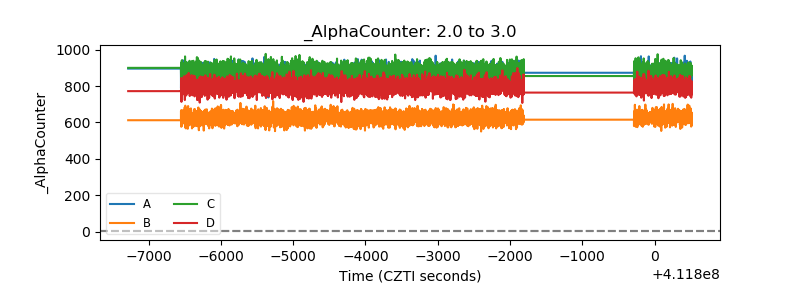 |
| _CPM_Rate | 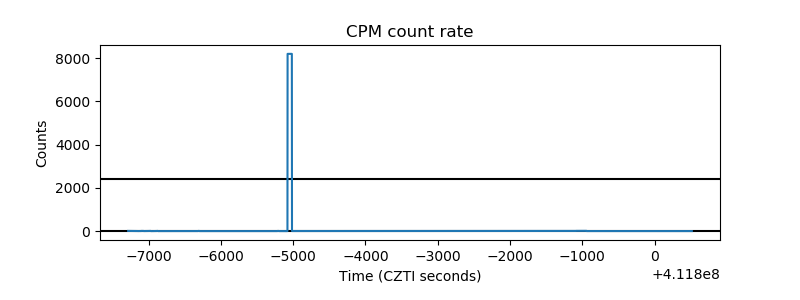 |
| CZT Counter | 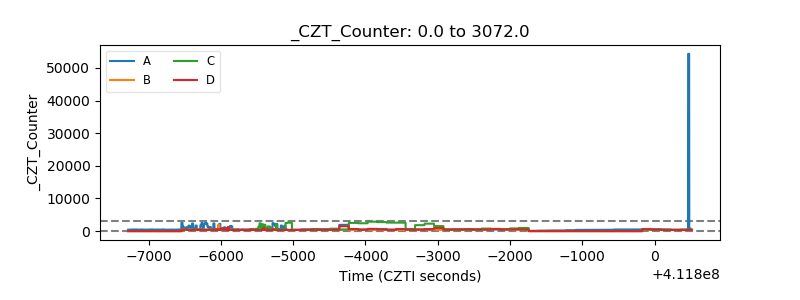 |
| +2.5 Volts monitor | 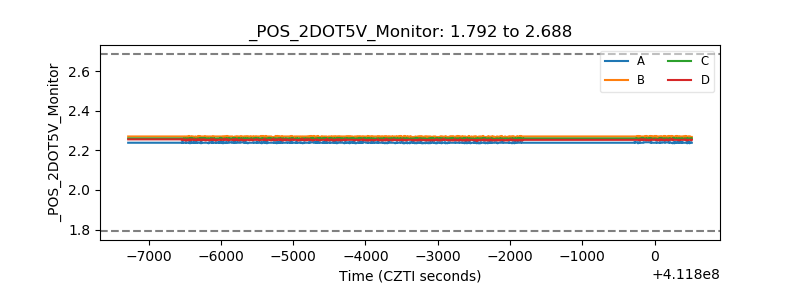 |
| +5 Volts monitor | 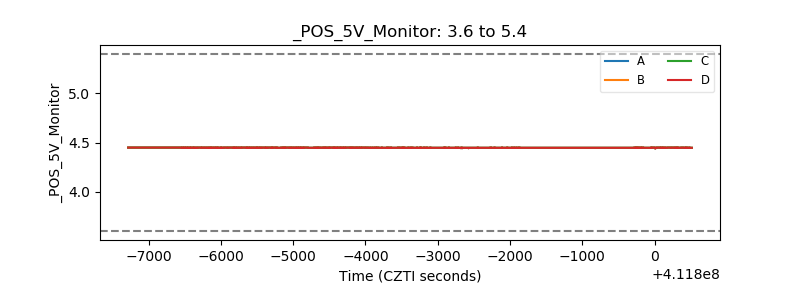 |
| _ROLL_ROT | 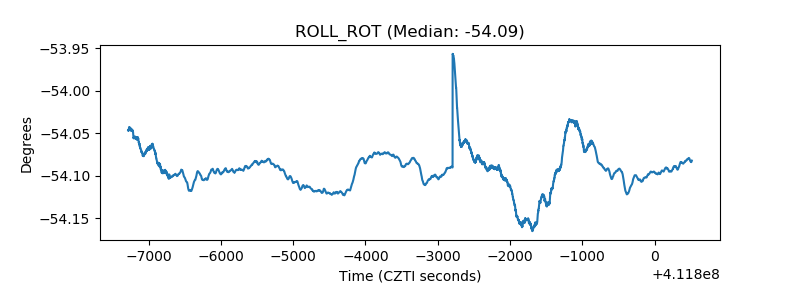 |
| _Roll_DEC | 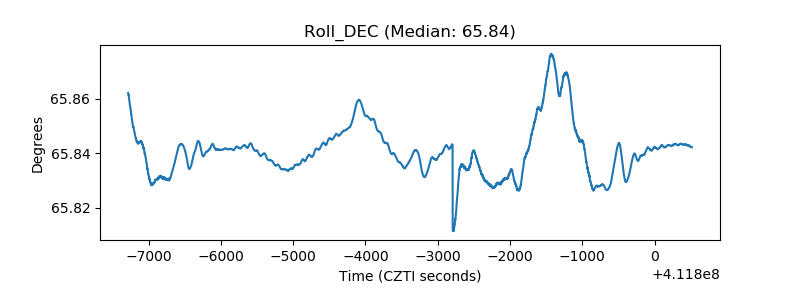 |
| _Roll_RA | 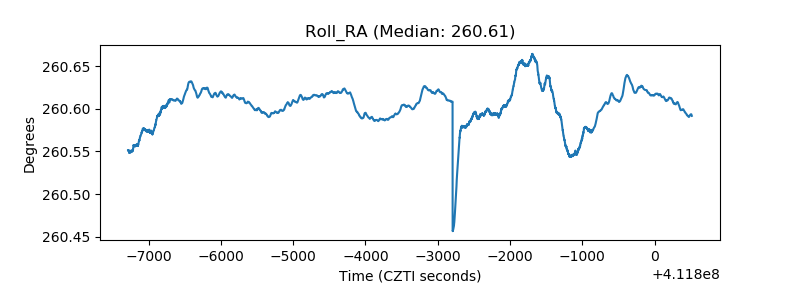 |
| Veto Counter | 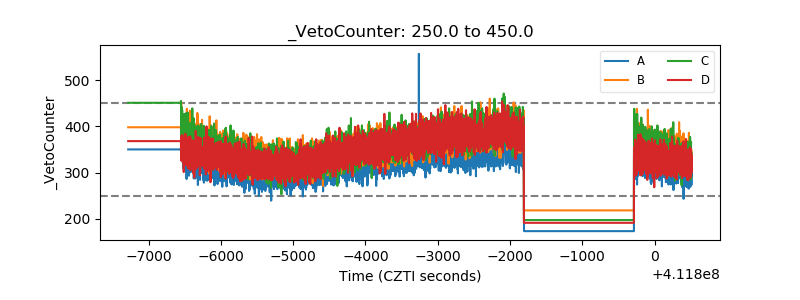 |