| Param | Original file | Final file |
|---|---|---|
| Filename | modeM0/AS1A12_018T01_9000005488_39524cztM0_level2.fits | modeM0/AS1A12_018T01_9000005488_39524cztM0_level2_quad_clean.evt |
| Size (bytes) | 423,576,000 | 92,698,560 |
| Size | 404.0 MB | 88.4 MB |
| Events in quadrant A | 3,351,787 | 635,891 |
| Events in quadrant B | 2,662,678 | 658,736 |
| Events in quadrant C | 6,358,673 | 527,051 |
| Events in quadrant D | 2,844,371 | 570,471 |
| Mode SS | |||
|---|---|---|---|
| Quadrant | BADHDUFLAG | Total packets | Discarded packets |
| A | 0 | 122 | 0 |
| B | 0 | 122 | 0 |
| C | 0 | 122 | 0 |
| D | 0 | 122 | 0 |
| Mode M0 | |||
|---|---|---|---|
| Quadrant | BADHDUFLAG | Total packets | Discarded packets |
| A | 0 | 13653 | 3 |
| B | 0 | 12364 | 2 |
| C | 0 | 22994 | 2 |
| D | 0 | 12971 | 2 |
| Mode M9 | |||
|---|---|---|---|
| Quadrant | BADHDUFLAG | Total packets | Discarded packets |
| A | 0 | 29 | 0 |
| B | 0 | 29 | 0 |
| C | 0 | 29 | 0 |
| D | 0 | 29 | 0 |
| Quadrant | Total seconds | Saturated seconds | Saturation percentage |
|---|---|---|---|
| A | 5935 | 56 | 0.943555% |
| B | 5935 | 35 | 0.589722% |
| C | 5935 | 1064 | 17.927548% |
| D | 5935 | 98 | 1.651222% |
Noise dominated data is calculated using 1-second bins in cleaned event files. If a bin has >2000 counts, and if more than 50% of those come from <1% of pixels, then it is considered to be noise-dominated and hence unusable.
| Quadrant | # 1 sec bins | Bins with >0 counts | Bins with >2000 counts | High rate bins dominated by noise | Noise dominated (total time) | Noise dominated (detector-on time) | Marked lightcurve |
|---|---|---|---|---|---|---|---|
| A | 8771 | 5937 | 41 | 41 | 0.47% | 0.69% | 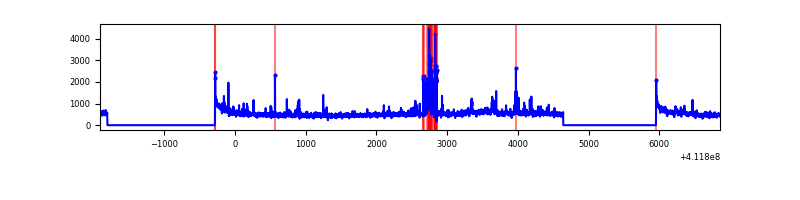 |
| B | 8771 | 5937 | 26 | 26 | 0.30% | 0.44% | 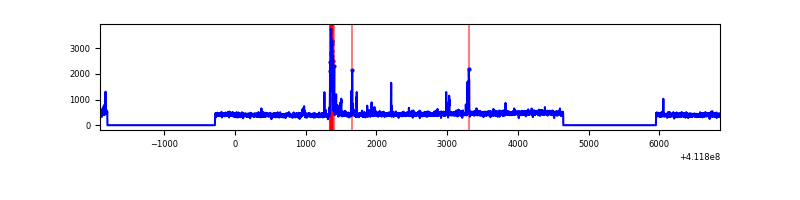 |
| C | 8771 | 5937 | 969 | 969 | 11.05% | 16.32% | 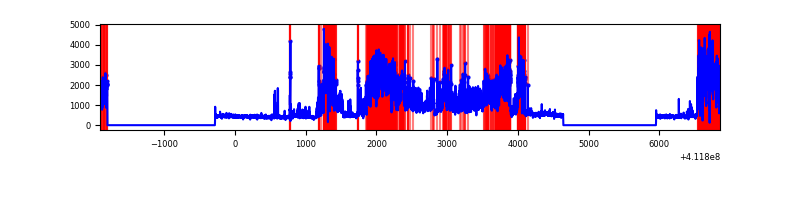 |
| D | 8771 | 5937 | 65 | 65 | 0.74% | 1.09% | 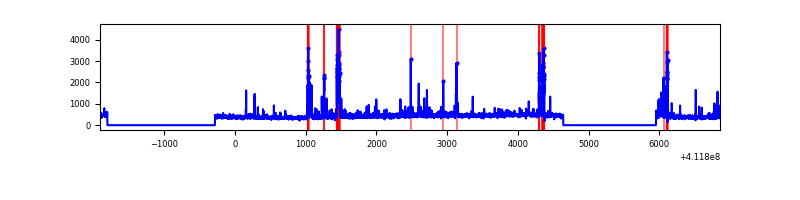 |
Top three noisy pixels from each quadrant. If the there are fewer than three noisy pixels in the level2.evt file, extra rows are filled as -1
| Pixel properties | Quadrant properties | ||||||
|---|---|---|---|---|---|---|---|
| Quadrant | DetID | PixID | Counts | Sigma | Mean | Median | Sigma |
| A | 10 | 83 | 462462 | 3606.25 | 627 | 615 | 128.1 |
| A | 15 | 222 | 273814 | 2133.22 | 627 | 615 | 128.1 |
| A | 15 | 174 | 142017 | 1104.11 | 627 | 615 | 128.1 |
| B | 5 | 255 | 164956 | 1356.07 | 625 | 606 | 121.2 |
| B | 15 | 85 | 34447 | 279.23 | 625 | 606 | 121.2 |
| B | 12 | 111 | 15274 | 121.03 | 625 | 606 | 121.2 |
| C | 9 | 187 | 3851981 | 29016.08 | 570 | 572 | 132.7 |
| C | 15 | 214 | 234281 | 1760.74 | 570 | 572 | 132.7 |
| C | 15 | 208 | 37850 | 280.85 | 570 | 572 | 132.7 |
| D | 2 | 249 | 226855 | 1522.63 | 608 | 589 | 148.6 |
| D | 13 | 249 | 158052 | 1059.63 | 608 | 589 | 148.6 |
| D | 12 | 227 | 69073 | 460.85 | 608 | 589 | 148.6 |
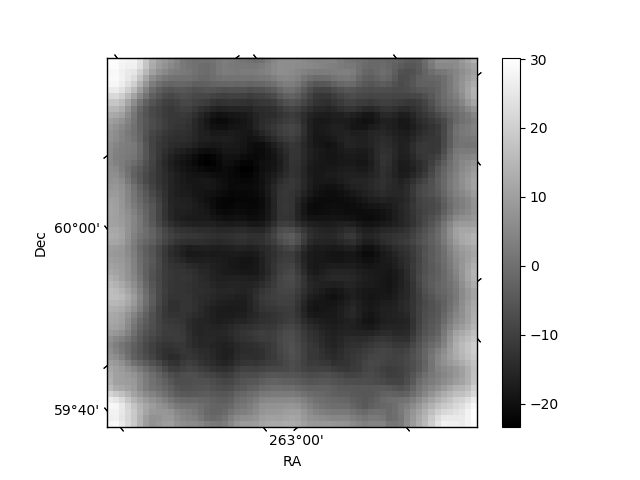
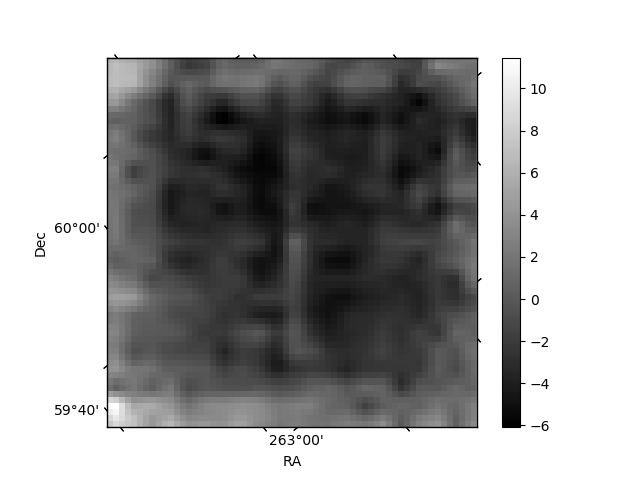
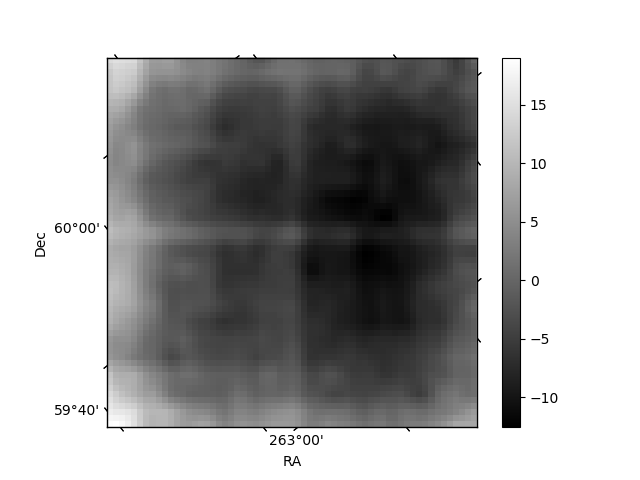
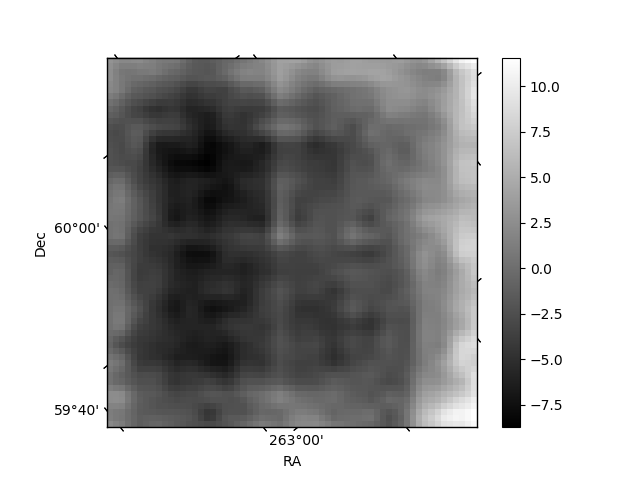
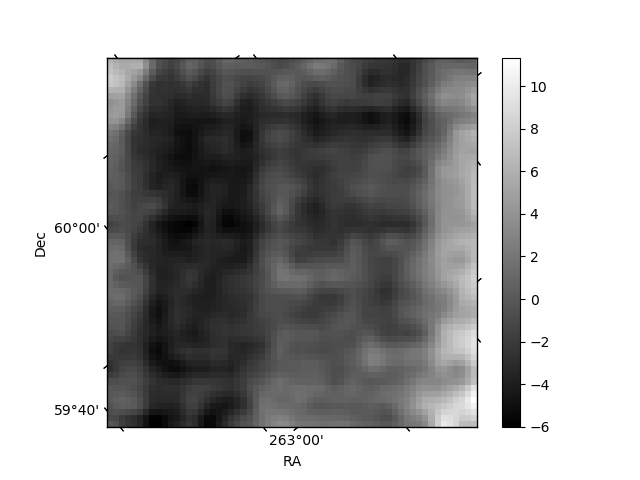
Histogram calculated using DETX and DETY for each event in the final _common_clean file
| Quadrant A | 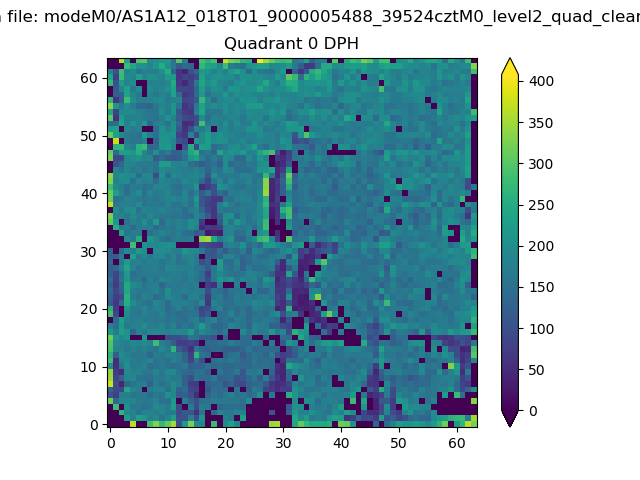 |
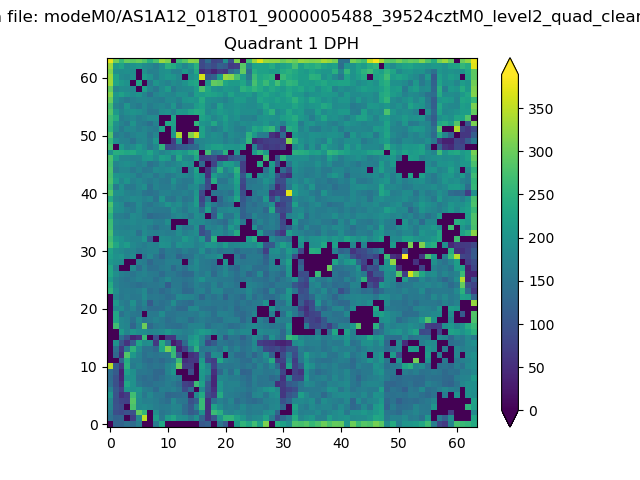 |
Quadrant B |
|---|---|---|---|
| Quadrant D | 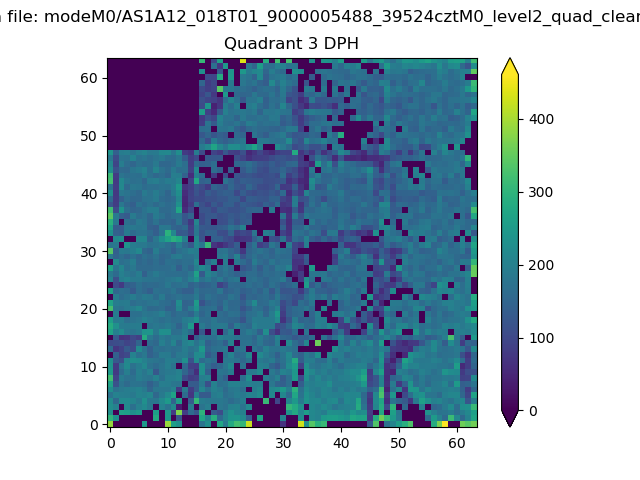 |
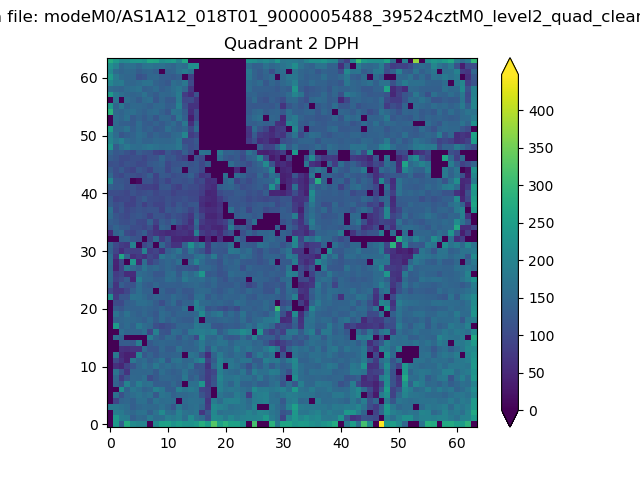 |
Quadrant C |
| Plot type | Count rate plots | Images |
|---|---|---|
| Comparison with Poisson distribution Blue bars denote a histogram of data divided into 1 sec bins. Red curve is a Poisson curve with rate = median count rate of data. |
 |
 |
| Quadrant-wise count rates Data is divided into 100 sec bins |
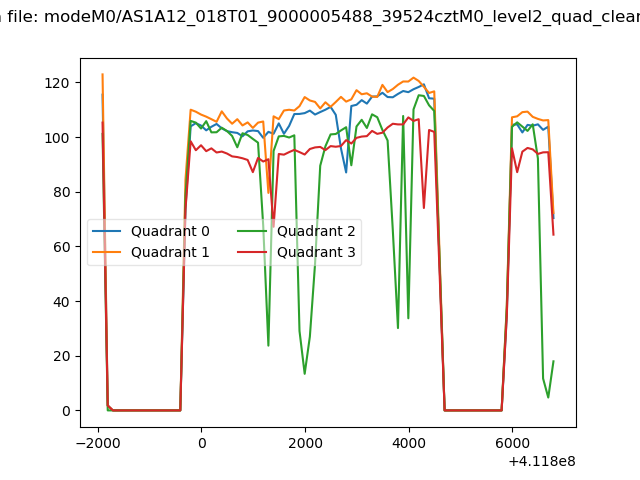 |
|
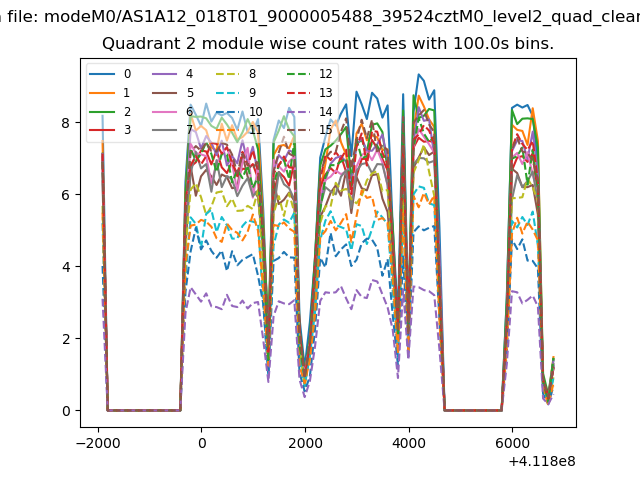
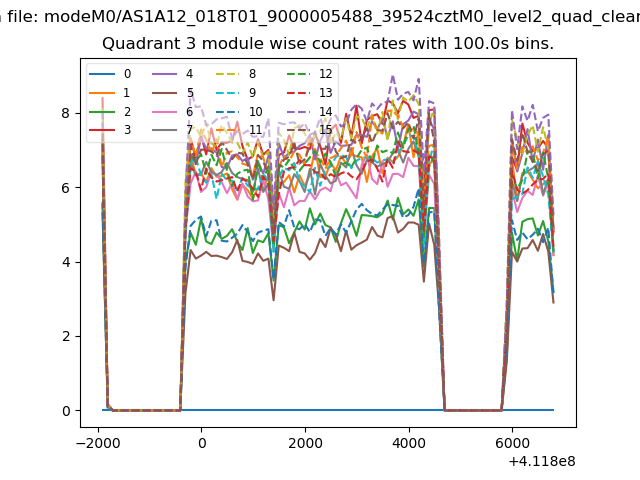
| Module-wise count rates for Quadrant A Data is divided into 100 sec bins |
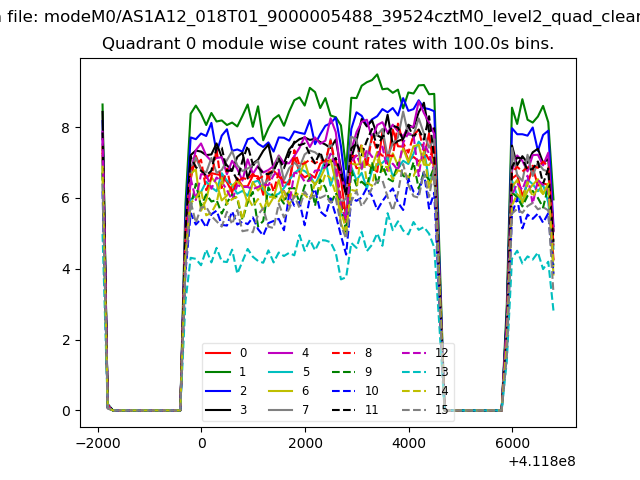 |
 |
| Module-wise count rates for Quadrant B Data is divided into 100 sec bins |
 |
 |
| Module-wise count rates for Quadrant C Data is divided into 100 sec bins |
 |
 |
| Module-wise count rates for Quadrant D Data is divided into 100 sec bins |
 |
 |
| Parameter | Plot |
|---|---|
| CZT HV Monitor | 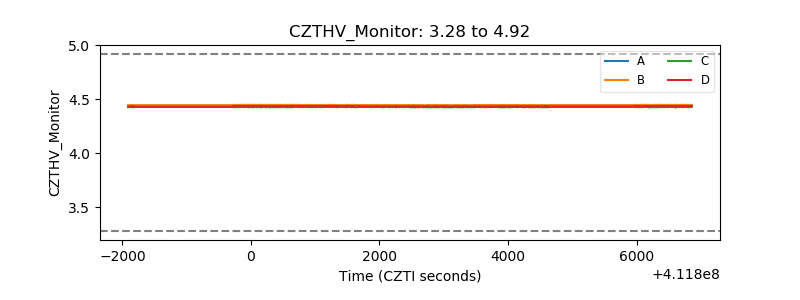 |
| D_VDD | 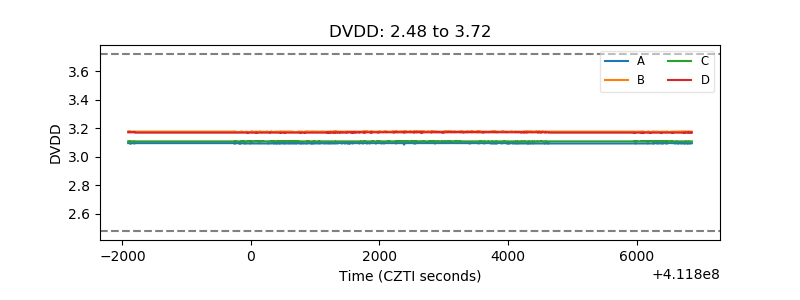 |
| Temperature 1 | 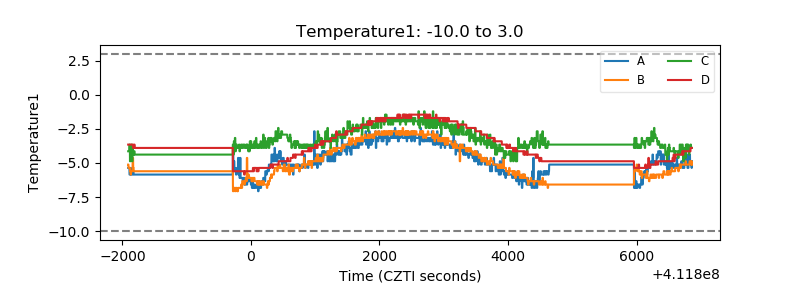 |
| Veto HV Monitor | 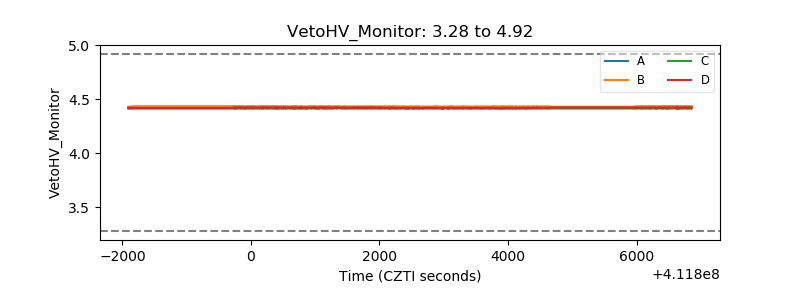 |
| Veto LLD | 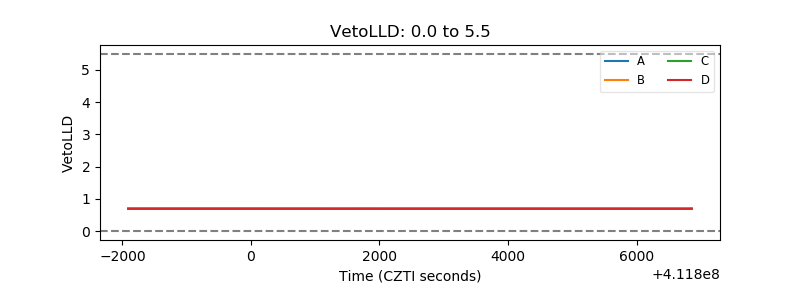 |
| Alpha Counter | 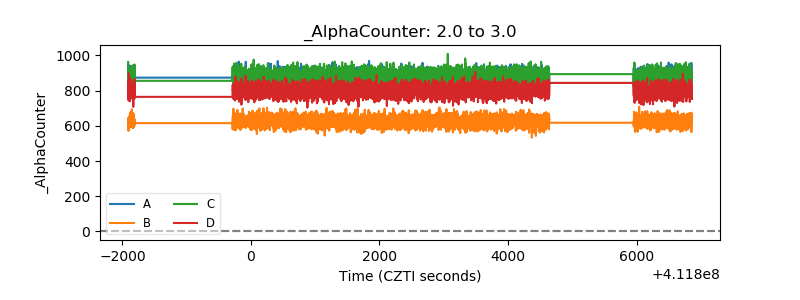 |
| _CPM_Rate |  |
| CZT Counter | 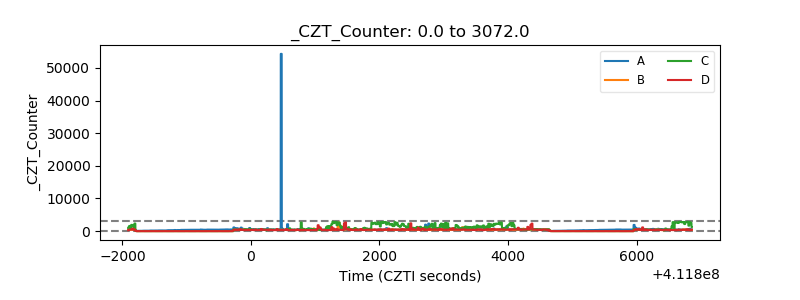 |
| +2.5 Volts monitor | 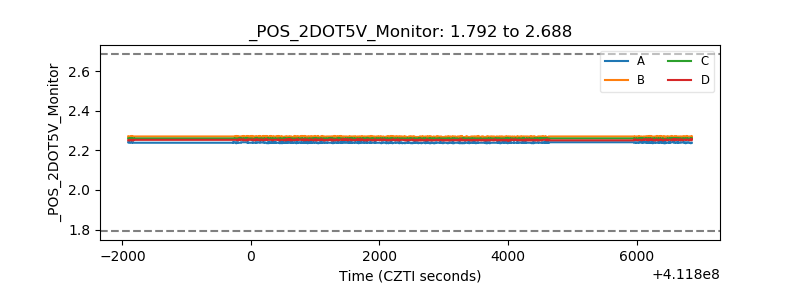 |
| +5 Volts monitor | 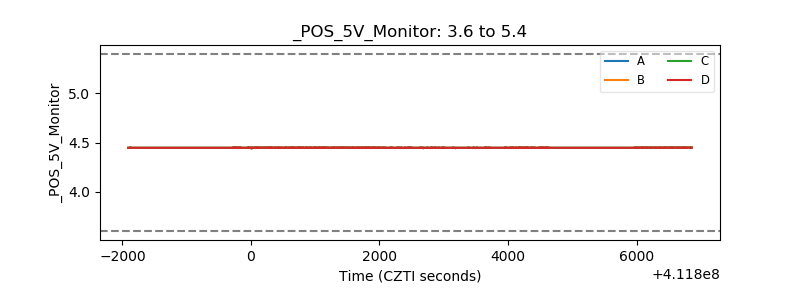 |
| _ROLL_ROT | 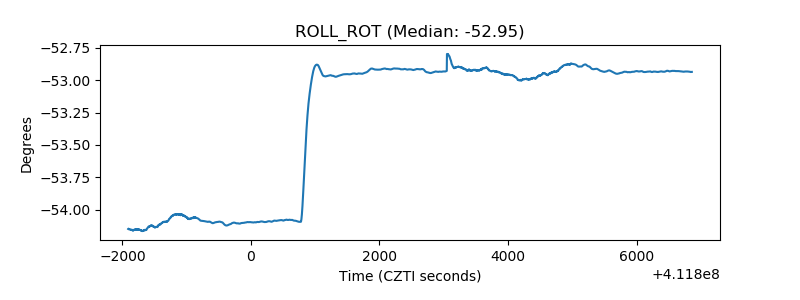 |
| _Roll_DEC | 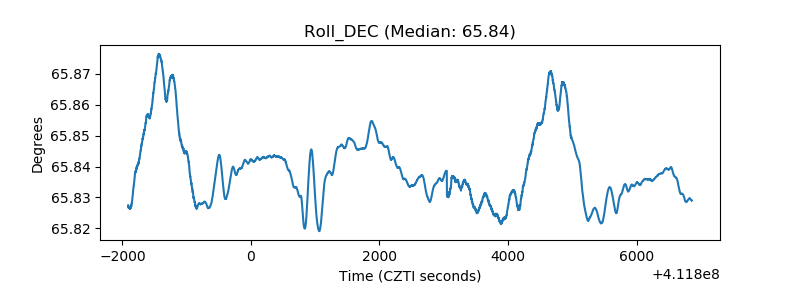 |
| _Roll_RA | 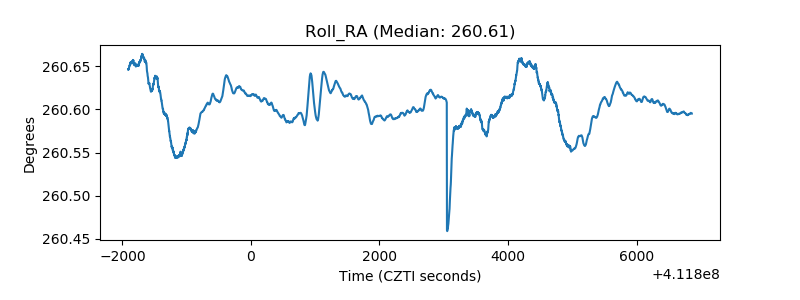 |
| Veto Counter | 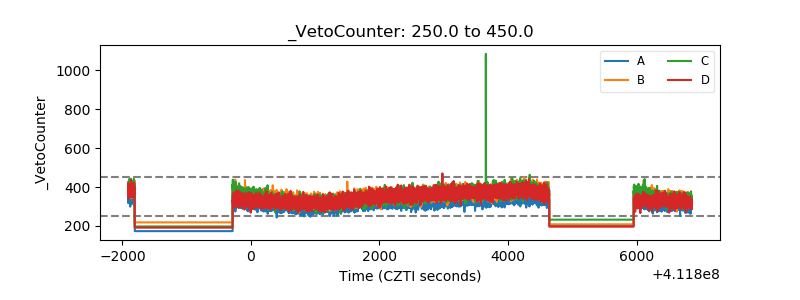 |