| Param | Original file | Final file |
|---|---|---|
| Filename | modeM0/AS1A12_018T01_9000005488_39525cztM0_level2.fits | modeM0/AS1A12_018T01_9000005488_39525cztM0_level2_quad_clean.evt |
| Size (bytes) | 456,960,960 | 92,666,880 |
| Size | 435.8 MB | 88.4 MB |
| Events in quadrant A | 3,328,822 | 645,045 |
| Events in quadrant B | 2,594,225 | 665,609 |
| Events in quadrant C | 7,380,732 | 516,623 |
| Events in quadrant D | 3,144,800 | 559,164 |
| Mode SS | |||
|---|---|---|---|
| Quadrant | BADHDUFLAG | Total packets | Discarded packets |
| A | 0 | 122 | 0 |
| B | 0 | 122 | 0 |
| C | 0 | 122 | 0 |
| D | 0 | 122 | 0 |
| Mode M0 | |||
|---|---|---|---|
| Quadrant | BADHDUFLAG | Total packets | Discarded packets |
| A | 0 | 13931 | 3 |
| B | 0 | 12209 | 2 |
| C | 0 | 25977 | 2 |
| D | 0 | 13889 | 2 |
| Mode M9 | |||
|---|---|---|---|
| Quadrant | BADHDUFLAG | Total packets | Discarded packets |
| A | 0 | 16 | 0 |
| B | 0 | 16 | 0 |
| C | 0 | 16 | 0 |
| D | 0 | 17 | 0 |
| Quadrant | Total seconds | Saturated seconds | Saturation percentage |
|---|---|---|---|
| A | 6001 | 13 | 0.216631% |
| B | 6001 | 12 | 0.199967% |
| C | 6001 | 1225 | 20.413264% |
| D | 6001 | 226 | 3.766039% |
Noise dominated data is calculated using 1-second bins in cleaned event files. If a bin has >2000 counts, and if more than 50% of those come from <1% of pixels, then it is considered to be noise-dominated and hence unusable.
| Quadrant | # 1 sec bins | Bins with >0 counts | Bins with >2000 counts | High rate bins dominated by noise | Noise dominated (total time) | Noise dominated (detector-on time) | Marked lightcurve |
|---|---|---|---|---|---|---|---|
| A | 7283 | 6002 | 4 | 4 | 0.05% | 0.07% | 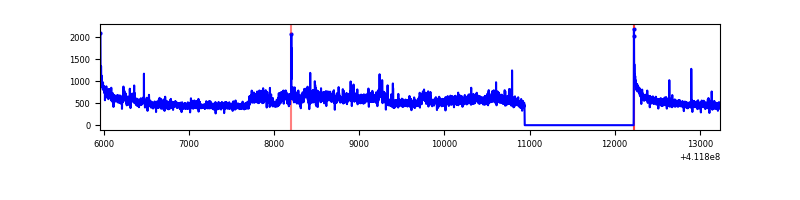 |
| B | 7283 | 6002 | 4 | 4 | 0.05% | 0.07% | 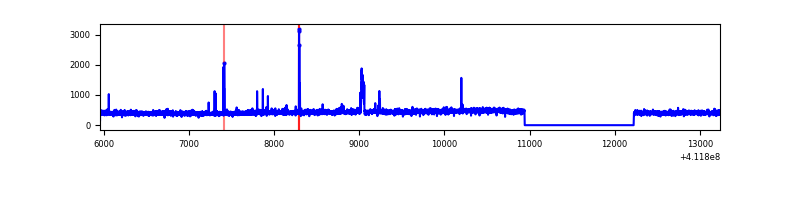 |
| C | 7283 | 6002 | 1231 | 1231 | 16.90% | 20.51% | 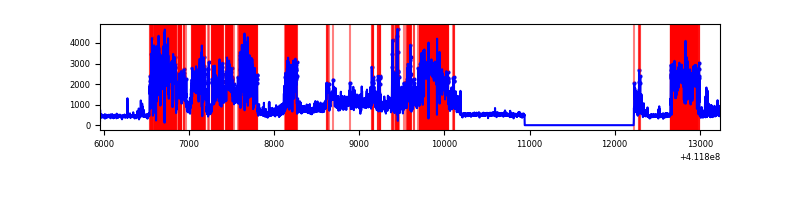 |
| D | 7283 | 6002 | 144 | 144 | 1.98% | 2.40% |  |
Top three noisy pixels from each quadrant. If the there are fewer than three noisy pixels in the level2.evt file, extra rows are filled as -1
| Pixel properties | Quadrant properties | ||||||
|---|---|---|---|---|---|---|---|
| Quadrant | DetID | PixID | Counts | Sigma | Mean | Median | Sigma |
| A | 10 | 83 | 461602 | 3538.11 | 640 | 625 | 130.3 |
| A | 15 | 222 | 375596 | 2877.99 | 640 | 625 | 130.3 |
| A | 13 | 254 | 8730 | 62.21 | 640 | 625 | 130.3 |
| B | 15 | 85 | 41870 | 336.47 | 635 | 615 | 122.6 |
| B | 5 | 255 | 38924 | 312.45 | 635 | 615 | 122.6 |
| B | 12 | 111 | 15944 | 125.02 | 635 | 615 | 122.6 |
| C | 9 | 187 | 4898523 | 36770.26 | 570 | 572 | 133.2 |
| C | 15 | 214 | 232105 | 1738.18 | 570 | 572 | 133.2 |
| C | 15 | 208 | 11134 | 79.29 | 570 | 572 | 133.2 |
| D | 13 | 249 | 592895 | 3923.8 | 608 | 590 | 151.0 |
| D | 2 | 249 | 157667 | 1040.58 | 608 | 590 | 151.0 |
| D | 2 | 234 | 33195 | 216.0 | 608 | 590 | 151.0 |
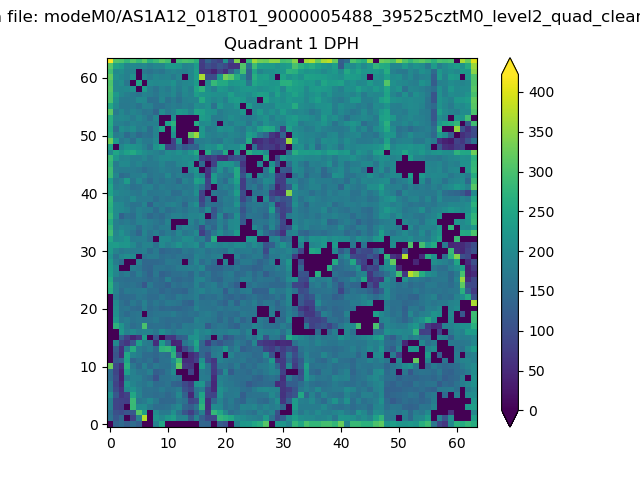
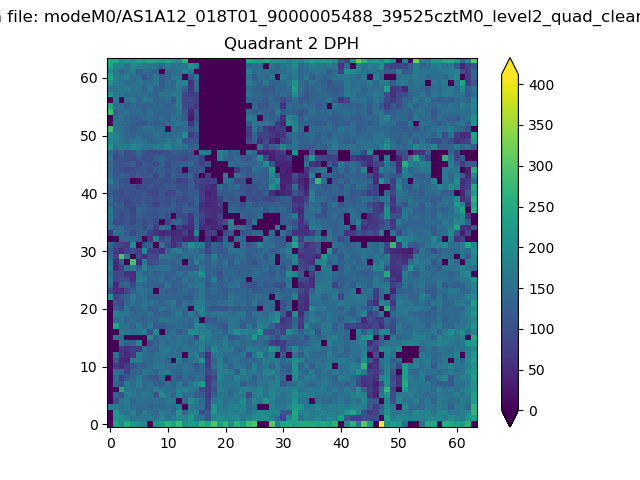
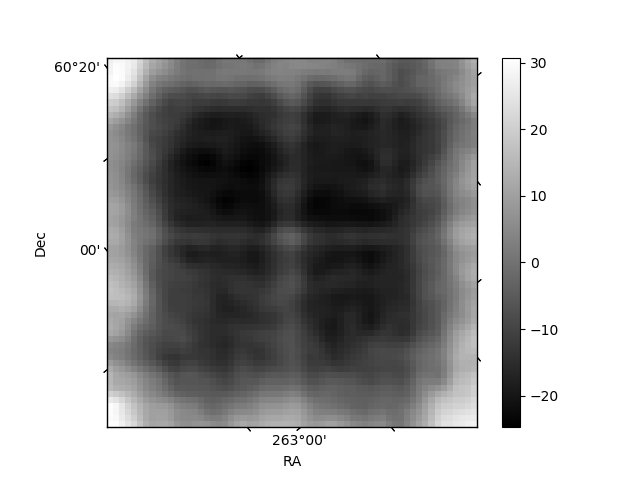
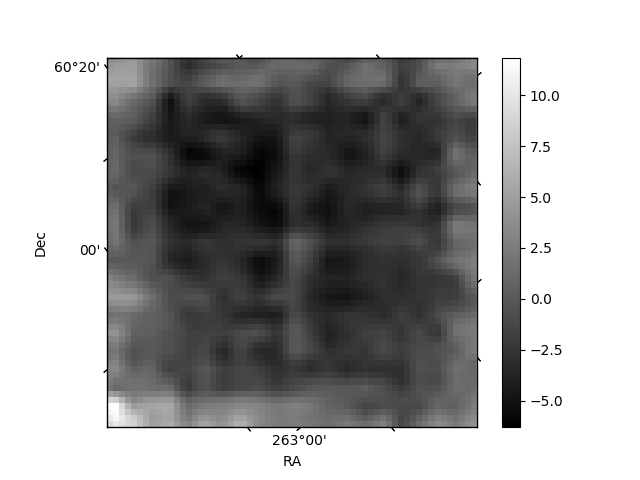
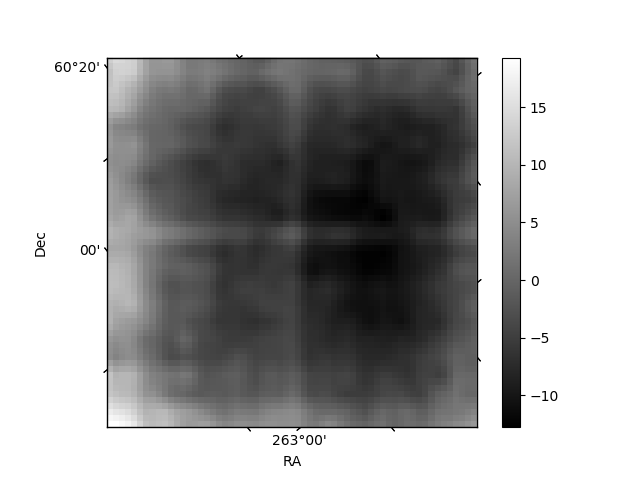
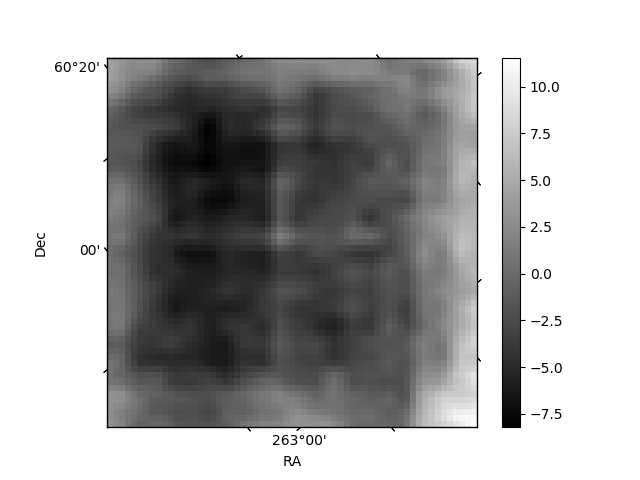
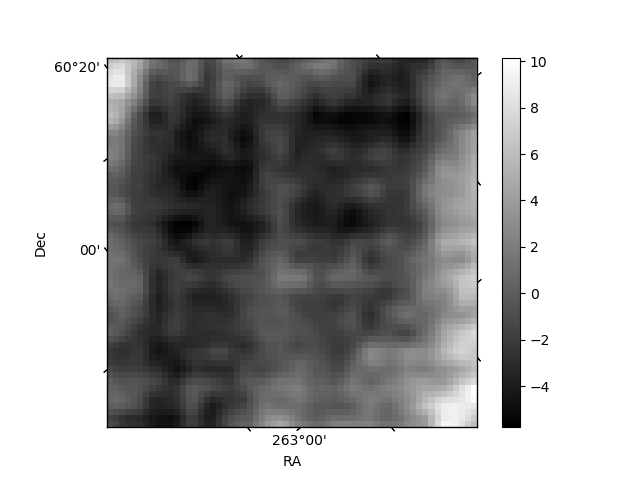
Histogram calculated using DETX and DETY for each event in the final _common_clean file
| Quadrant A | 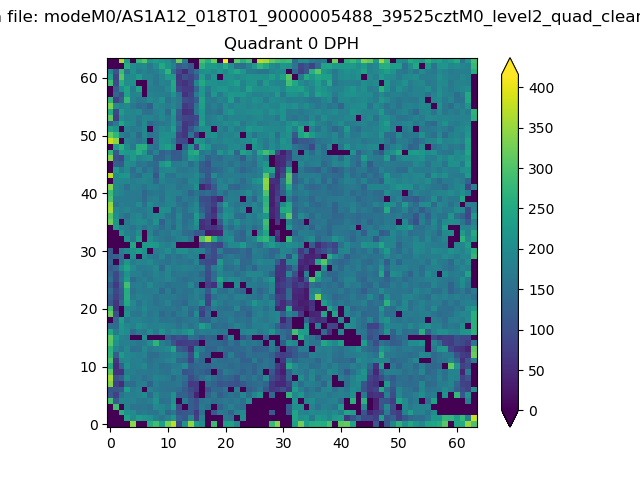 |
 |
Quadrant B |
|---|---|---|---|
| Quadrant D | 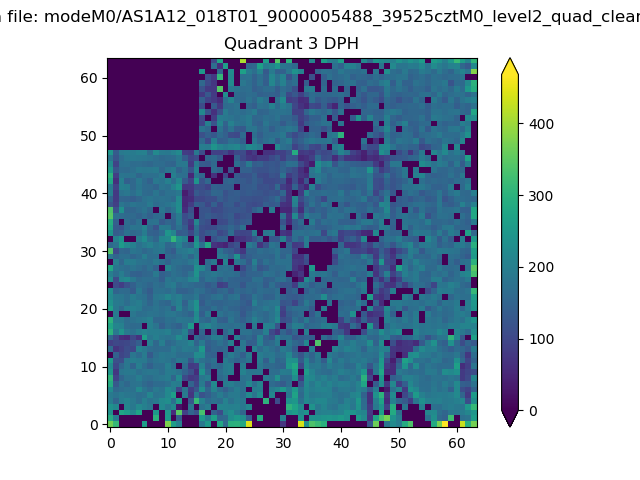 |
 |
Quadrant C |
| Plot type | Count rate plots | Images |
|---|---|---|
| Comparison with Poisson distribution Blue bars denote a histogram of data divided into 1 sec bins. Red curve is a Poisson curve with rate = median count rate of data. |
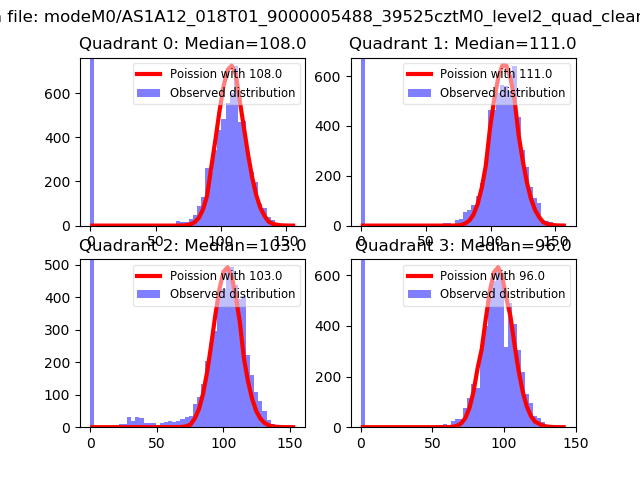 |
 |
| Quadrant-wise count rates Data is divided into 100 sec bins |
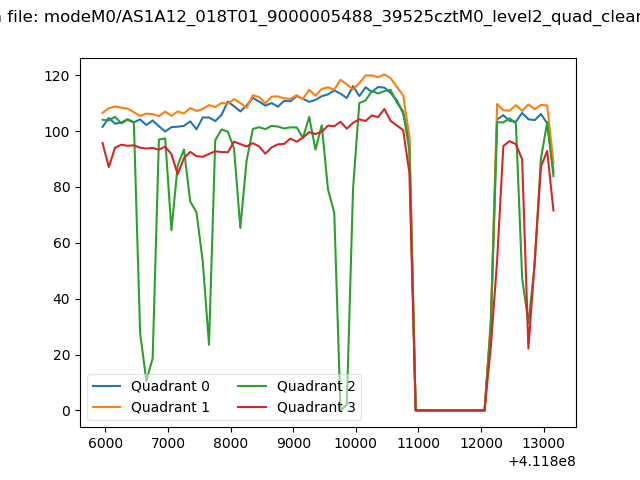 |
|
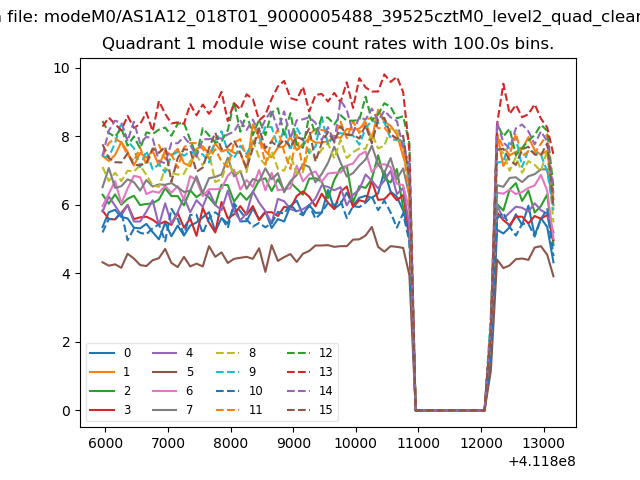
| Module-wise count rates for Quadrant A Data is divided into 100 sec bins |
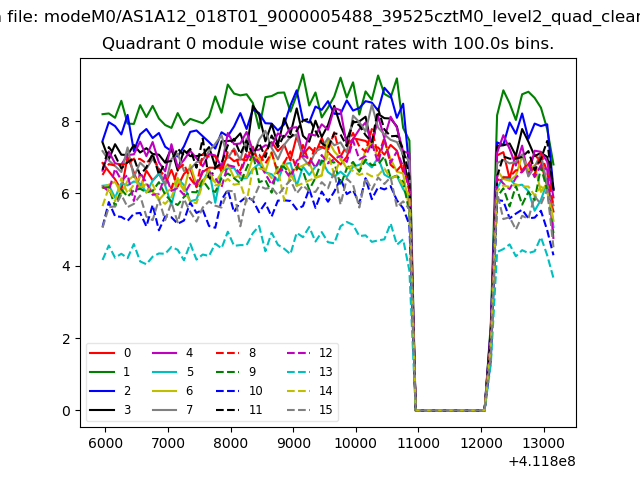 |
 |
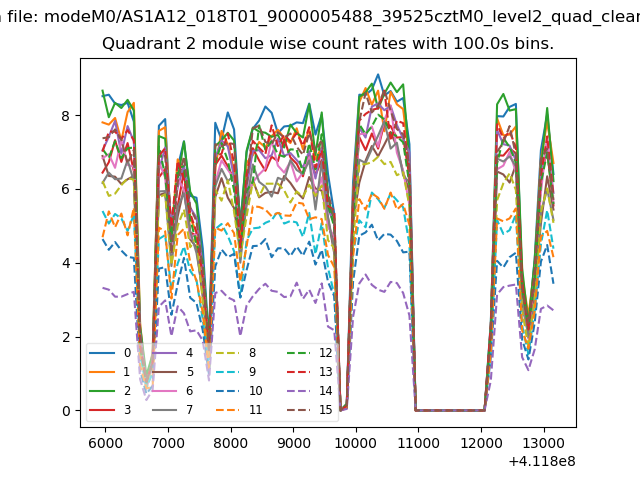
| Module-wise count rates for Quadrant B Data is divided into 100 sec bins |
 |
 |
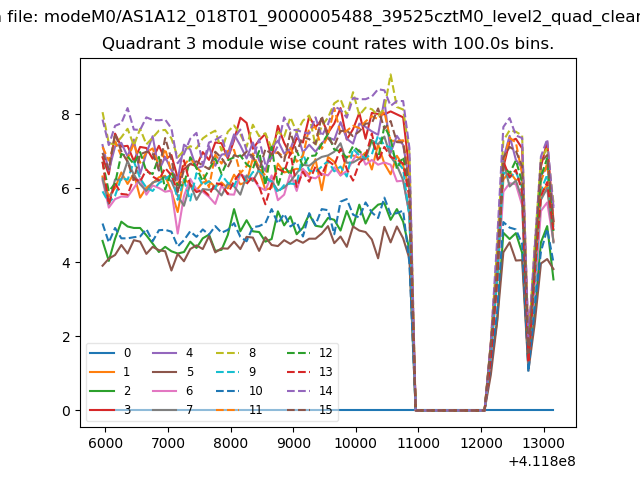
| Module-wise count rates for Quadrant C Data is divided into 100 sec bins |
 |
 |
| Module-wise count rates for Quadrant D Data is divided into 100 sec bins |
 |
 |
| Parameter | Plot |
|---|---|
| CZT HV Monitor |  |
| D_VDD | 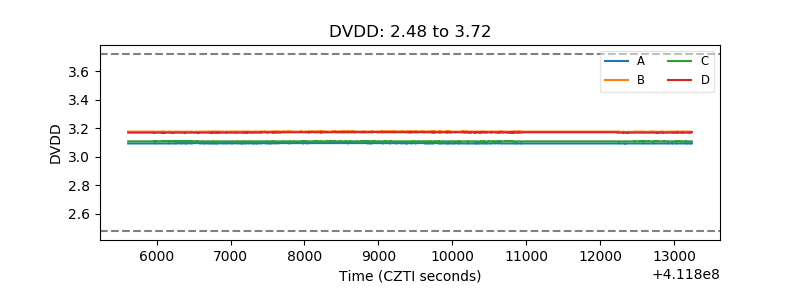 |
| Temperature 1 | 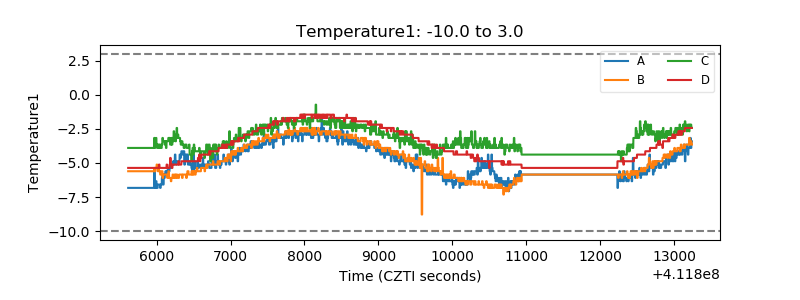 |
| Veto HV Monitor | 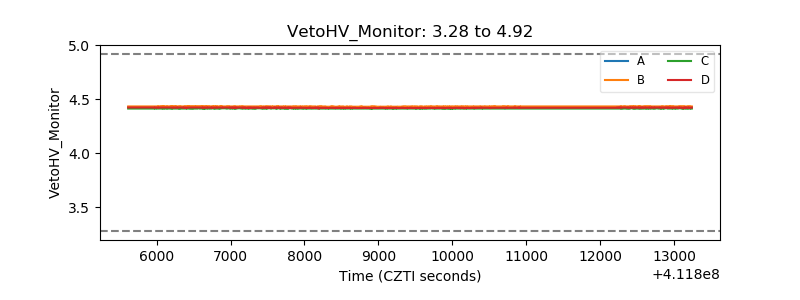 |
| Veto LLD | 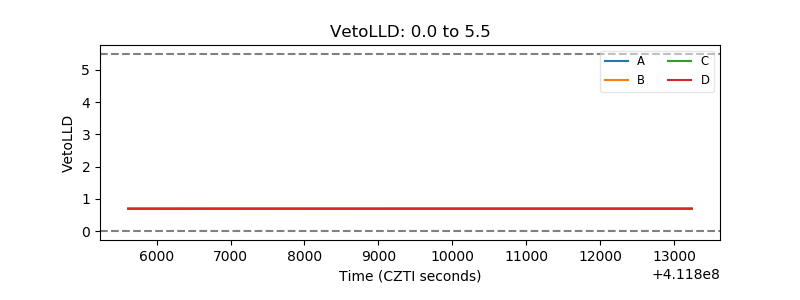 |
| Alpha Counter | 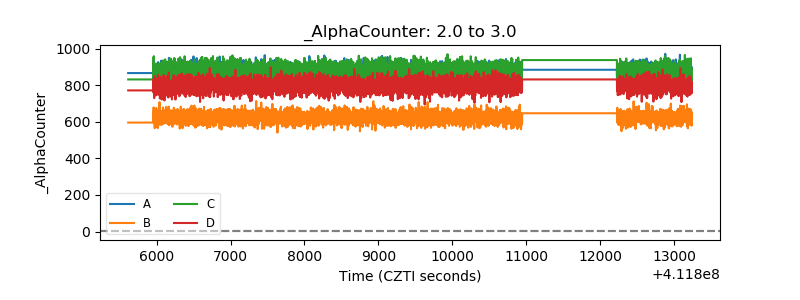 |
| _CPM_Rate | 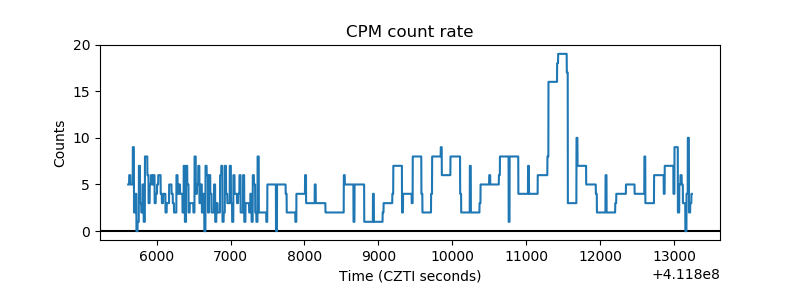 |
| CZT Counter | 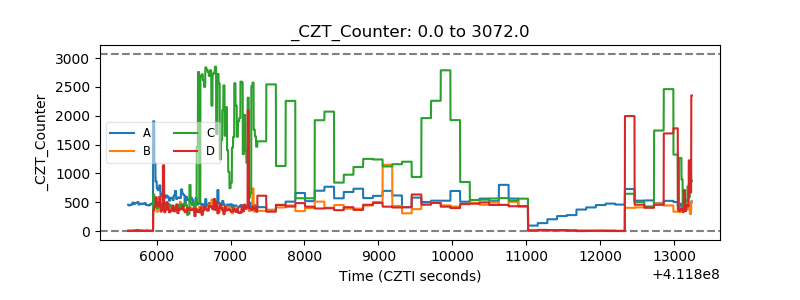 |
| +2.5 Volts monitor | 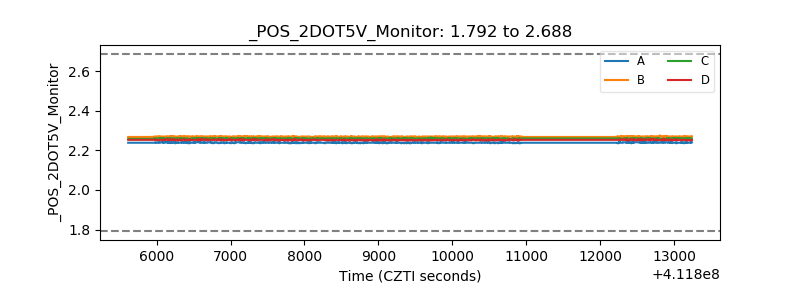 |
| +5 Volts monitor | 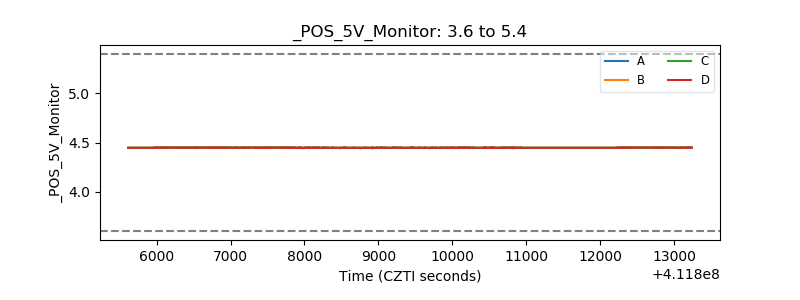 |
| _ROLL_ROT | 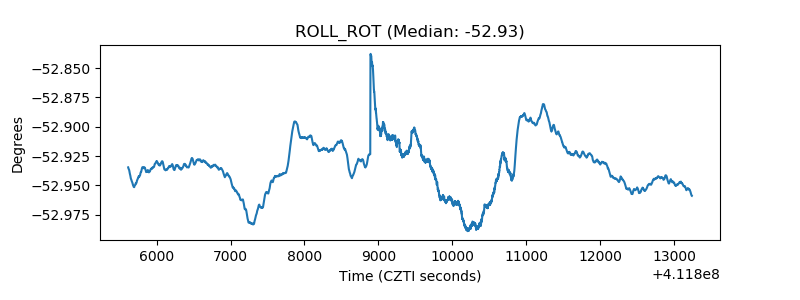 |
| _Roll_DEC | 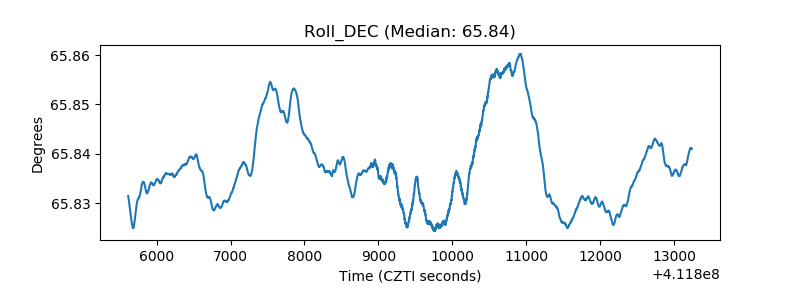 |
| _Roll_RA | 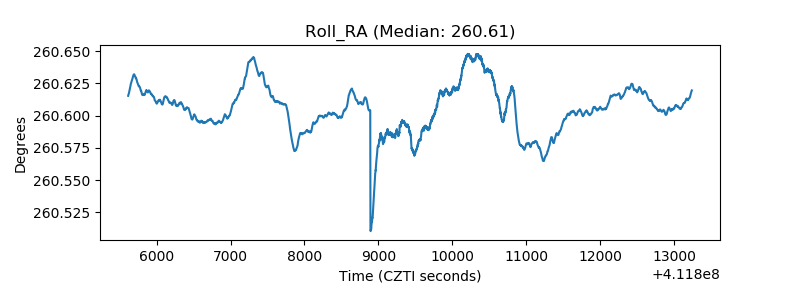 |
| Veto Counter | 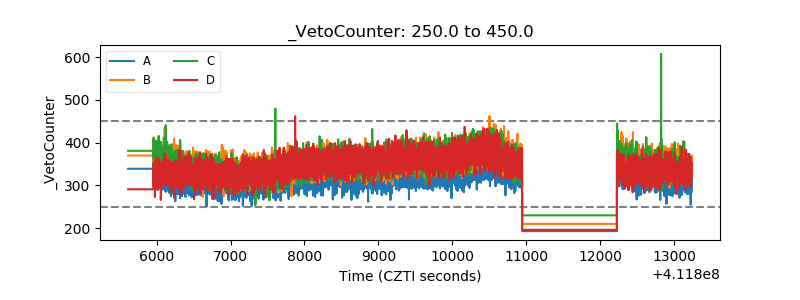 |