| Param | Original file | Final file |
|---|---|---|
| Filename | modeM0/AS1A12_018T01_9000005488_39527cztM0_level2.fits | modeM0/AS1A12_018T01_9000005488_39527cztM0_level2_quad_clean.evt |
| Size (bytes) | 760,884,480 | 168,943,680 |
| Size | 725.6 MB | 161.1 MB |
| Events in quadrant A | 6,422,396 | 1,146,121 |
| Events in quadrant B | 6,159,882 | 1,163,766 |
| Events in quadrant C | 6,869,498 | 1,091,102 |
| Events in quadrant D | 7,877,127 | 966,529 |
| Mode SS | |||
|---|---|---|---|
| Quadrant | BADHDUFLAG | Total packets | Discarded packets |
| A | 0 | 220 | 0 |
| B | 0 | 220 | 0 |
| C | 0 | 220 | 0 |
| D | 0 | 220 | 0 |
| Mode M0 | |||
|---|---|---|---|
| Quadrant | BADHDUFLAG | Total packets | Discarded packets |
| A | 0 | 25701 | 4 |
| B | 0 | 26063 | 3 |
| C | 0 | 27371 | 3 |
| D | 0 | 31071 | 3 |
| Mode M9 | |||
|---|---|---|---|
| Quadrant | BADHDUFLAG | Total packets | Discarded packets |
| A | 0 | 29 | 0 |
| B | 0 | 29 | 0 |
| C | 0 | 29 | 0 |
| D | 0 | 30 | 0 |
| Quadrant | Total seconds | Saturated seconds | Saturation percentage |
|---|---|---|---|
| A | 10795 | 194 | 1.797128% |
| B | 10795 | 379 | 3.510885% |
| C | 10795 | 327 | 3.029180% |
| D | 10795 | 884 | 8.188976% |
Noise dominated data is calculated using 1-second bins in cleaned event files. If a bin has >2000 counts, and if more than 50% of those come from <1% of pixels, then it is considered to be noise-dominated and hence unusable.
| Quadrant | # 1 sec bins | Bins with >0 counts | Bins with >2000 counts | High rate bins dominated by noise | Noise dominated (total time) | Noise dominated (detector-on time) | Marked lightcurve |
|---|---|---|---|---|---|---|---|
| A | 13569 | 10797 | 151 | 151 | 1.11% | 1.40% |  |
| B | 13569 | 10797 | 221 | 221 | 1.63% | 2.05% | 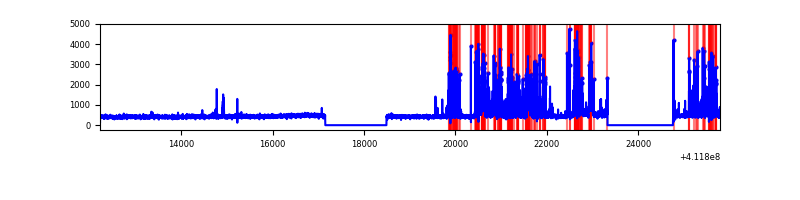 |
| C | 13569 | 10797 | 336 | 336 | 2.48% | 3.11% | 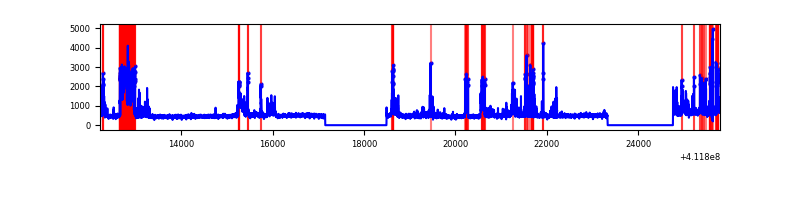 |
| D | 13569 | 10797 | 731 | 731 | 5.39% | 6.77% | 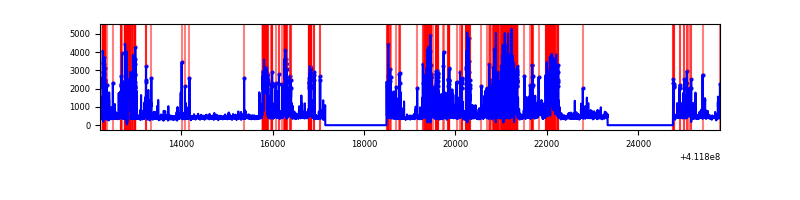 |
Top three noisy pixels from each quadrant. If the there are fewer than three noisy pixels in the level2.evt file, extra rows are filled as -1
| Pixel properties | Quadrant properties | ||||||
|---|---|---|---|---|---|---|---|
| Quadrant | DetID | PixID | Counts | Sigma | Mean | Median | Sigma |
| A | 13 | 248 | 975378 | 4166.53 | 1159 | 1133 | 233.8 |
| A | 10 | 83 | 777081 | 3318.48 | 1159 | 1133 | 233.8 |
| A | 15 | 222 | 178544 | 758.73 | 1159 | 1133 | 233.8 |
| B | 5 | 255 | 1590006 | 7256.77 | 1145 | 1115 | 219.0 |
| B | 12 | 111 | 28324 | 124.27 | 1145 | 1115 | 219.0 |
| B | 15 | 85 | 27030 | 118.36 | 1145 | 1115 | 219.0 |
| C | 9 | 187 | 1780135 | 6801.11 | 1127 | 1134 | 261.6 |
| C | 15 | 214 | 453479 | 1729.31 | 1127 | 1134 | 261.6 |
| C | 15 | 208 | 208200 | 791.61 | 1127 | 1134 | 261.6 |
| D | 12 | 227 | 1474240 | 5434.1 | 1097 | 1062 | 271.1 |
| D | 2 | 249 | 888906 | 3274.98 | 1097 | 1062 | 271.1 |
| D | 13 | 249 | 706428 | 2601.88 | 1097 | 1062 | 271.1 |
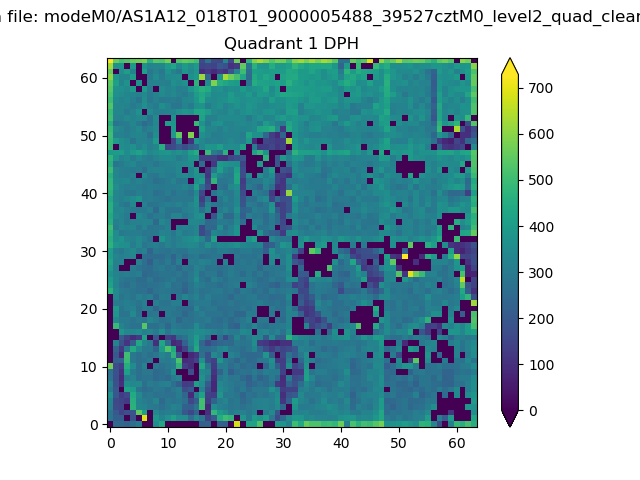
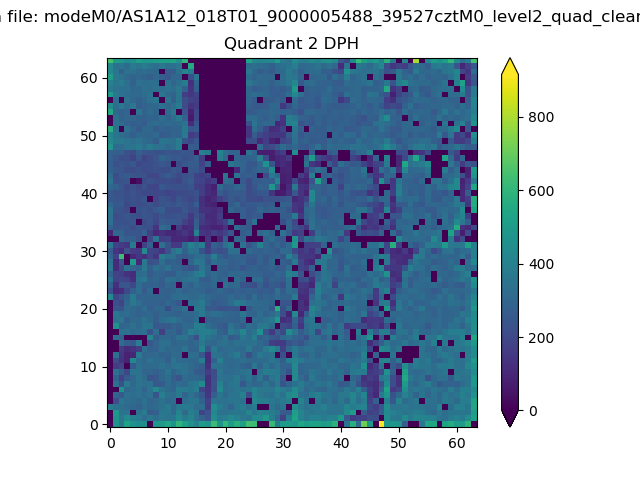
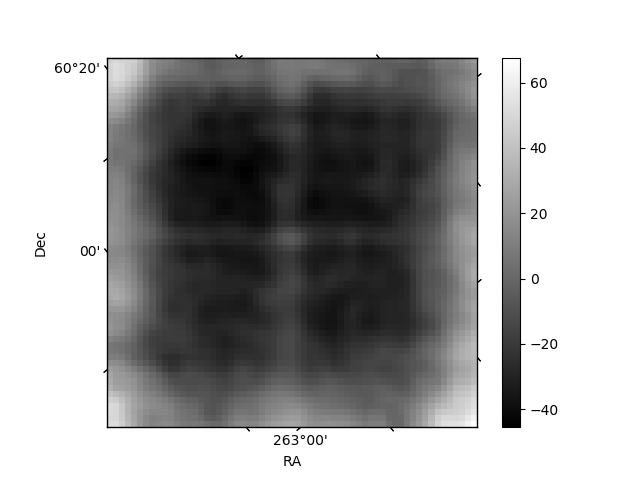
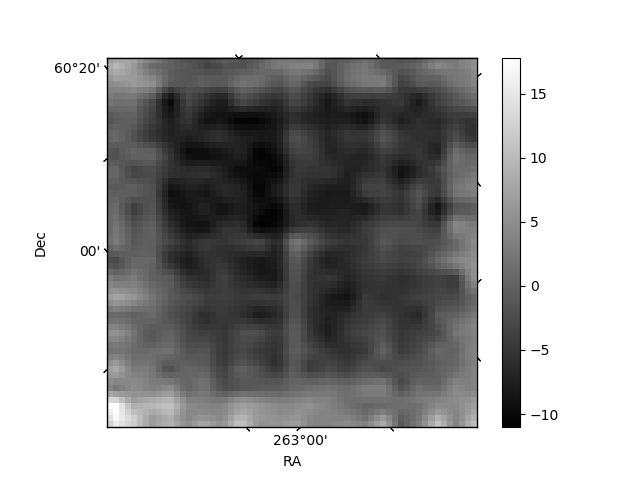
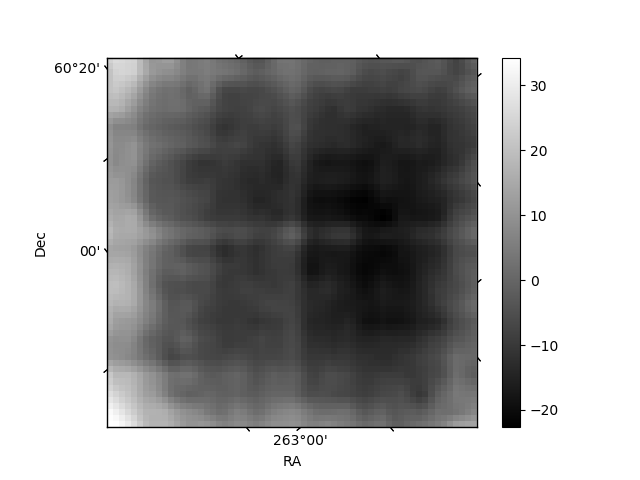
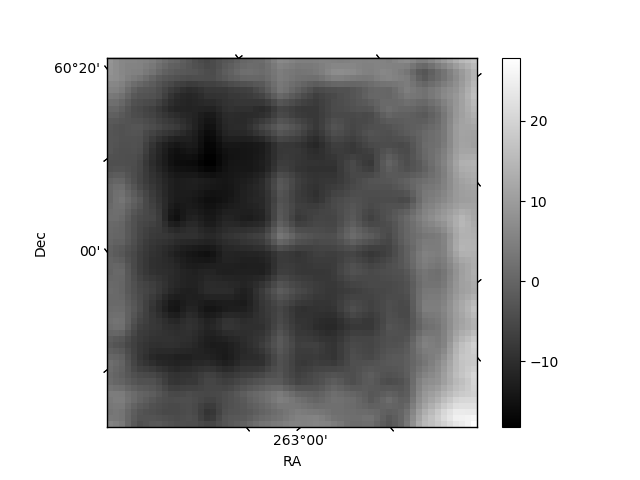
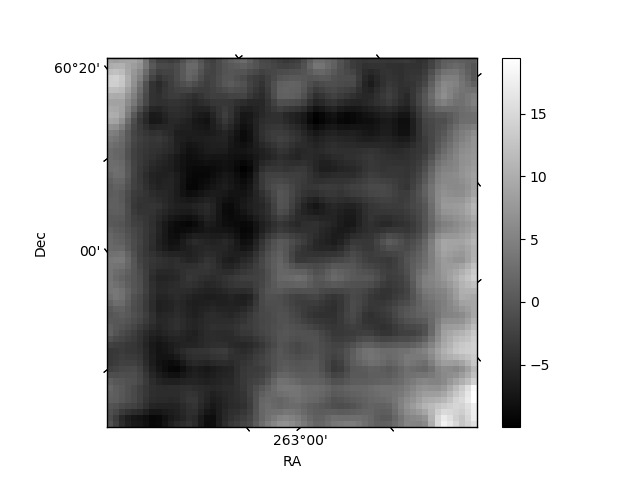
Histogram calculated using DETX and DETY for each event in the final _common_clean file
| Quadrant A | 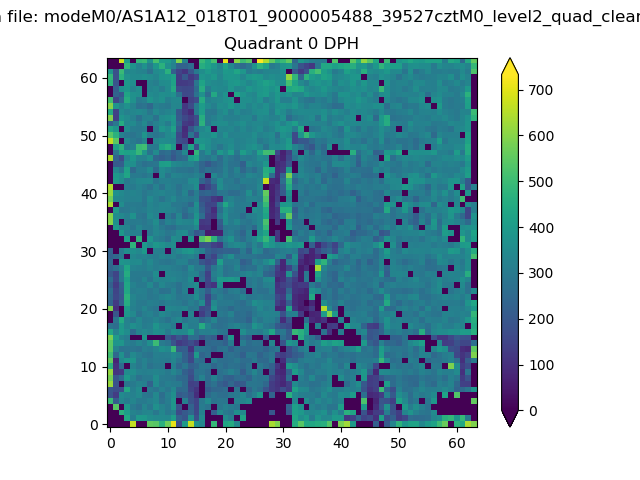 |
 |
Quadrant B |
|---|---|---|---|
| Quadrant D | 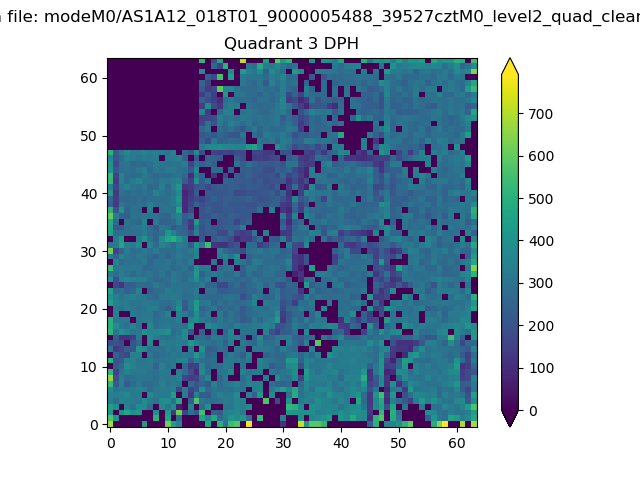 |
 |
Quadrant C |
| Plot type | Count rate plots | Images |
|---|---|---|
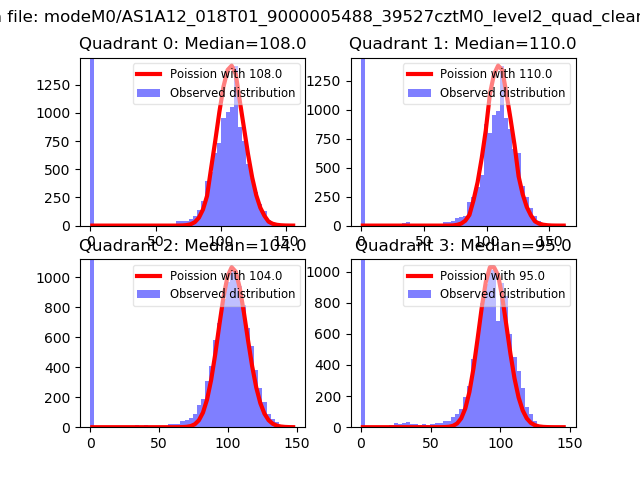
| Comparison with Poisson distribution Blue bars denote a histogram of data divided into 1 sec bins. Red curve is a Poisson curve with rate = median count rate of data. |
 |
 |
| Quadrant-wise count rates Data is divided into 100 sec bins |
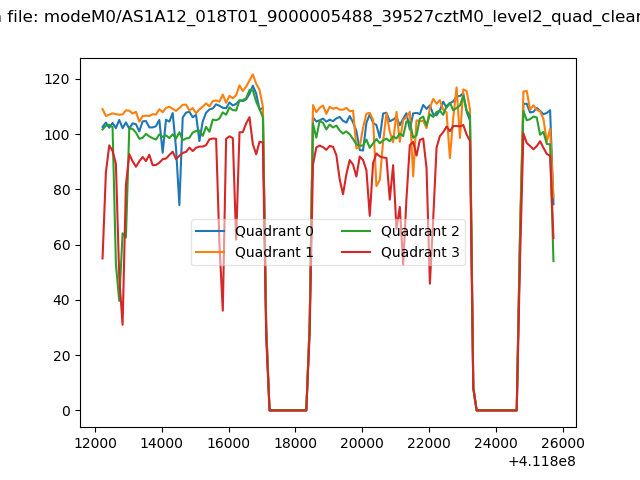 |
|
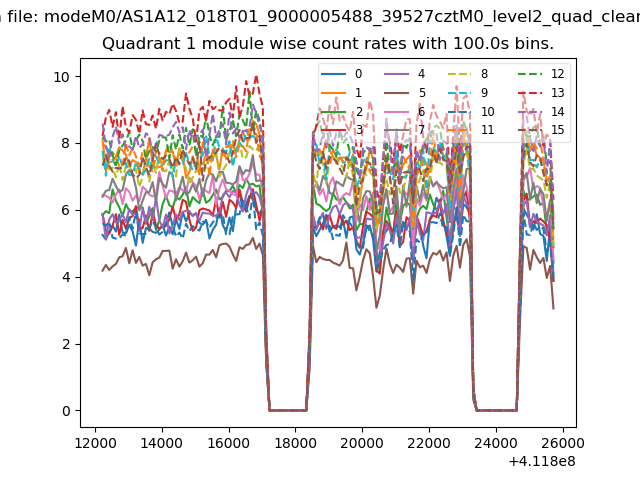
| Module-wise count rates for Quadrant A Data is divided into 100 sec bins |
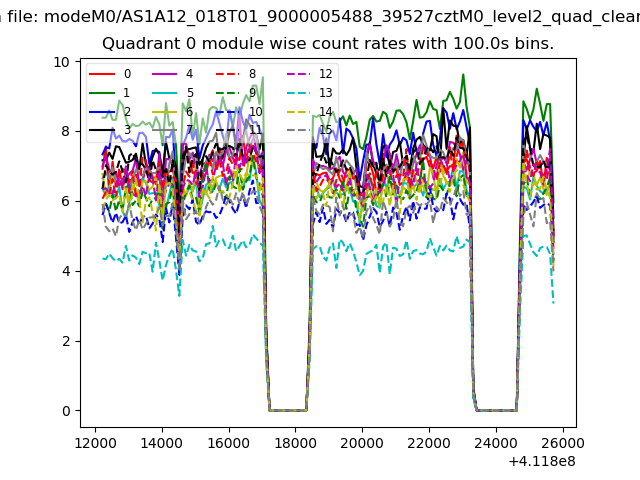 |
 |
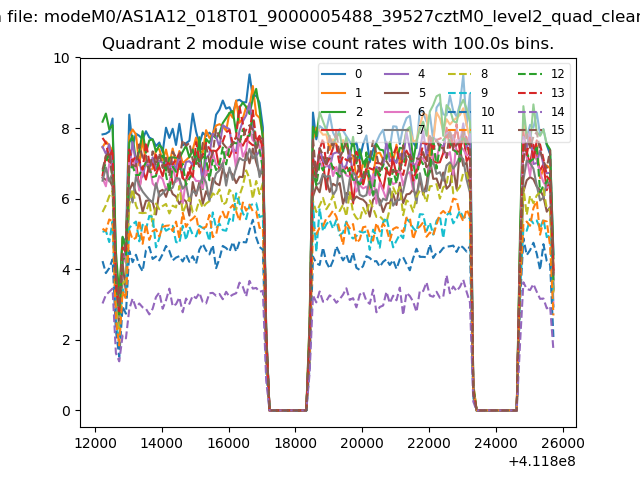
| Module-wise count rates for Quadrant B Data is divided into 100 sec bins |
 |
 |
| Module-wise count rates for Quadrant C Data is divided into 100 sec bins |
 |
 |
| Module-wise count rates for Quadrant D Data is divided into 100 sec bins |
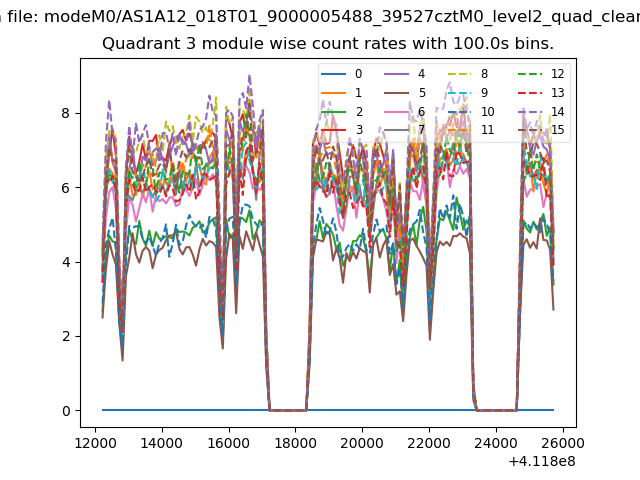 |
 |
| Parameter | Plot |
|---|---|
| CZT HV Monitor | 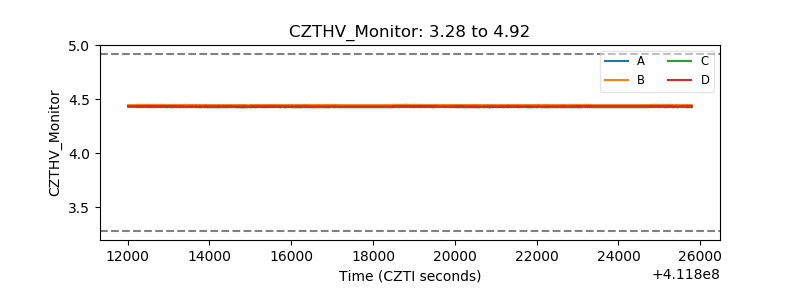 |
| D_VDD | 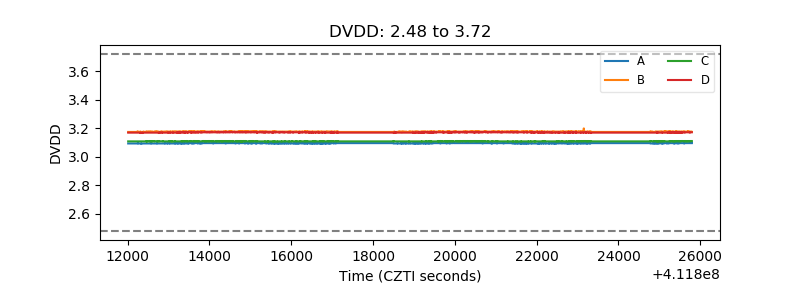 |
| Temperature 1 | 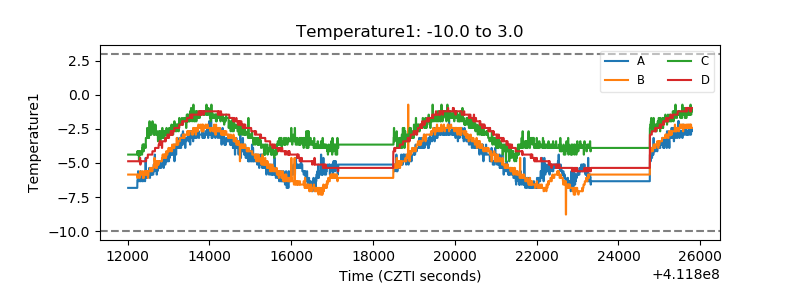 |
| Veto HV Monitor | 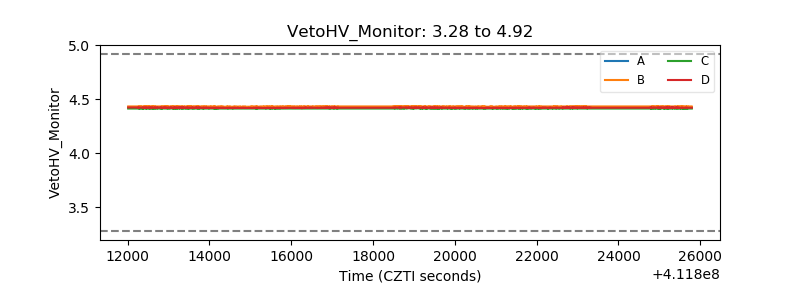 |
| Veto LLD | 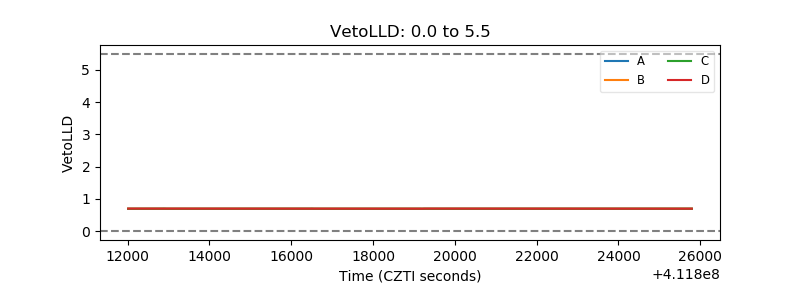 |
| Alpha Counter | 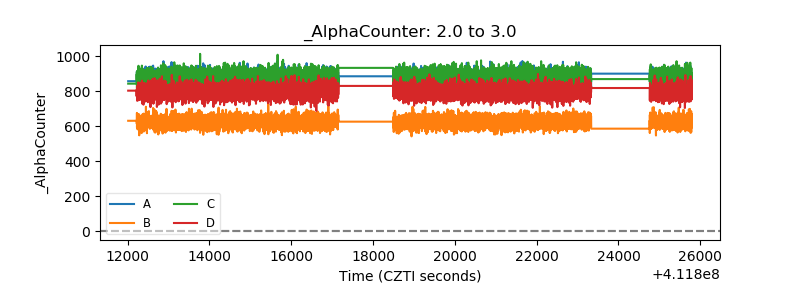 |
| _CPM_Rate | 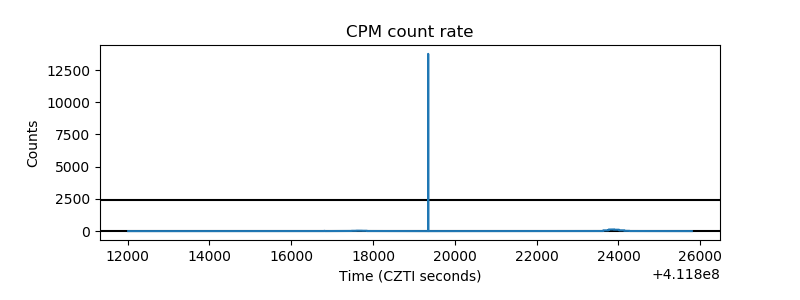 |
| CZT Counter | 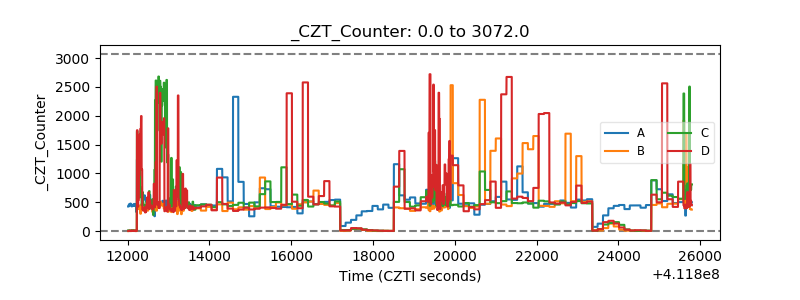 |
| +2.5 Volts monitor |  |
| +5 Volts monitor | 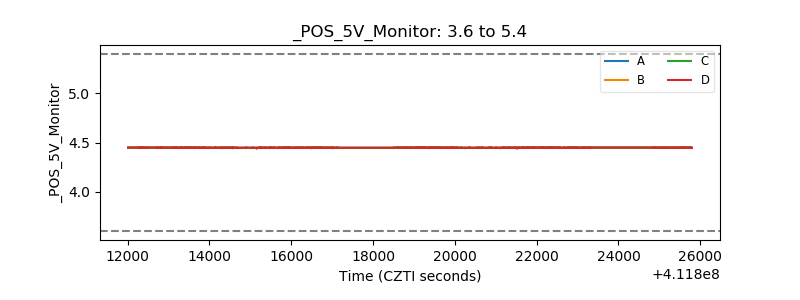 |
| _ROLL_ROT | 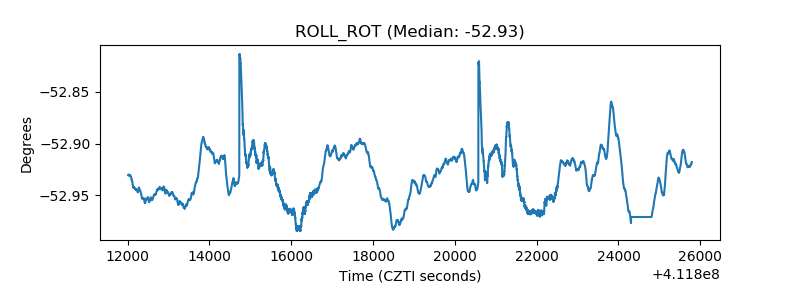 |
| _Roll_DEC | 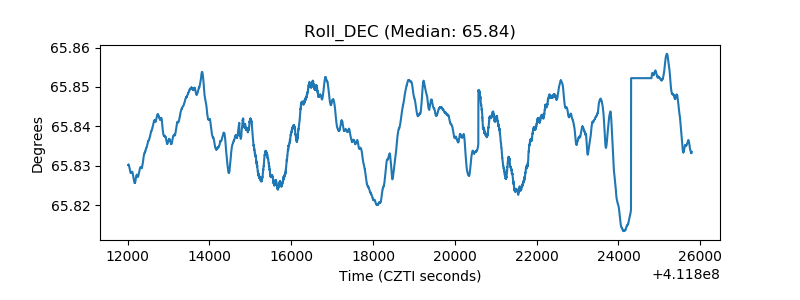 |
| _Roll_RA | 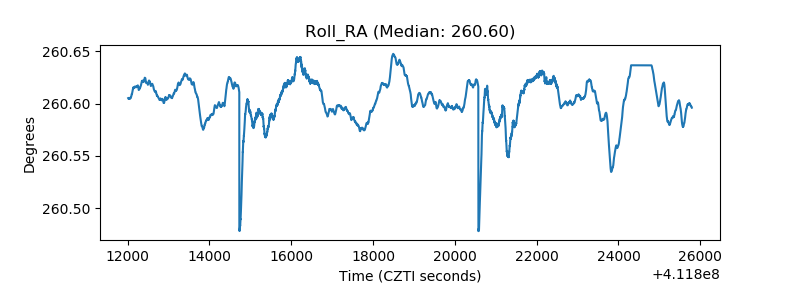 |
| Veto Counter | 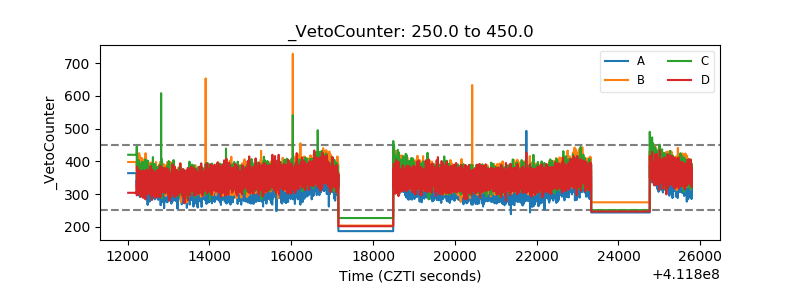 |