| Param | Original file | Final file |
|---|---|---|
| Filename | modeM0/AS1A12_018T01_9000005488_39528cztM0_level2.fits | modeM0/AS1A12_018T01_9000005488_39528cztM0_level2_quad_clean.evt |
| Size (bytes) | 398,088,000 | 91,324,800 |
| Size | 379.6 MB | 87.1 MB |
| Events in quadrant A | 3,173,724 | 627,181 |
| Events in quadrant B | 2,729,578 | 636,007 |
| Events in quadrant C | 5,105,233 | 551,718 |
| Events in quadrant D | 3,284,198 | 551,797 |
| Mode SS | |||
|---|---|---|---|
| Quadrant | BADHDUFLAG | Total packets | Discarded packets |
| A | 0 | 116 | 0 |
| B | 0 | 116 | 0 |
| C | 0 | 116 | 0 |
| D | 0 | 116 | 0 |
| Mode M0 | |||
|---|---|---|---|
| Quadrant | BADHDUFLAG | Total packets | Discarded packets |
| A | 0 | 12945 | 3 |
| B | 0 | 12208 | 2 |
| C | 0 | 18939 | 2 |
| D | 0 | 13725 | 2 |
| Mode M9 | |||
|---|---|---|---|
| Quadrant | BADHDUFLAG | Total packets | Discarded packets |
| A | 0 | 20 | 0 |
| B | 0 | 20 | 0 |
| C | 0 | 20 | 0 |
| D | 0 | 21 | 0 |
| Quadrant | Total seconds | Saturated seconds | Saturation percentage |
|---|---|---|---|
| A | 5697 | 27 | 0.473934% |
| B | 5697 | 68 | 1.193611% |
| C | 5697 | 550 | 9.654204% |
| D | 5697 | 141 | 2.474987% |
Noise dominated data is calculated using 1-second bins in cleaned event files. If a bin has >2000 counts, and if more than 50% of those come from <1% of pixels, then it is considered to be noise-dominated and hence unusable.
| Quadrant | # 1 sec bins | Bins with >0 counts | Bins with >2000 counts | High rate bins dominated by noise | Noise dominated (total time) | Noise dominated (detector-on time) | Marked lightcurve |
|---|---|---|---|---|---|---|---|
| A | 7251 | 5698 | 14 | 14 | 0.19% | 0.25% | 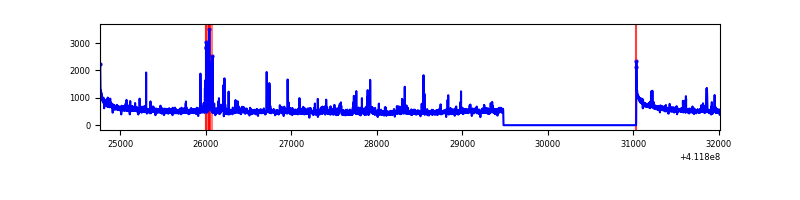 |
| B | 7251 | 5698 | 34 | 34 | 0.47% | 0.60% | 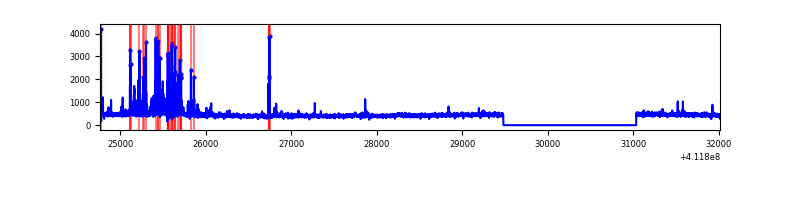 |
| C | 7251 | 5698 | 534 | 534 | 7.36% | 9.37% | 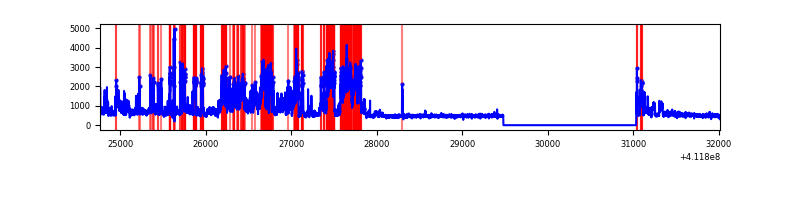 |
| D | 7251 | 5698 | 95 | 95 | 1.31% | 1.67% | 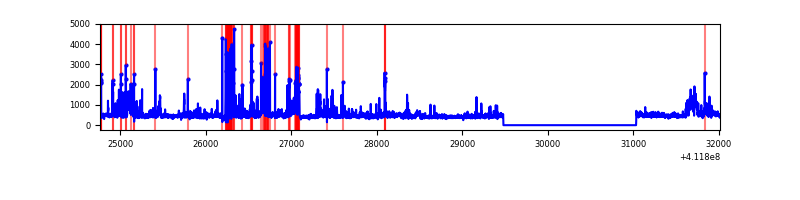 |
Top three noisy pixels from each quadrant. If the there are fewer than three noisy pixels in the level2.evt file, extra rows are filled as -1
| Pixel properties | Quadrant properties | ||||||
|---|---|---|---|---|---|---|---|
| Quadrant | DetID | PixID | Counts | Sigma | Mean | Median | Sigma |
| A | 10 | 83 | 459725 | 3649.33 | 620 | 607 | 125.8 |
| A | 15 | 222 | 179307 | 1420.41 | 620 | 607 | 125.8 |
| A | 13 | 248 | 112746 | 891.34 | 620 | 607 | 125.8 |
| B | 5 | 255 | 280098 | 2330.32 | 615 | 597 | 119.9 |
| B | 15 | 85 | 21942 | 177.96 | 615 | 597 | 119.9 |
| B | 12 | 111 | 14943 | 119.61 | 615 | 597 | 119.9 |
| C | 9 | 187 | 2463959 | 18052.21 | 586 | 590 | 136.5 |
| C | 15 | 214 | 248176 | 1814.37 | 586 | 590 | 136.5 |
| C | 15 | 208 | 72375 | 526.06 | 586 | 590 | 136.5 |
| D | 13 | 249 | 314081 | 2117.82 | 600 | 582 | 148.0 |
| D | 13 | 174 | 161211 | 1085.12 | 600 | 582 | 148.0 |
| D | 2 | 249 | 111171 | 747.08 | 600 | 582 | 148.0 |
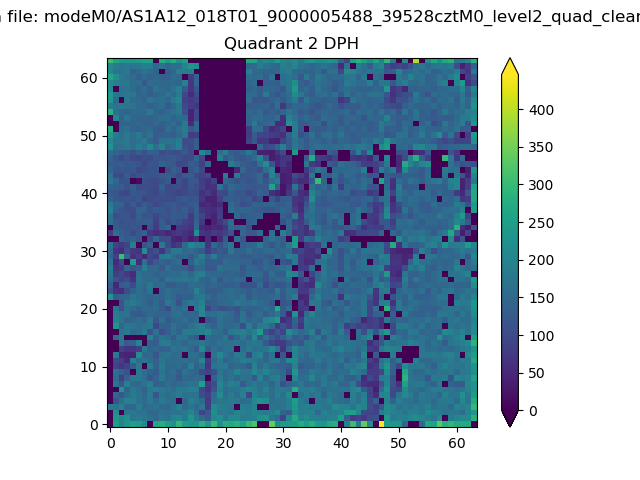
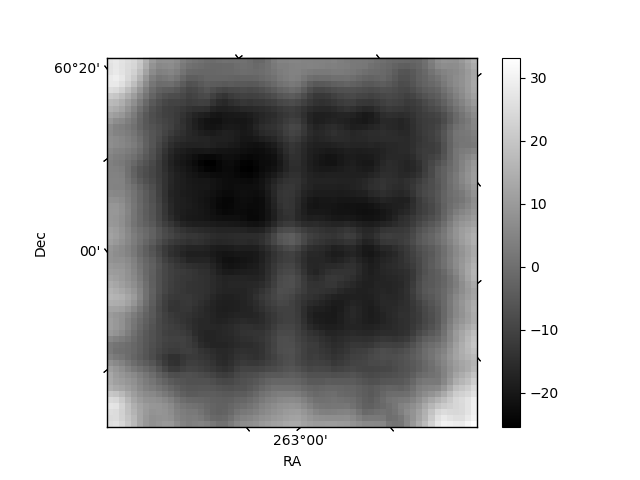
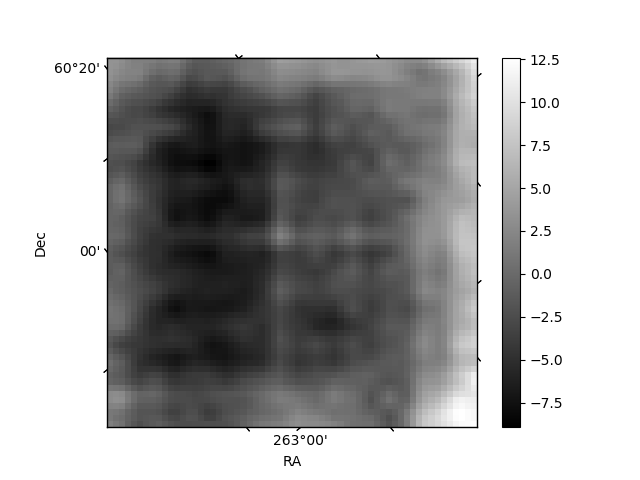
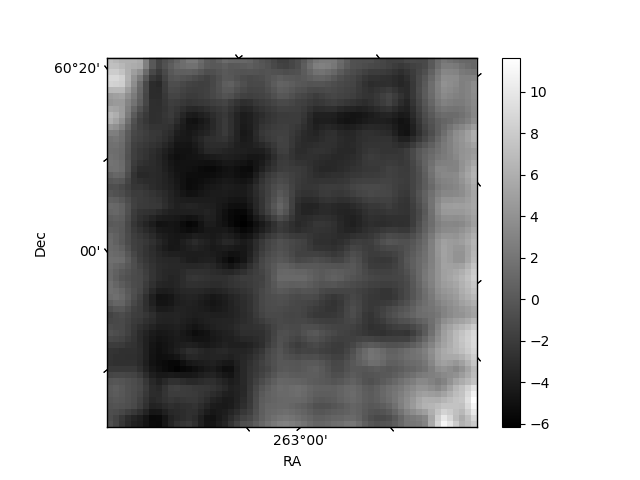
Histogram calculated using DETX and DETY for each event in the final _common_clean file
| Quadrant A | 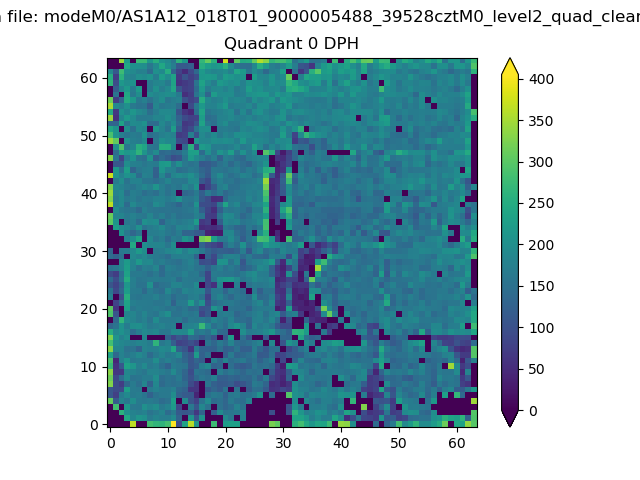 |
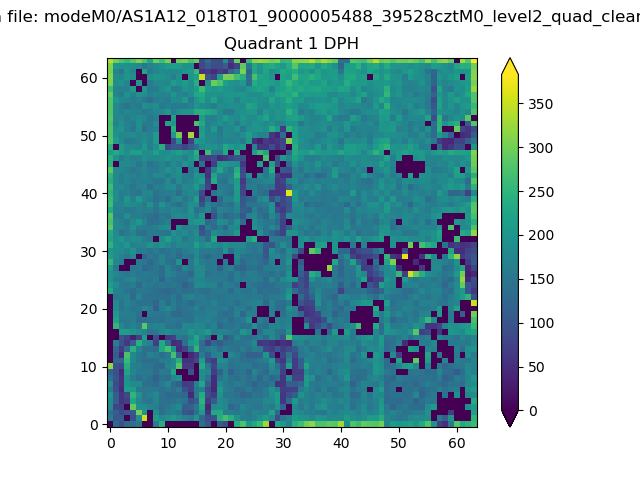 |
Quadrant B |
|---|---|---|---|
| Quadrant D | 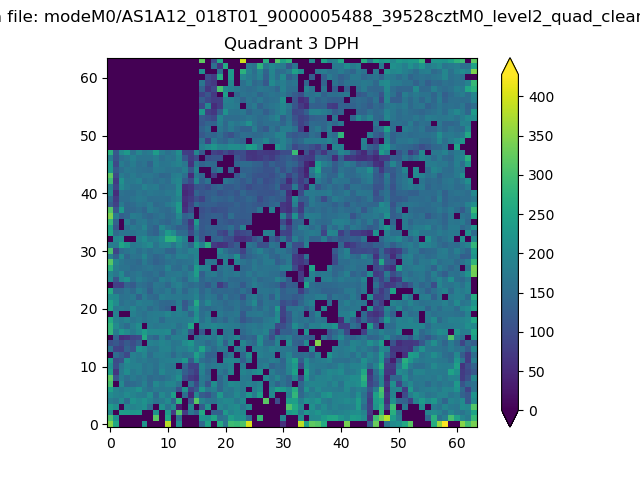 |
 |
Quadrant C |
| Plot type | Count rate plots | Images |
|---|---|---|
| Comparison with Poisson distribution Blue bars denote a histogram of data divided into 1 sec bins. Red curve is a Poisson curve with rate = median count rate of data. |
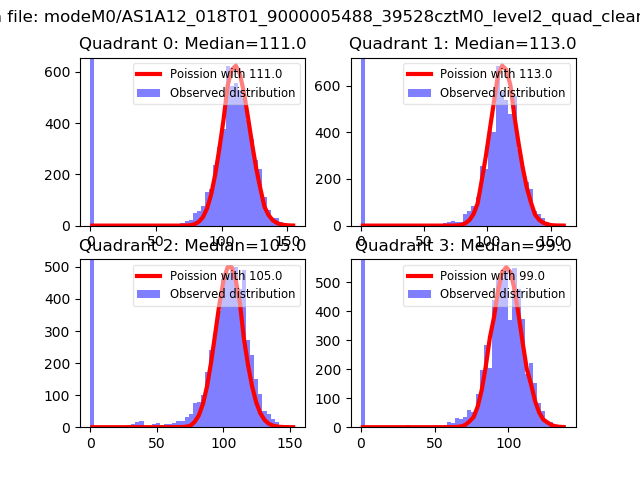 |
 |
| Quadrant-wise count rates Data is divided into 100 sec bins |
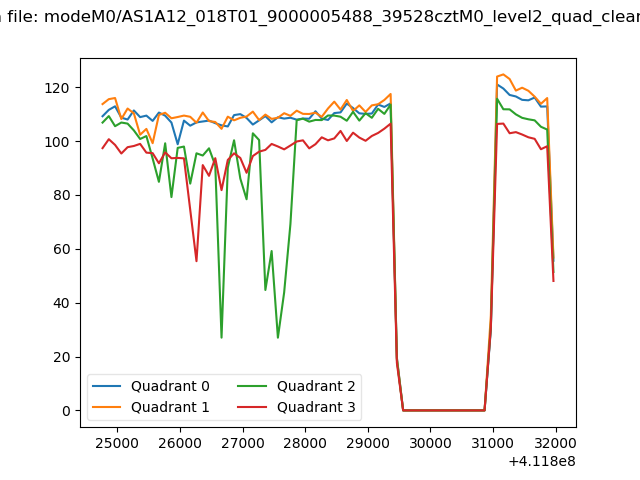 |
|
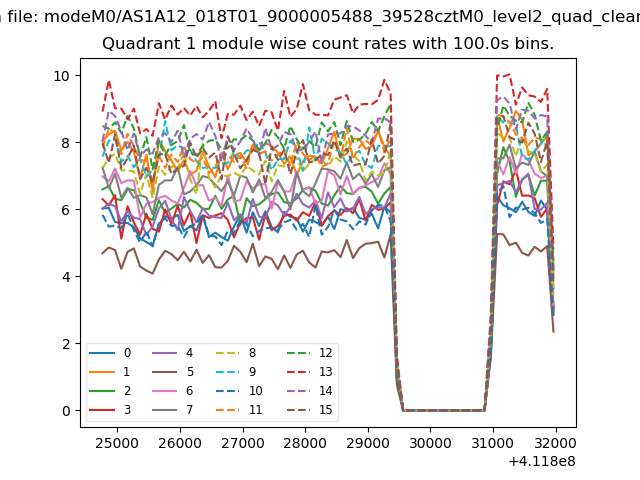
| Module-wise count rates for Quadrant A Data is divided into 100 sec bins |
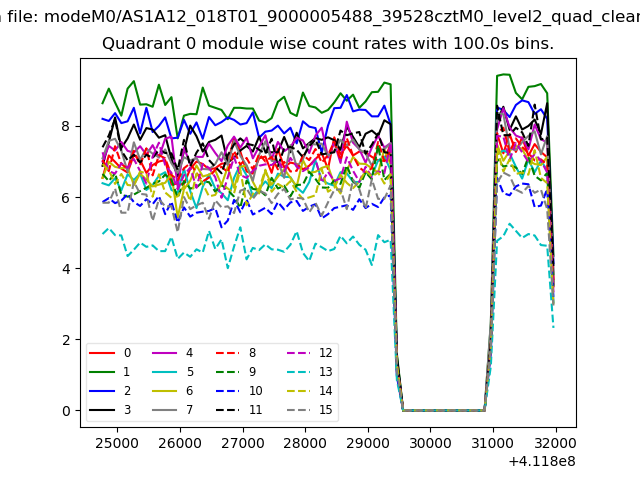 |
 |
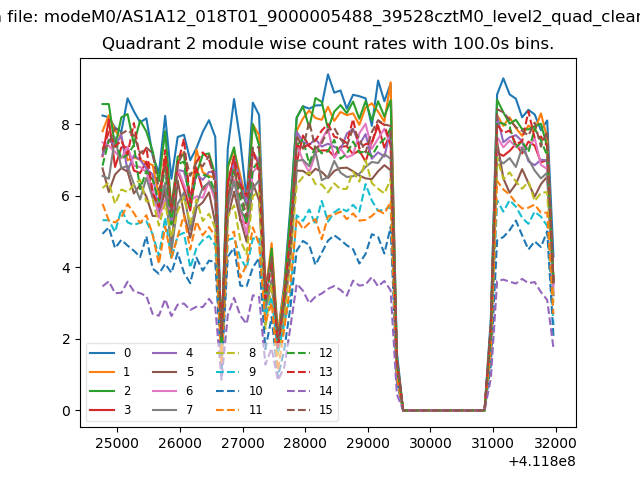
| Module-wise count rates for Quadrant B Data is divided into 100 sec bins |
 |
 |
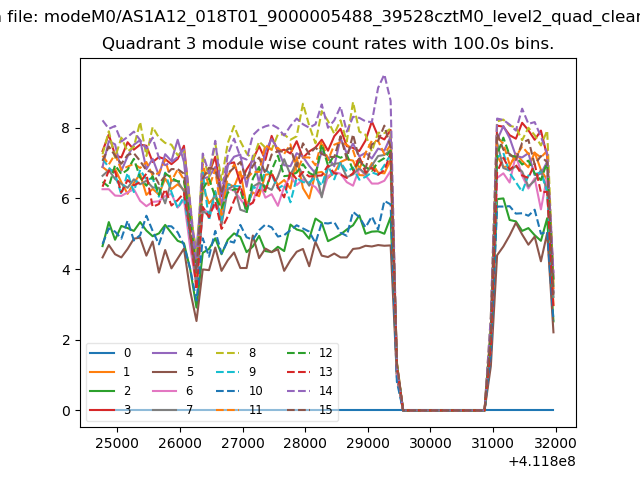
| Module-wise count rates for Quadrant C Data is divided into 100 sec bins |
 |
 |
| Module-wise count rates for Quadrant D Data is divided into 100 sec bins |
 |
 |
| Parameter | Plot |
|---|---|
| CZT HV Monitor | 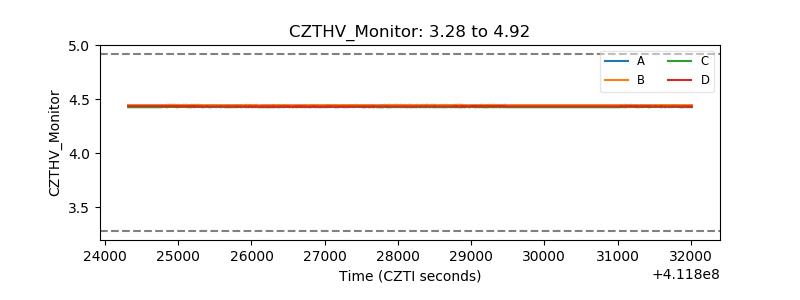 |
| D_VDD | 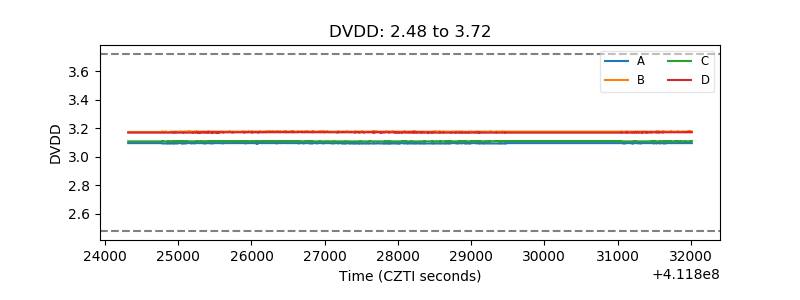 |
| Temperature 1 | 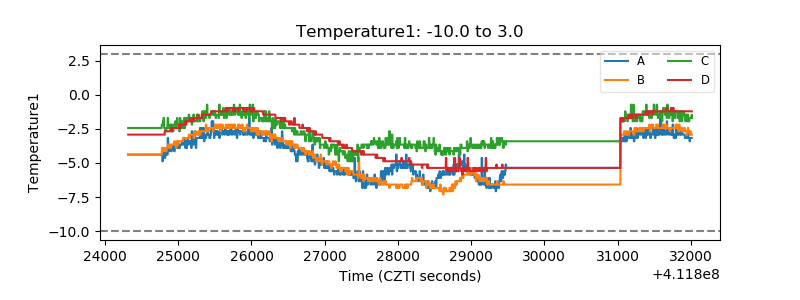 |
| Veto HV Monitor | 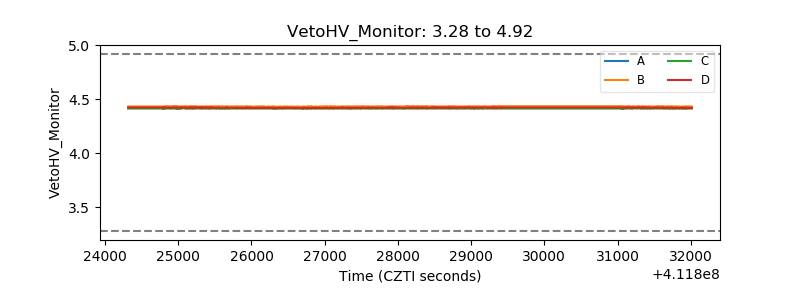 |
| Veto LLD | 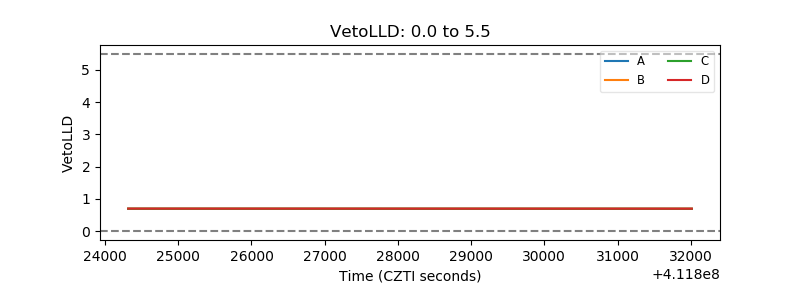 |
| Alpha Counter | 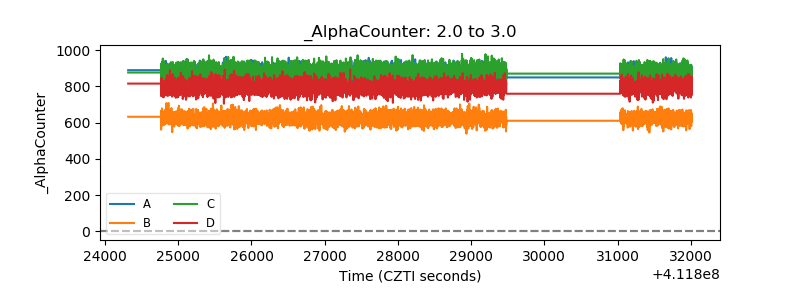 |
| _CPM_Rate | 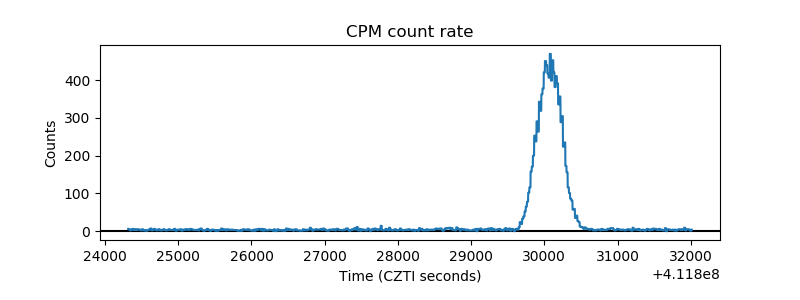 |
| CZT Counter | 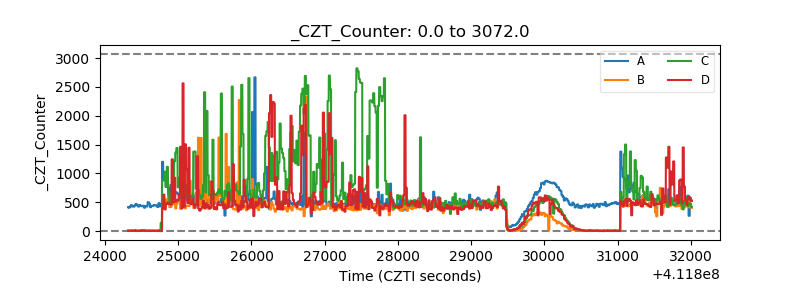 |
| +2.5 Volts monitor | 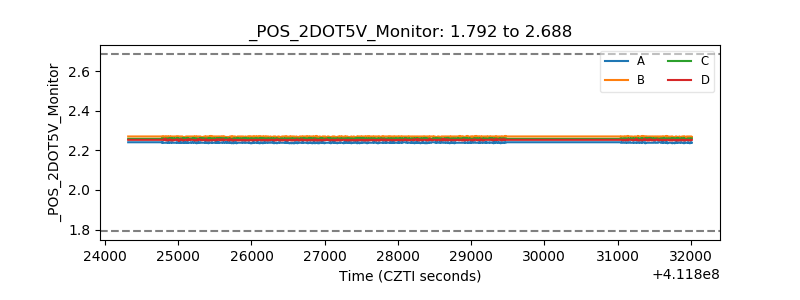 |
| +5 Volts monitor | 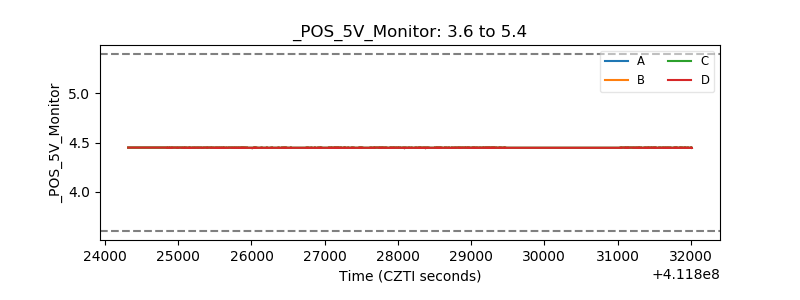 |
| _ROLL_ROT | 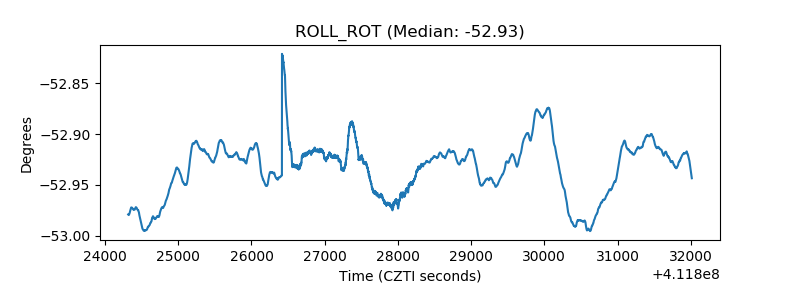 |
| _Roll_DEC | 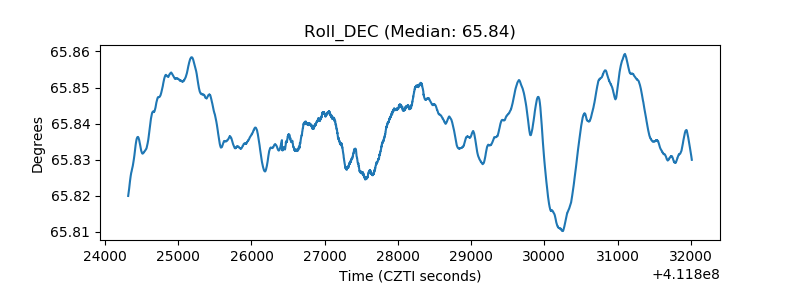 |
| _Roll_RA | 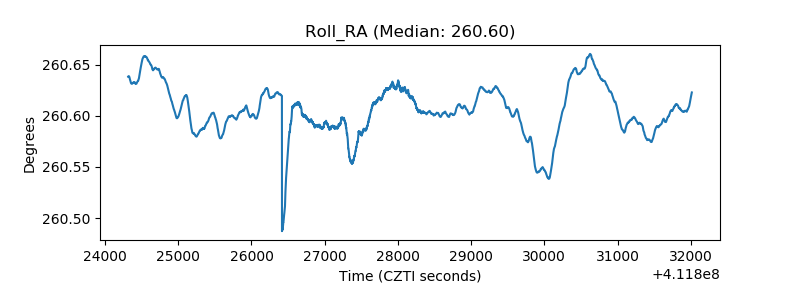 |
| Veto Counter | 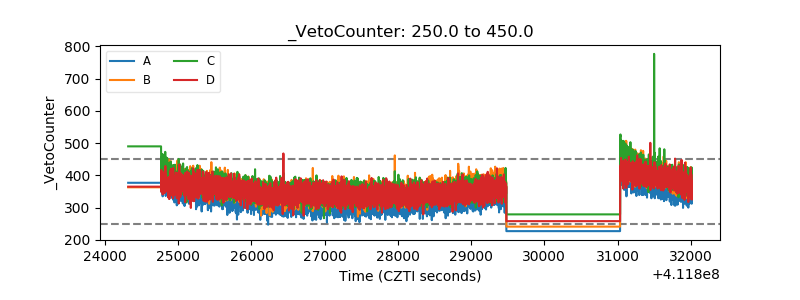 |