| Param | Original file | Final file |
|---|---|---|
| Filename | modeM0/AS1A12_018T01_9000005488_39529cztM0_level2.fits | modeM0/AS1A12_018T01_9000005488_39529cztM0_level2_quad_clean.evt |
| Size (bytes) | 397,123,200 | 94,118,400 |
| Size | 378.7 MB | 89.8 MB |
| Events in quadrant A | 3,773,098 | 630,835 |
| Events in quadrant B | 2,509,721 | 657,575 |
| Events in quadrant C | 4,179,884 | 599,186 |
| Events in quadrant D | 3,794,450 | 563,738 |
| Mode SS | |||
|---|---|---|---|
| Quadrant | BADHDUFLAG | Total packets | Discarded packets |
| A | 0 | 116 | 0 |
| B | 0 | 116 | 0 |
| C | 0 | 116 | 0 |
| D | 0 | 116 | 0 |
| Mode M0 | |||
|---|---|---|---|
| Quadrant | BADHDUFLAG | Total packets | Discarded packets |
| A | 0 | 15019 | 3 |
| B | 0 | 11567 | 2 |
| C | 0 | 16216 | 2 |
| D | 0 | 15098 | 2 |
| Mode M9 | |||
|---|---|---|---|
| Quadrant | BADHDUFLAG | Total packets | Discarded packets |
| A | 0 | 17 | 0 |
| B | 0 | 17 | 0 |
| C | 0 | 17 | 0 |
| D | 0 | 18 | 0 |
| Quadrant | Total seconds | Saturated seconds | Saturation percentage |
|---|---|---|---|
| A | 5698 | 199 | 3.492453% |
| B | 5698 | 9 | 0.157950% |
| C | 5698 | 201 | 3.527554% |
| D | 5698 | 163 | 2.860653% |
Noise dominated data is calculated using 1-second bins in cleaned event files. If a bin has >2000 counts, and if more than 50% of those come from <1% of pixels, then it is considered to be noise-dominated and hence unusable.
| Quadrant | # 1 sec bins | Bins with >0 counts | Bins with >2000 counts | High rate bins dominated by noise | Noise dominated (total time) | Noise dominated (detector-on time) | Marked lightcurve |
|---|---|---|---|---|---|---|---|
| A | 7400 | 5699 | 168 | 168 | 2.27% | 2.95% | 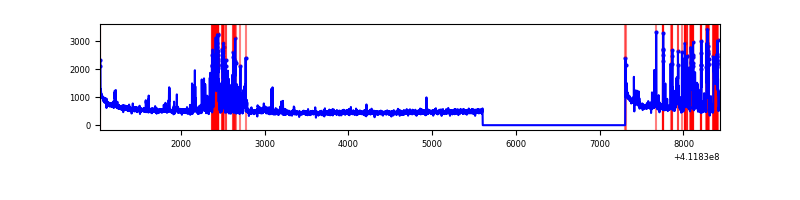 |
| B | 7400 | 5699 | 5 | 5 | 0.07% | 0.09% | 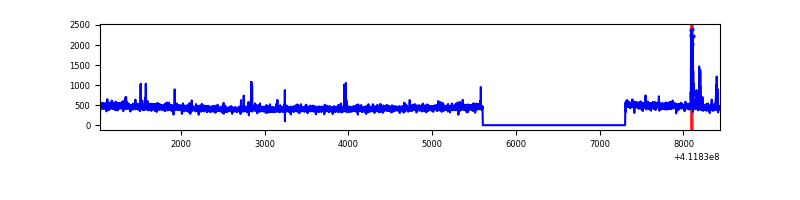 |
| C | 7400 | 5699 | 196 | 196 | 2.65% | 3.44% | 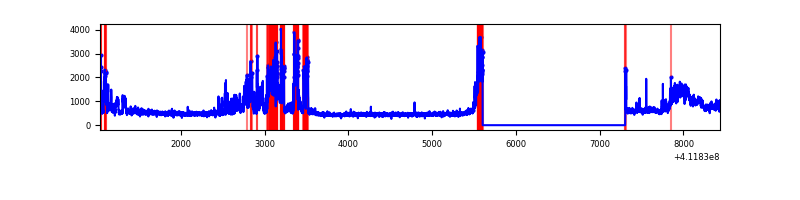 |
| D | 7400 | 5699 | 144 | 144 | 1.95% | 2.53% | 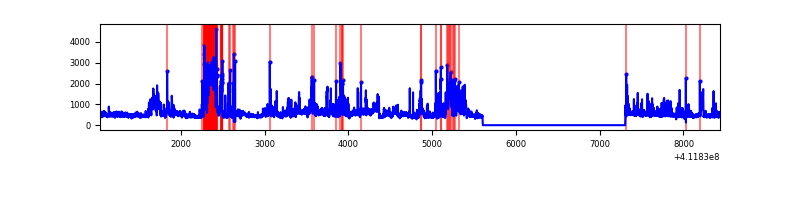 |
Top three noisy pixels from each quadrant. If the there are fewer than three noisy pixels in the level2.evt file, extra rows are filled as -1
| Pixel properties | Quadrant properties | ||||||
|---|---|---|---|---|---|---|---|
| Quadrant | DetID | PixID | Counts | Sigma | Mean | Median | Sigma |
| A | 13 | 248 | 609401 | 4812.54 | 621 | 608 | 126.5 |
| A | 10 | 83 | 463825 | 3661.76 | 621 | 608 | 126.5 |
| A | 15 | 222 | 292805 | 2309.83 | 621 | 608 | 126.5 |
| B | 15 | 85 | 44851 | 367.42 | 622 | 604 | 120.4 |
| B | 5 | 255 | 17354 | 139.09 | 622 | 604 | 120.4 |
| B | 12 | 111 | 14817 | 118.02 | 622 | 604 | 120.4 |
| C | 9 | 187 | 1529366 | 10808.14 | 607 | 611 | 141.4 |
| C | 15 | 214 | 251604 | 1774.5 | 607 | 611 | 141.4 |
| C | 4 | 111 | 16056 | 109.19 | 607 | 611 | 141.4 |
| D | 13 | 174 | 652317 | 4350.38 | 607 | 591 | 149.8 |
| D | 13 | 249 | 483874 | 3225.99 | 607 | 591 | 149.8 |
| D | 14 | 34 | 115790 | 768.97 | 607 | 591 | 149.8 |
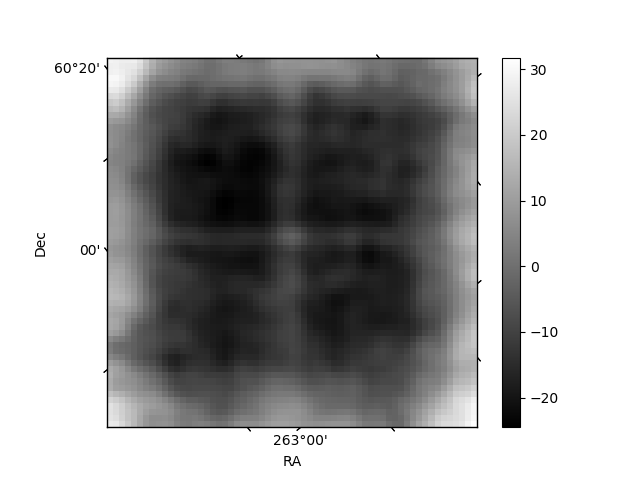
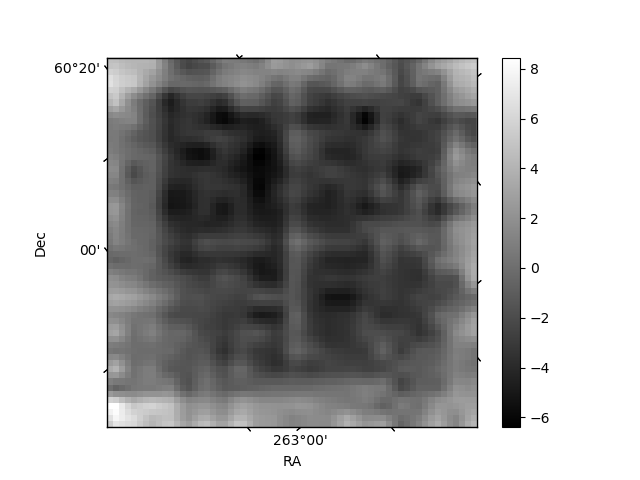
Histogram calculated using DETX and DETY for each event in the final _common_clean file
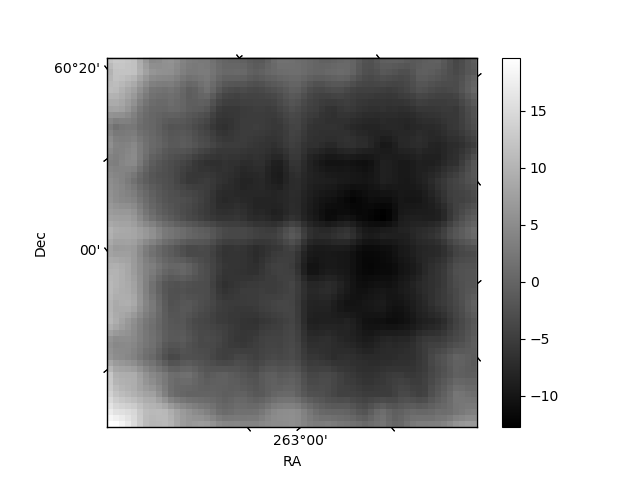
| Quadrant A | 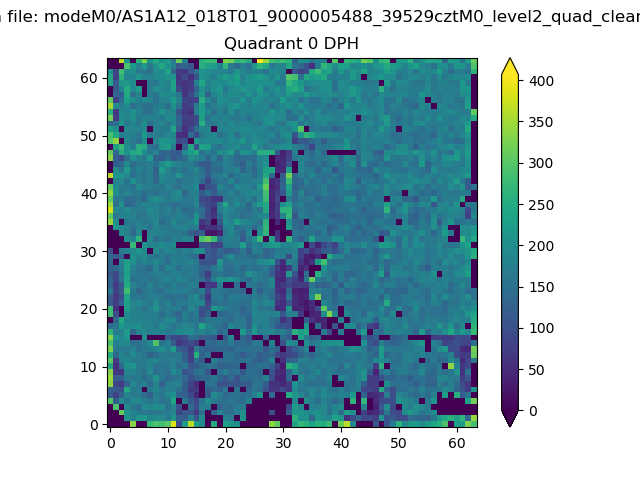 |
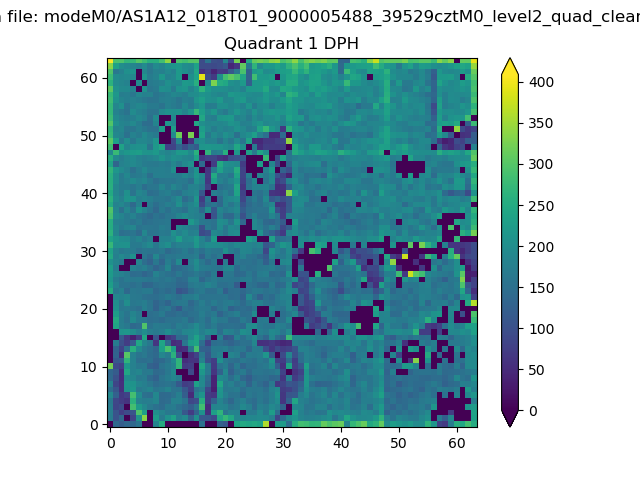 |
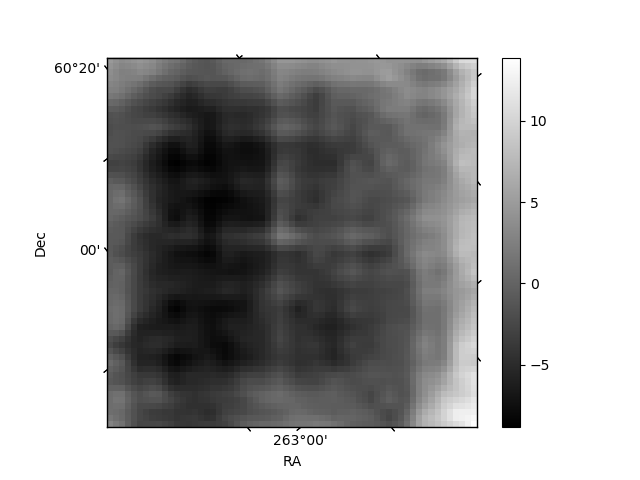
Quadrant B |
|---|---|---|---|
| Quadrant D | 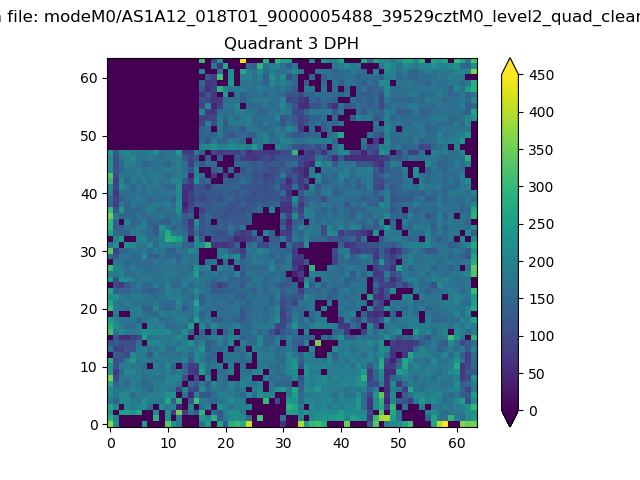 |
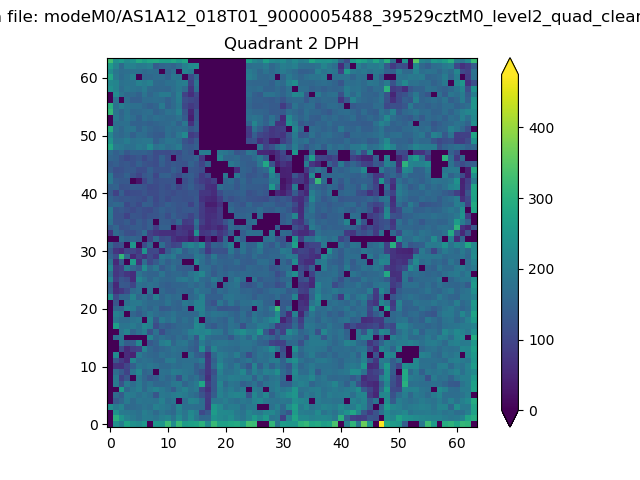 |
Quadrant C |
| Plot type | Count rate plots | Images |
|---|---|---|
| Comparison with Poisson distribution Blue bars denote a histogram of data divided into 1 sec bins. Red curve is a Poisson curve with rate = median count rate of data. |
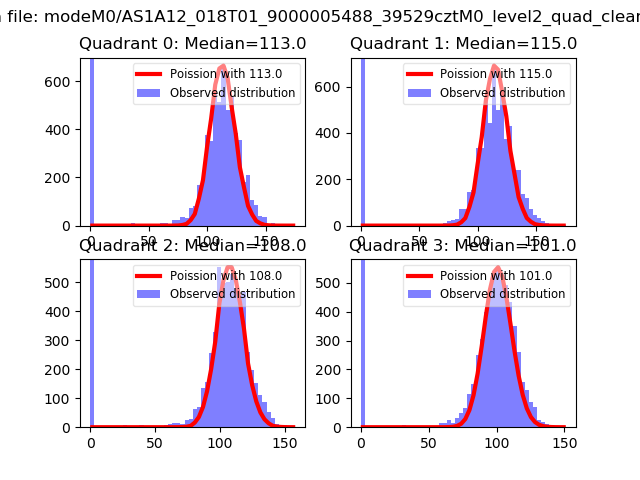 |
 |
| Quadrant-wise count rates Data is divided into 100 sec bins |
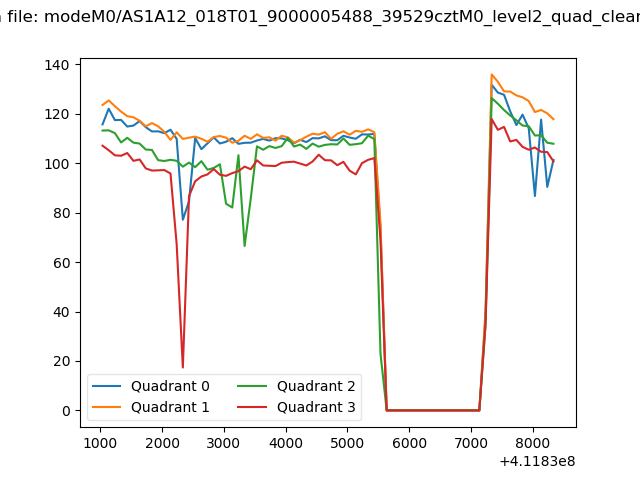 |
|
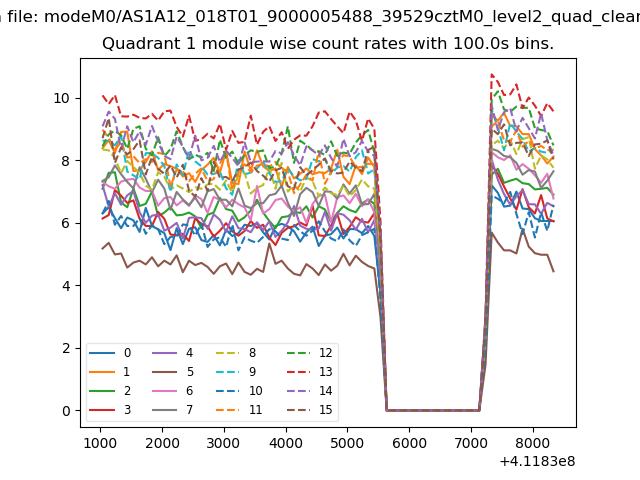
| Module-wise count rates for Quadrant A Data is divided into 100 sec bins |
 |
 |
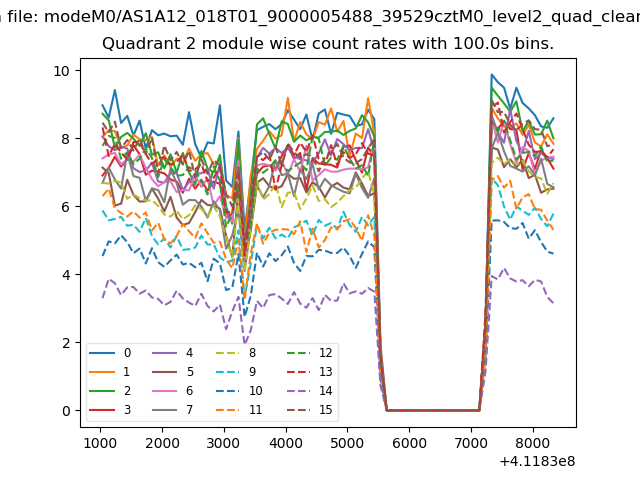
| Module-wise count rates for Quadrant B Data is divided into 100 sec bins |
 |
 |
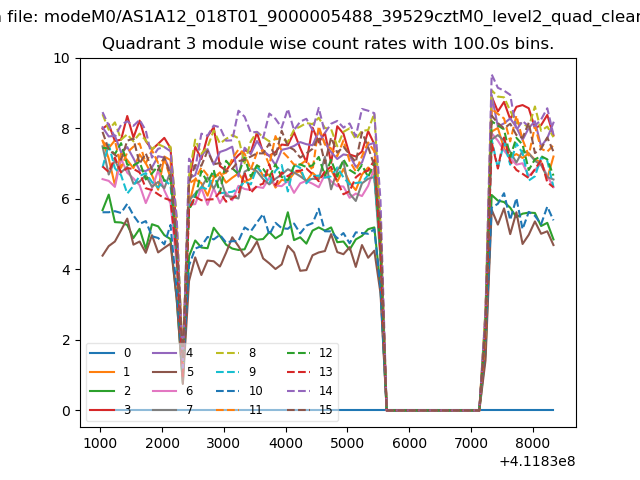
| Module-wise count rates for Quadrant C Data is divided into 100 sec bins |
 |
 |
| Module-wise count rates for Quadrant D Data is divided into 100 sec bins |
 |
 |
| Parameter | Plot |
|---|---|
| CZT HV Monitor |  |
| D_VDD | 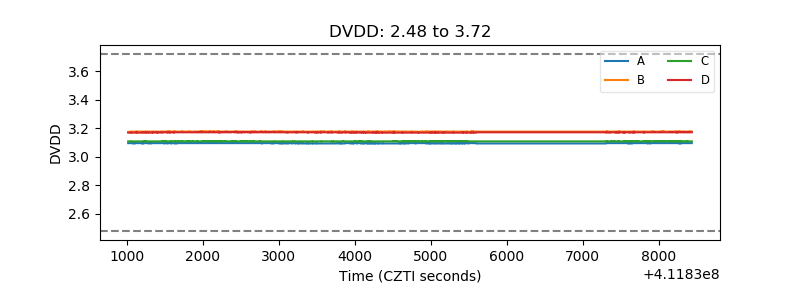 |
| Temperature 1 | 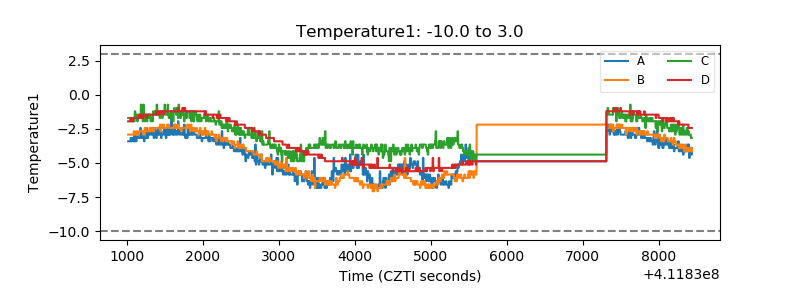 |
| Veto HV Monitor | 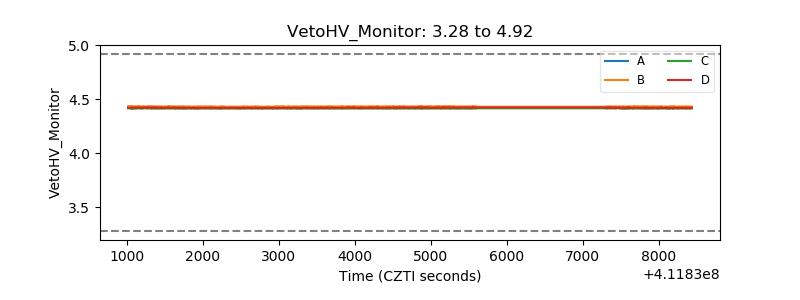 |
| Veto LLD | 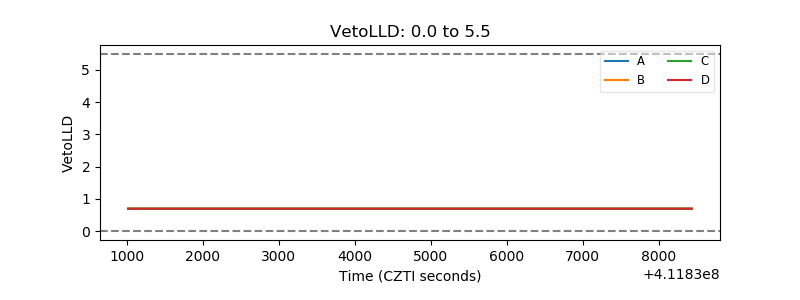 |
| Alpha Counter | 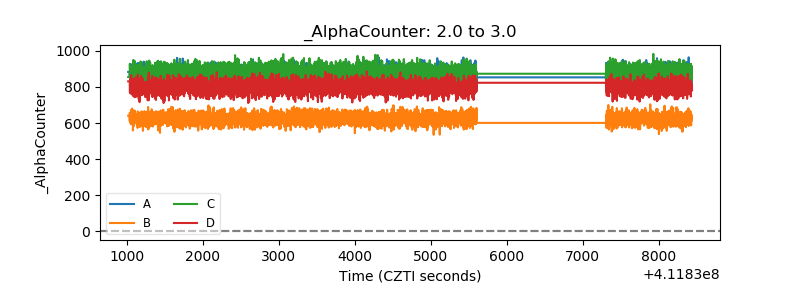 |
| _CPM_Rate | 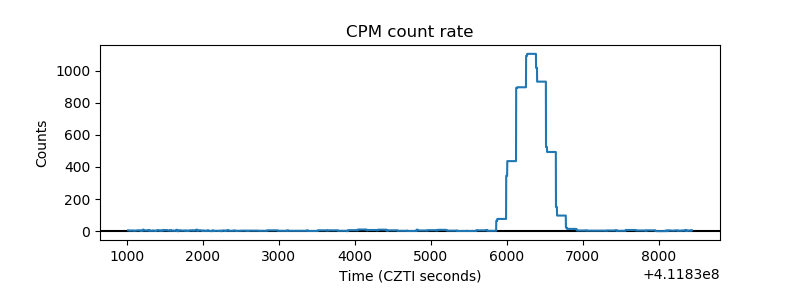 |
| CZT Counter | 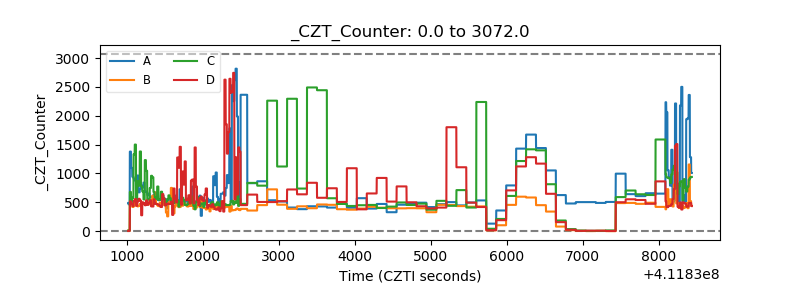 |
| +2.5 Volts monitor | 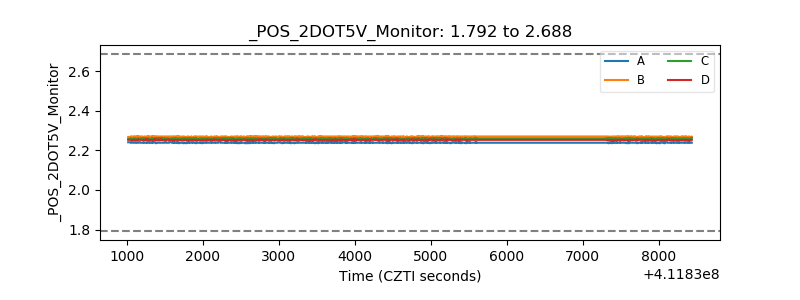 |
| +5 Volts monitor | 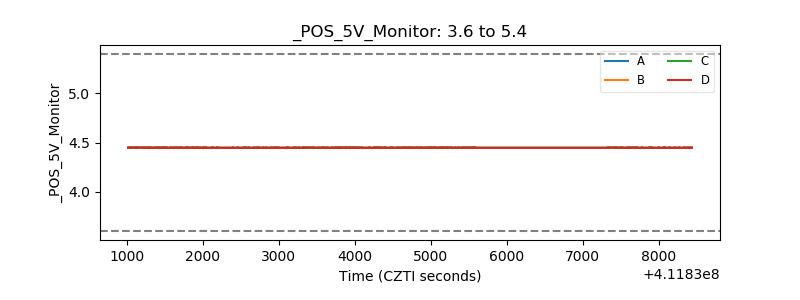 |
| _ROLL_ROT | 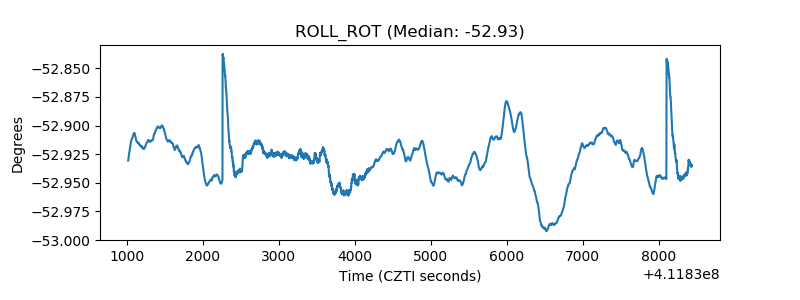 |
| _Roll_DEC | 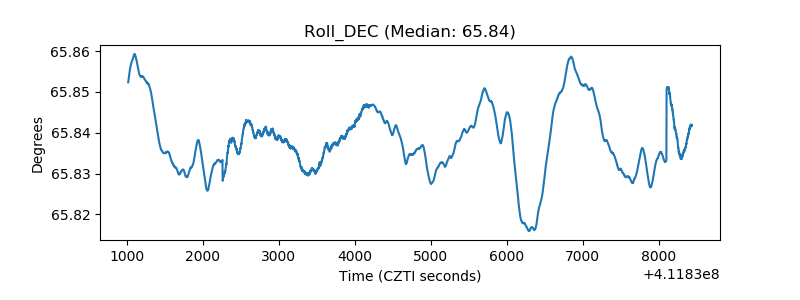 |
| _Roll_RA | 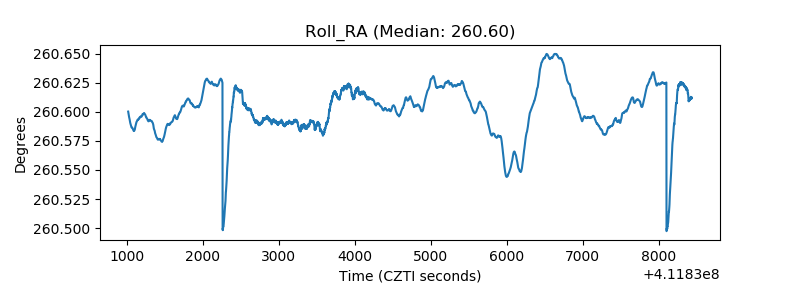 |
| Veto Counter | 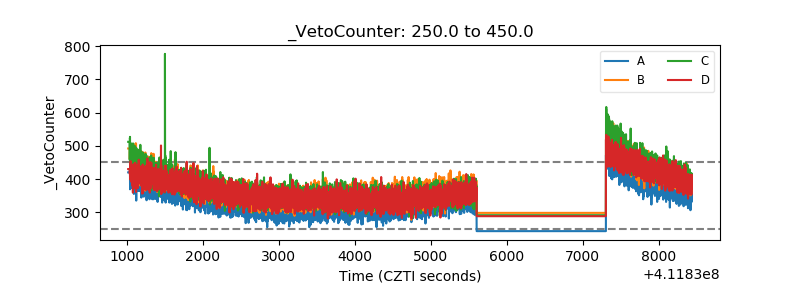 |