| Param | Original file | Final file |
|---|---|---|
| Filename | modeM0/AS1A12_018T01_9000005488_39531cztM0_level2.fits | modeM0/AS1A12_018T01_9000005488_39531cztM0_level2_quad_clean.evt |
| Size (bytes) | 361,575,360 | 86,771,520 |
| Size | 344.8 MB | 82.8 MB |
| Events in quadrant A | 3,133,914 | 589,684 |
| Events in quadrant B | 2,308,717 | 614,836 |
| Events in quadrant C | 4,973,750 | 522,000 |
| Events in quadrant D | 2,569,458 | 542,448 |
| Mode SS | |||
|---|---|---|---|
| Quadrant | BADHDUFLAG | Total packets | Discarded packets |
| A | 0 | 104 | 0 |
| B | 0 | 104 | 0 |
| C | 0 | 104 | 0 |
| D | 0 | 104 | 0 |
| Mode M0 | |||
|---|---|---|---|
| Quadrant | BADHDUFLAG | Total packets | Discarded packets |
| A | 0 | 12641 | 2 |
| B | 0 | 10507 | 1 |
| C | 0 | 18281 | 1 |
| D | 0 | 11200 | 1 |
| Mode M9 | |||
|---|---|---|---|
| Quadrant | BADHDUFLAG | Total packets | Discarded packets |
| A | 0 | 18 | 0 |
| B | 0 | 18 | 0 |
| C | 0 | 18 | 0 |
| D | 0 | 18 | 0 |
| Quadrant | Total seconds | Saturated seconds | Saturation percentage |
|---|---|---|---|
| A | 5117 | 136 | 2.657807% |
| B | 5117 | 13 | 0.254055% |
| C | 5117 | 623 | 12.175103% |
| D | 5117 | 39 | 0.762165% |
Noise dominated data is calculated using 1-second bins in cleaned event files. If a bin has >2000 counts, and if more than 50% of those come from <1% of pixels, then it is considered to be noise-dominated and hence unusable.
| Quadrant | # 1 sec bins | Bins with >0 counts | Bins with >2000 counts | High rate bins dominated by noise | Noise dominated (total time) | Noise dominated (detector-on time) | Marked lightcurve |
|---|---|---|---|---|---|---|---|
| A | 6941 | 5118 | 107 | 107 | 1.54% | 2.09% | 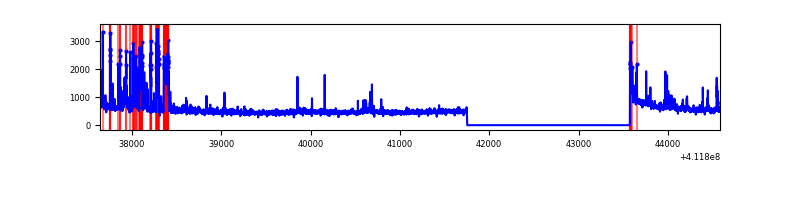 |
| B | 6941 | 5118 | 8 | 8 | 0.12% | 0.16% | 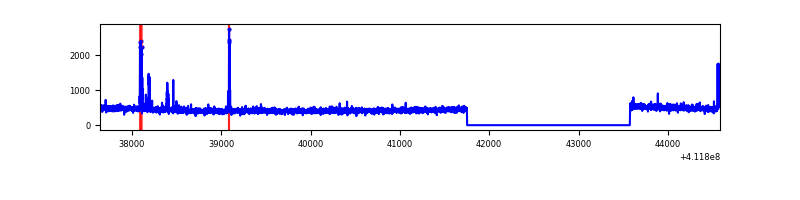 |
| C | 6941 | 5118 | 546 | 546 | 7.87% | 10.67% | 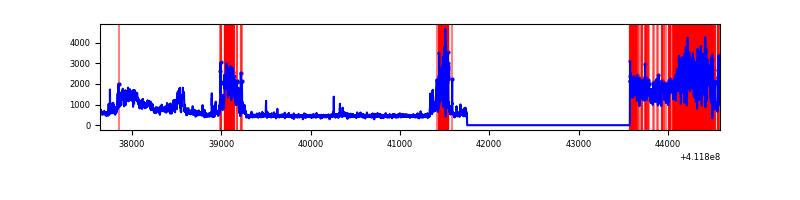 |
| D | 6941 | 5118 | 29 | 29 | 0.42% | 0.57% | 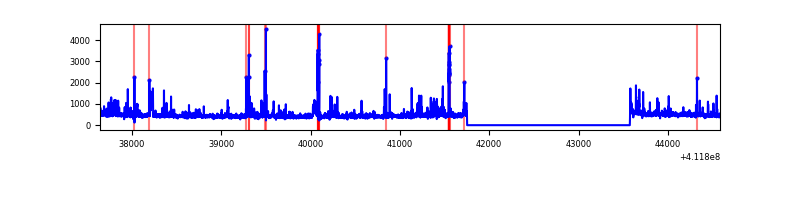 |
Top three noisy pixels from each quadrant. If the there are fewer than three noisy pixels in the level2.evt file, extra rows are filled as -1
| Pixel properties | Quadrant properties | ||||||
|---|---|---|---|---|---|---|---|
| Quadrant | DetID | PixID | Counts | Sigma | Mean | Median | Sigma |
| A | 10 | 83 | 359863 | 3144.88 | 563 | 551 | 114.3 |
| A | 13 | 248 | 303564 | 2652.12 | 563 | 551 | 114.3 |
| A | 15 | 222 | 282405 | 2466.93 | 563 | 551 | 114.3 |
| B | 15 | 85 | 67353 | 610.58 | 566 | 550 | 109.4 |
| B | 4 | 81 | 17443 | 154.4 | 566 | 550 | 109.4 |
| B | 12 | 111 | 13298 | 116.52 | 566 | 550 | 109.4 |
| C | 9 | 187 | 2644630 | 21080.26 | 538 | 540 | 125.4 |
| C | 15 | 214 | 215768 | 1715.93 | 538 | 540 | 125.4 |
| C | 0 | 10 | 10699 | 80.99 | 538 | 540 | 125.4 |
| D | 13 | 249 | 154961 | 1139.43 | 558 | 542 | 135.5 |
| D | 12 | 227 | 123599 | 908.01 | 558 | 542 | 135.5 |
| D | 2 | 249 | 62017 | 453.61 | 558 | 542 | 135.5 |
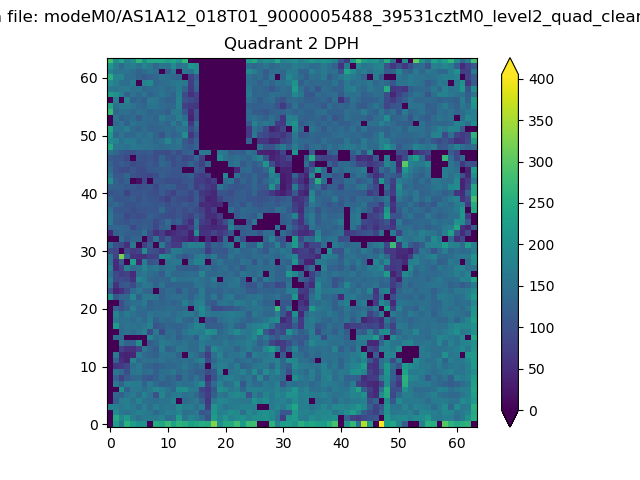
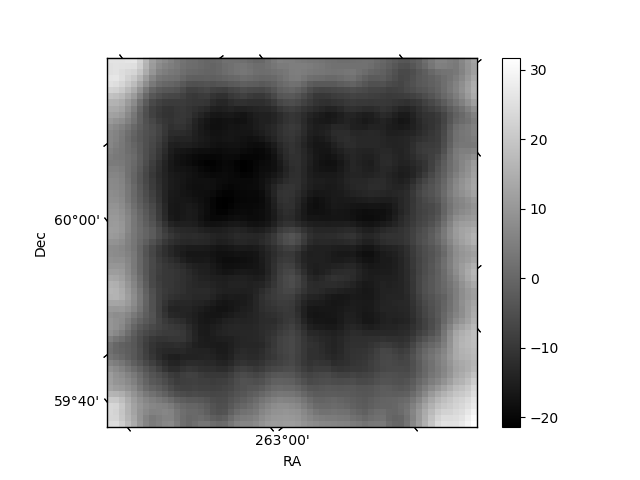
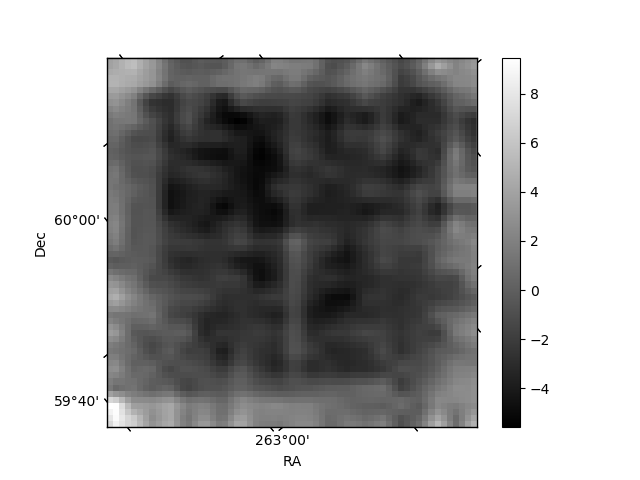
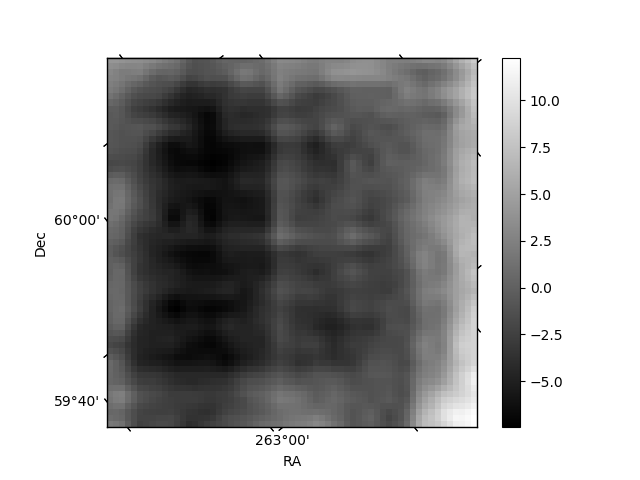
Histogram calculated using DETX and DETY for each event in the final _common_clean file
| Quadrant A | 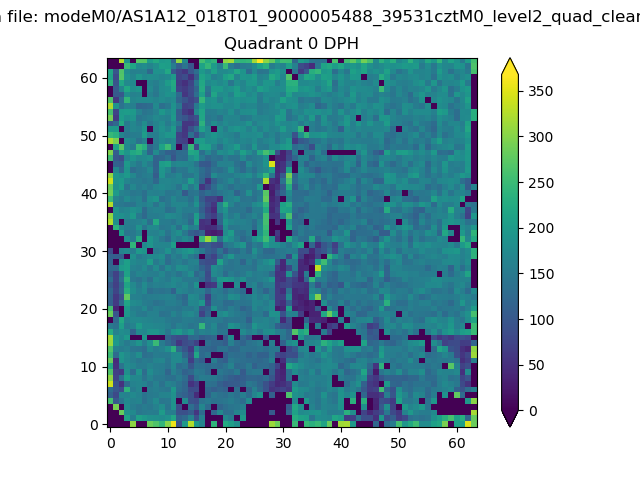 |
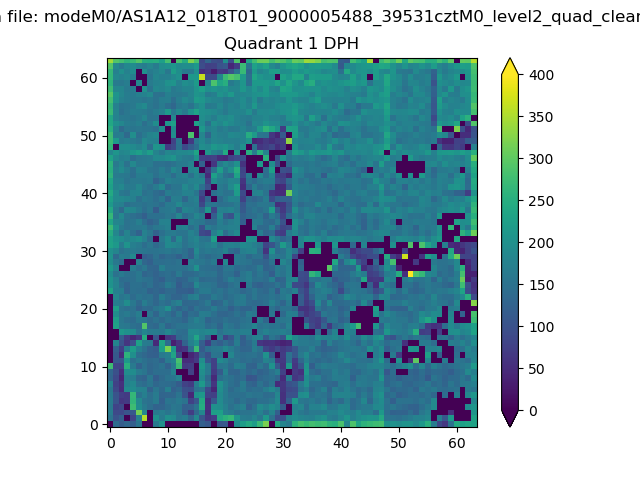 |
Quadrant B |
|---|---|---|---|
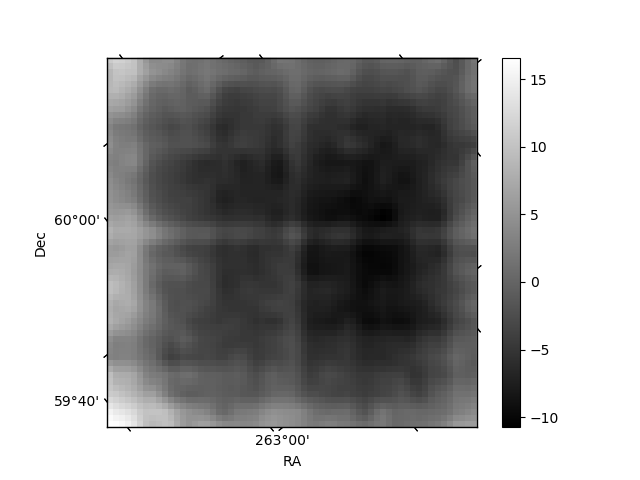
| Quadrant D | 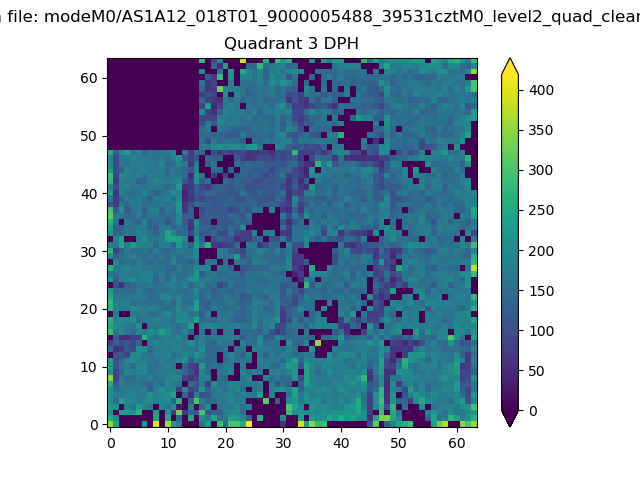 |
 |
Quadrant C |
| Plot type | Count rate plots | Images |
|---|---|---|
| Comparison with Poisson distribution Blue bars denote a histogram of data divided into 1 sec bins. Red curve is a Poisson curve with rate = median count rate of data. |
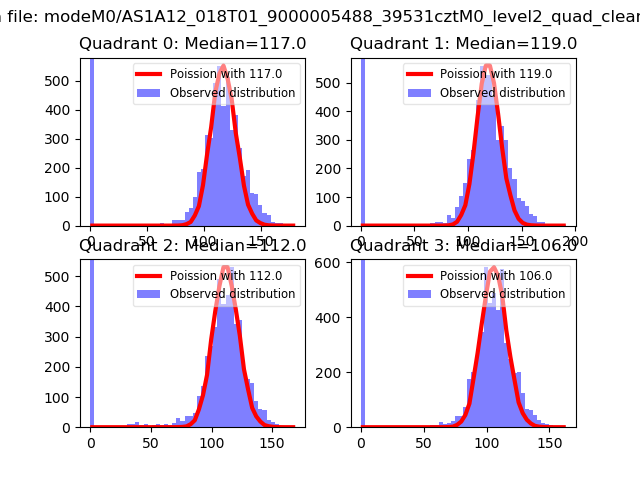 |
 |
| Quadrant-wise count rates Data is divided into 100 sec bins |
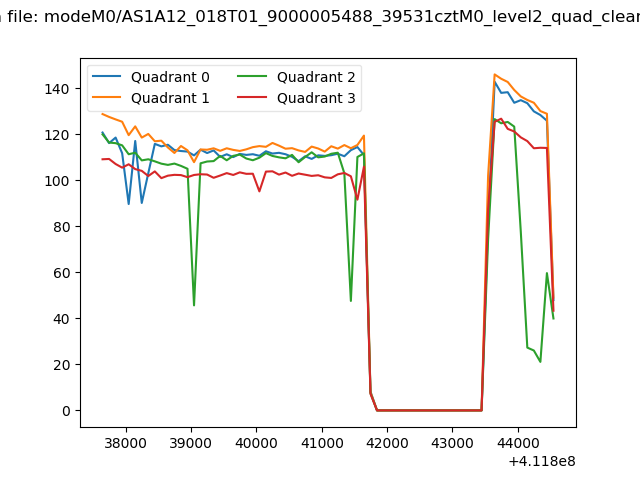 |
|
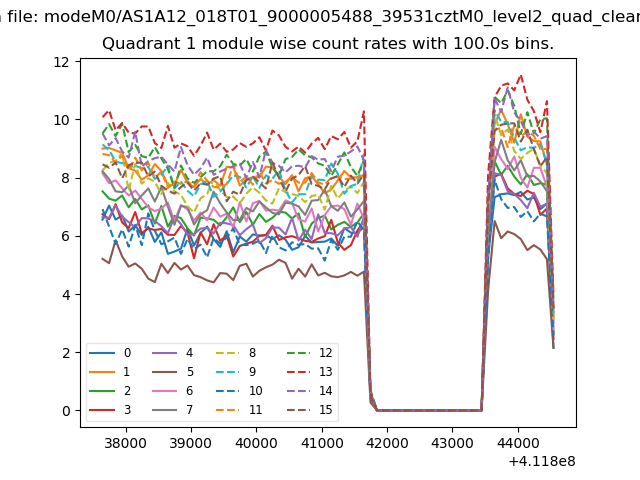
| Module-wise count rates for Quadrant A Data is divided into 100 sec bins |
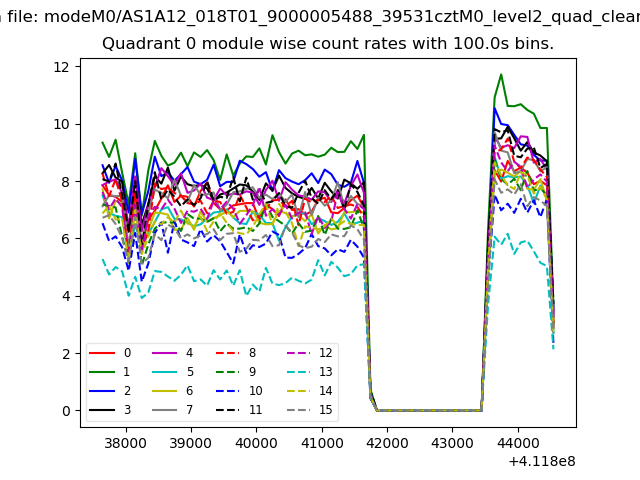 |
 |
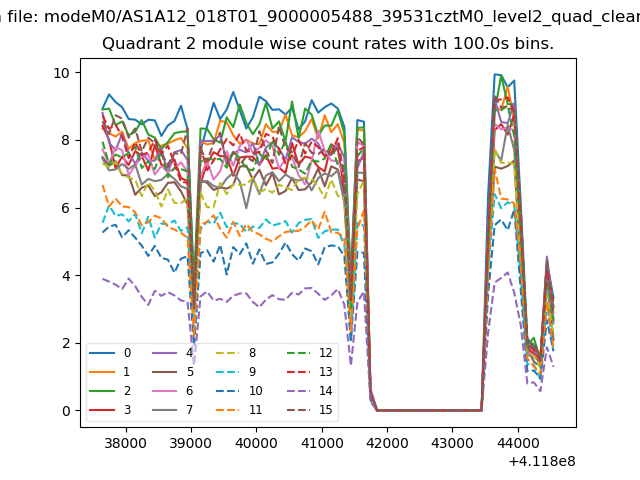
| Module-wise count rates for Quadrant B Data is divided into 100 sec bins |
 |
 |
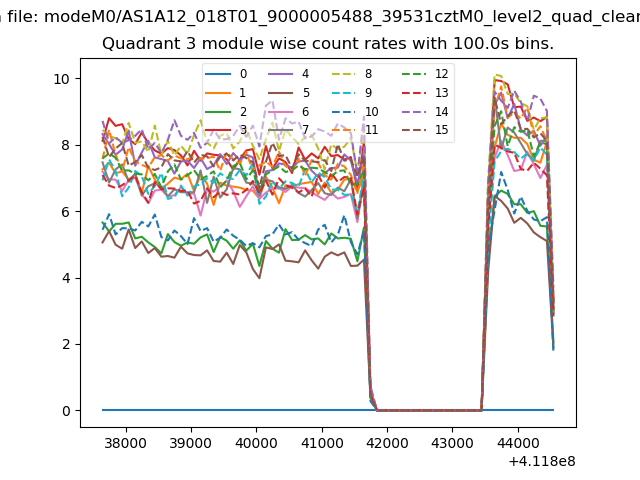
| Module-wise count rates for Quadrant C Data is divided into 100 sec bins |
 |
 |
| Module-wise count rates for Quadrant D Data is divided into 100 sec bins |
 |
 |
| Parameter | Plot |
|---|---|
| CZT HV Monitor | 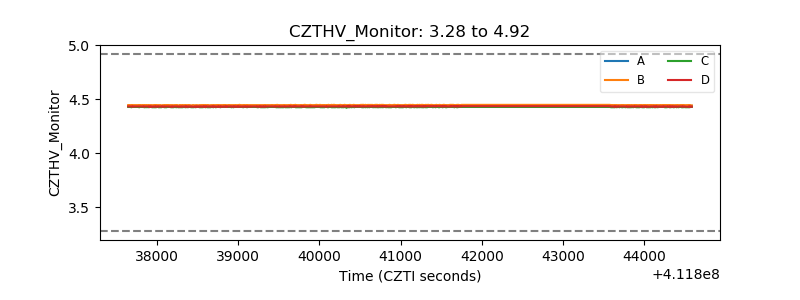 |
| D_VDD | 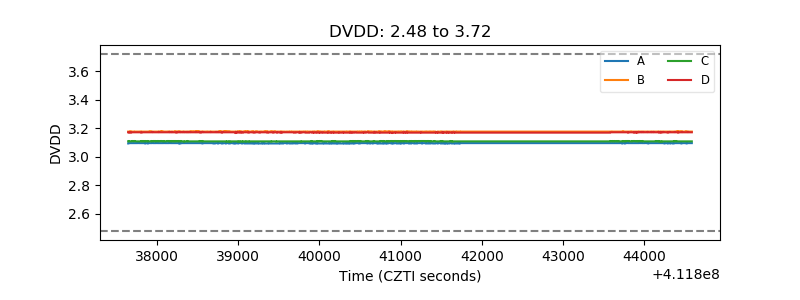 |
| Temperature 1 | 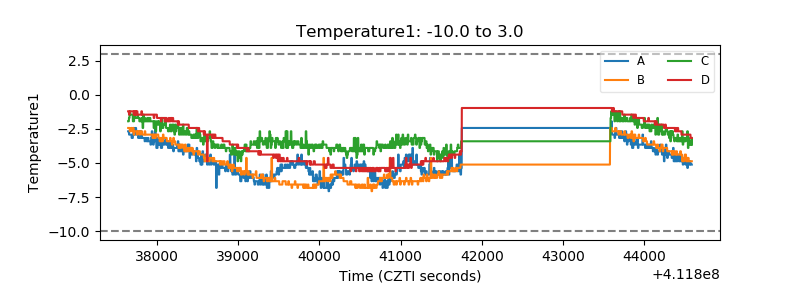 |
| Veto HV Monitor | 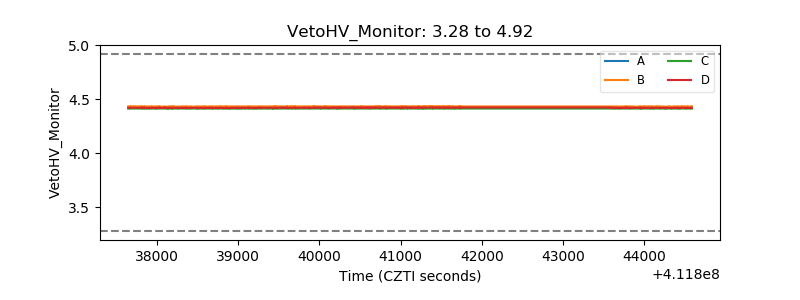 |
| Veto LLD | 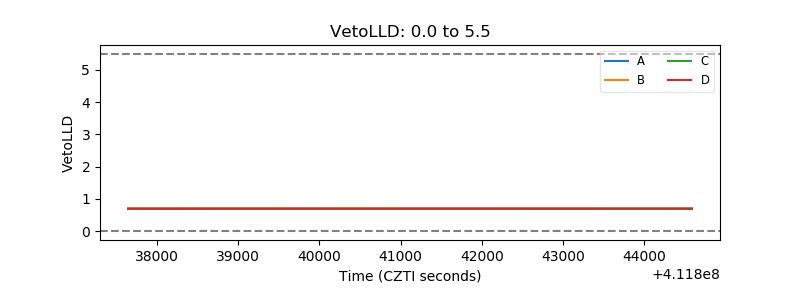 |
| Alpha Counter | 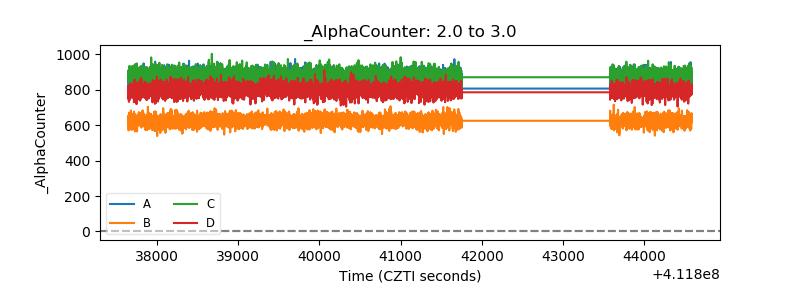 |
| _CPM_Rate | 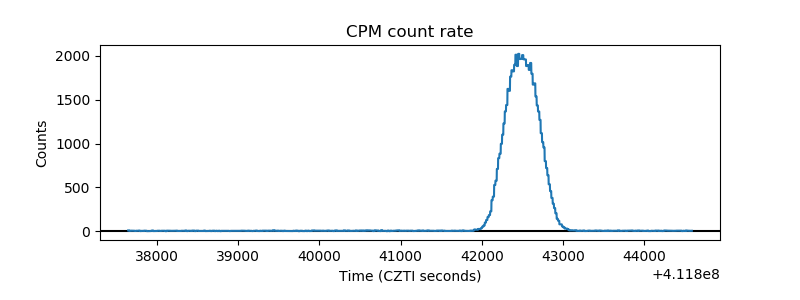 |
| CZT Counter | 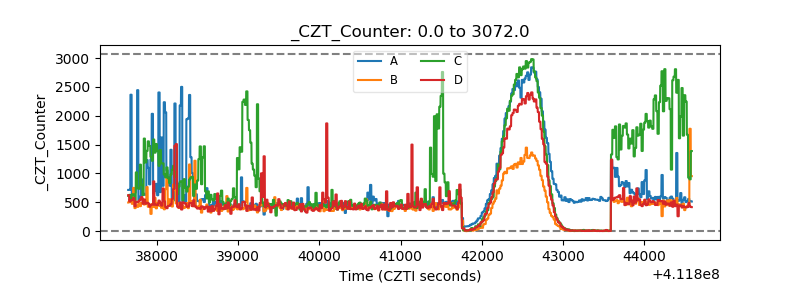 |
| +2.5 Volts monitor | 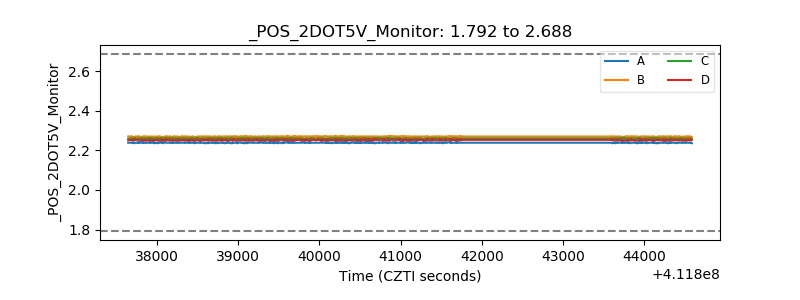 |
| +5 Volts monitor | 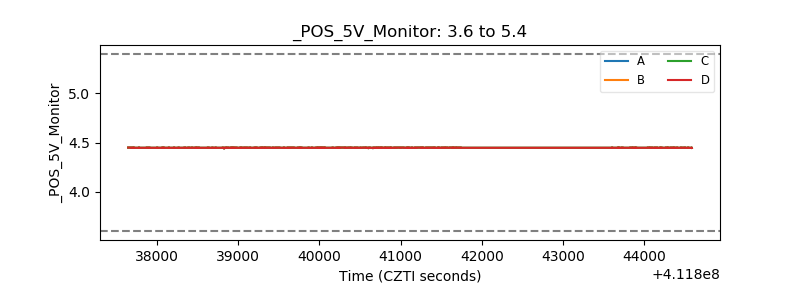 |
| _ROLL_ROT | 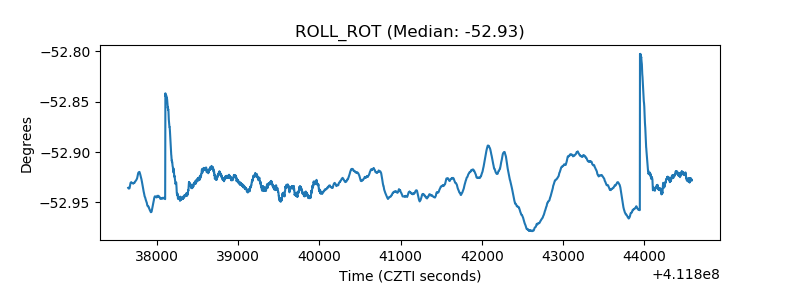 |
| _Roll_DEC | 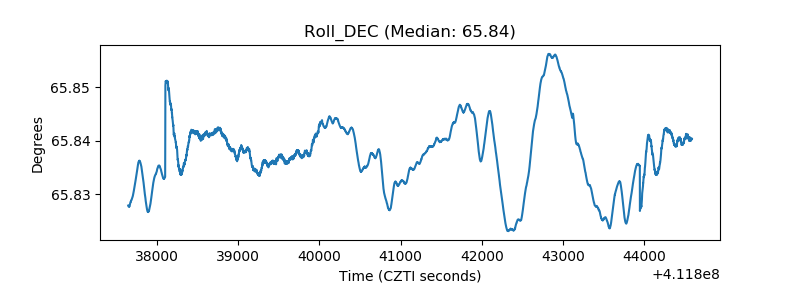 |
| _Roll_RA | 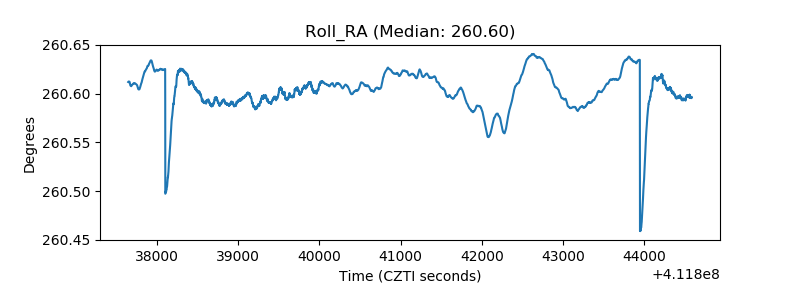 |
| Veto Counter | 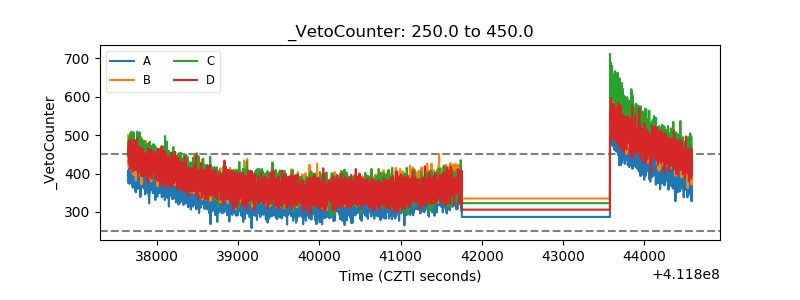 |