| Param | Original file | Final file |
|---|---|---|
| Filename | modeM0/AS1A12_018T01_9000005488_39532cztM0_level2.fits | modeM0/AS1A12_018T01_9000005488_39532cztM0_level2_quad_clean.evt |
| Size (bytes) | 364,556,160 | 86,883,840 |
| Size | 347.7 MB | 82.9 MB |
| Events in quadrant A | 2,835,722 | 607,987 |
| Events in quadrant B | 2,254,081 | 627,592 |
| Events in quadrant C | 5,492,795 | 492,863 |
| Events in quadrant D | 2,525,711 | 554,831 |
| Mode SS | |||
|---|---|---|---|
| Quadrant | BADHDUFLAG | Total packets | Discarded packets |
| A | 0 | 100 | 0 |
| B | 0 | 100 | 0 |
| C | 0 | 100 | 0 |
| D | 0 | 100 | 0 |
| Mode M0 | |||
|---|---|---|---|
| Quadrant | BADHDUFLAG | Total packets | Discarded packets |
| A | 0 | 11562 | 2 |
| B | 0 | 10078 | 1 |
| C | 0 | 19688 | 1 |
| D | 0 | 10933 | 1 |
| Mode M9 | |||
|---|---|---|---|
| Quadrant | BADHDUFLAG | Total packets | Discarded packets |
| A | 0 | 20 | 0 |
| B | 0 | 20 | 0 |
| C | 0 | 20 | 0 |
| D | 0 | 20 | 0 |
| Quadrant | Total seconds | Saturated seconds | Saturation percentage |
|---|---|---|---|
| A | 4960 | 24 | 0.483871% |
| B | 4960 | 6 | 0.120968% |
| C | 4960 | 985 | 19.858871% |
| D | 4960 | 25 | 0.504032% |
Noise dominated data is calculated using 1-second bins in cleaned event files. If a bin has >2000 counts, and if more than 50% of those come from <1% of pixels, then it is considered to be noise-dominated and hence unusable.
| Quadrant | # 1 sec bins | Bins with >0 counts | Bins with >2000 counts | High rate bins dominated by noise | Noise dominated (total time) | Noise dominated (detector-on time) | Marked lightcurve |
|---|---|---|---|---|---|---|---|
| A | 6934 | 4961 | 15 | 15 | 0.22% | 0.30% | 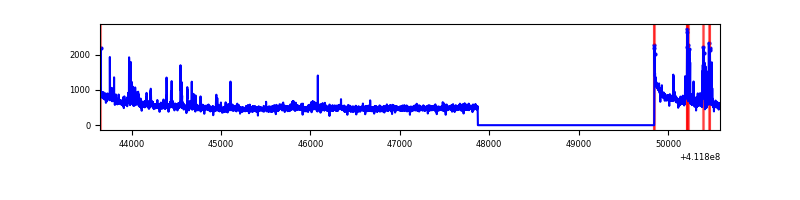 |
| B | 6934 | 4961 | 1 | 1 | 0.01% | 0.02% | 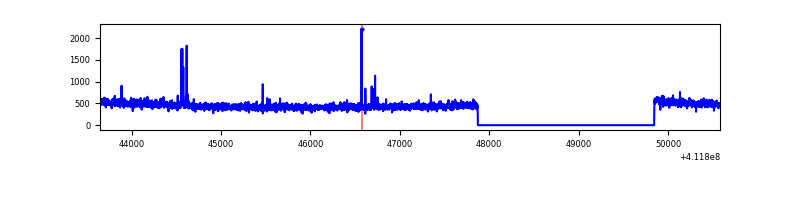 |
| C | 6934 | 4961 | 870 | 870 | 12.55% | 17.54% | 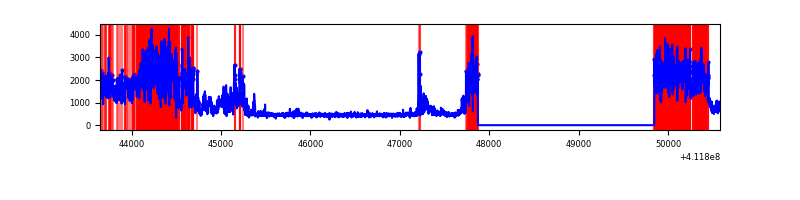 |
| D | 6934 | 4961 | 25 | 25 | 0.36% | 0.50% | 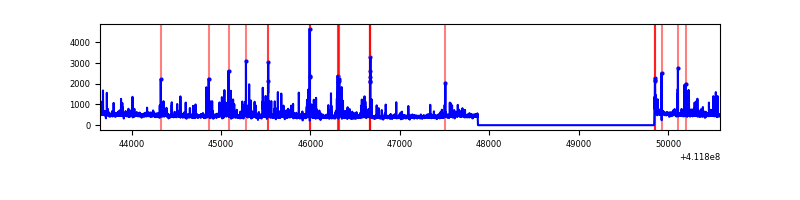 |
Top three noisy pixels from each quadrant. If the there are fewer than three noisy pixels in the level2.evt file, extra rows are filled as -1
| Pixel properties | Quadrant properties | ||||||
|---|---|---|---|---|---|---|---|
| Quadrant | DetID | PixID | Counts | Sigma | Mean | Median | Sigma |
| A | 10 | 83 | 382485 | 3408.06 | 562 | 553 | 112.1 |
| A | 13 | 248 | 209281 | 1862.53 | 562 | 553 | 112.1 |
| A | 15 | 222 | 53741 | 474.61 | 562 | 553 | 112.1 |
| B | 15 | 85 | 27818 | 254.46 | 563 | 548 | 107.2 |
| B | 12 | 111 | 13030 | 116.47 | 563 | 548 | 107.2 |
| B | 11 | 111 | 11736 | 104.39 | 563 | 548 | 107.2 |
| C | 9 | 187 | 3230986 | 26442.74 | 523 | 525 | 122.2 |
| C | 15 | 214 | 208227 | 1700.13 | 523 | 525 | 122.2 |
| C | 0 | 10 | 9313 | 71.93 | 523 | 525 | 122.2 |
| D | 2 | 249 | 147199 | 1086.97 | 556 | 540 | 134.9 |
| D | 12 | 227 | 101136 | 745.57 | 556 | 540 | 134.9 |
| D | 13 | 249 | 84190 | 619.98 | 556 | 540 | 134.9 |
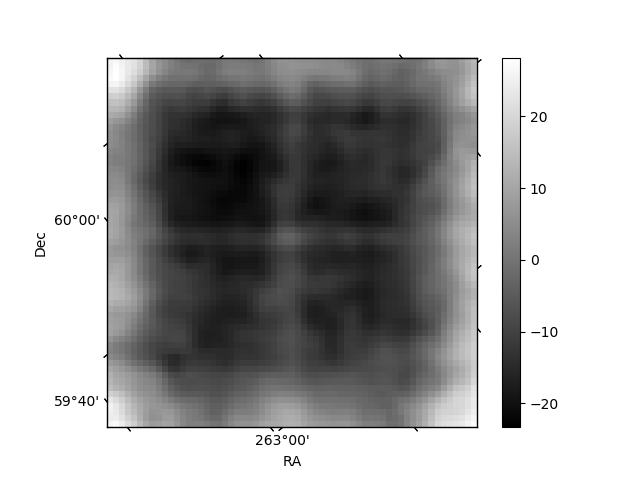
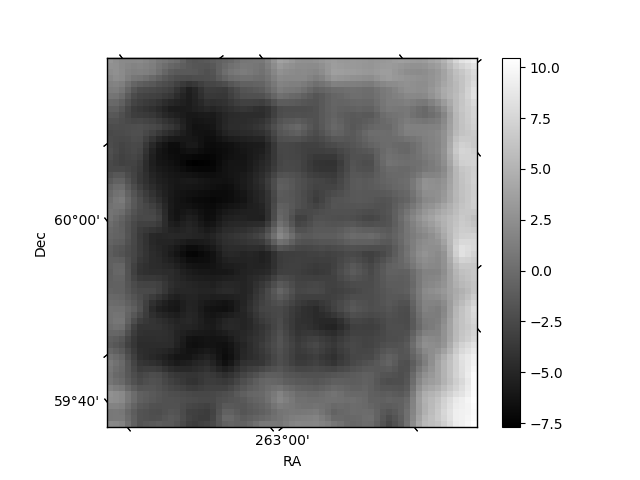
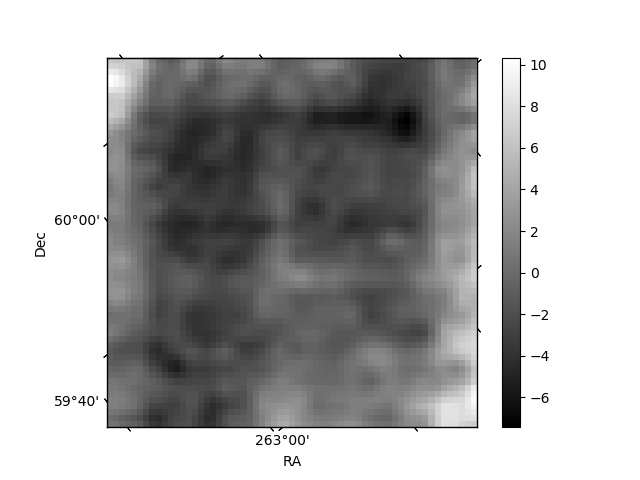
Histogram calculated using DETX and DETY for each event in the final _common_clean file
| Quadrant A | 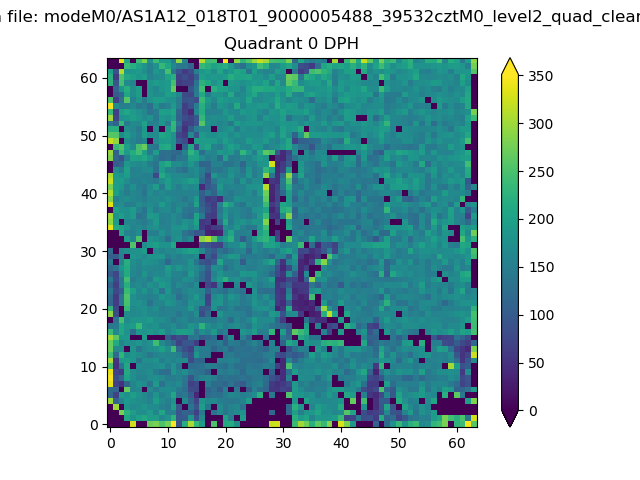 |
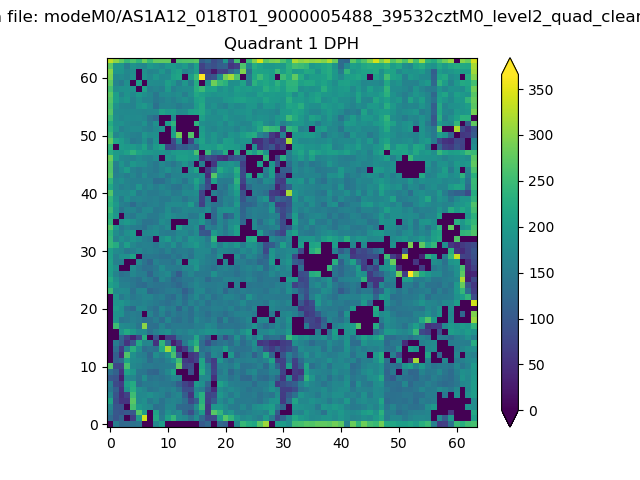 |
Quadrant B |
|---|---|---|---|
| Quadrant D | 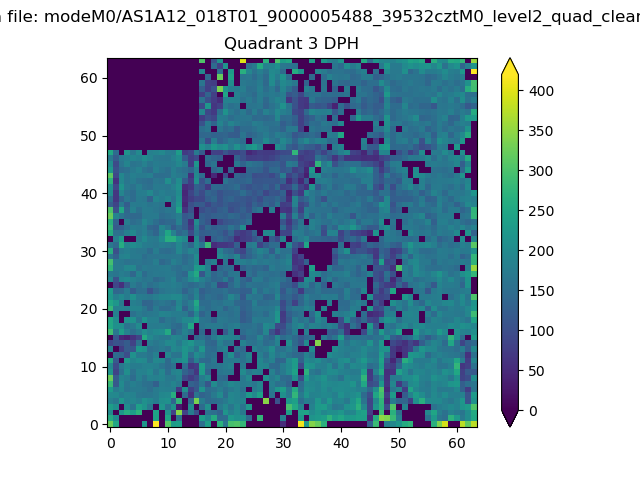 |
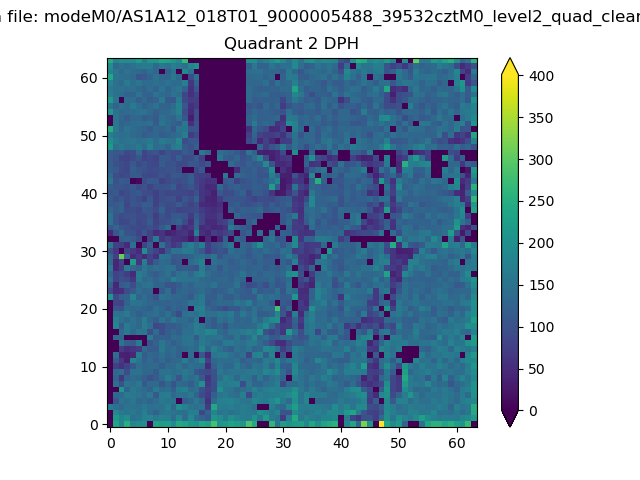 |
Quadrant C |
| Plot type | Count rate plots | Images |
|---|---|---|
| Comparison with Poisson distribution Blue bars denote a histogram of data divided into 1 sec bins. Red curve is a Poisson curve with rate = median count rate of data. |
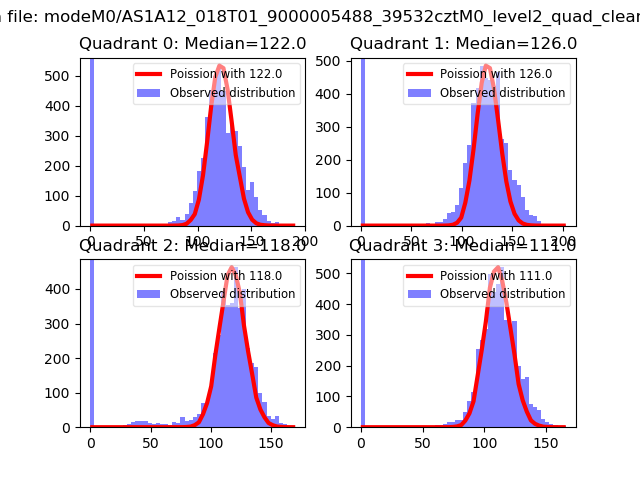 |
 |
| Quadrant-wise count rates Data is divided into 100 sec bins |
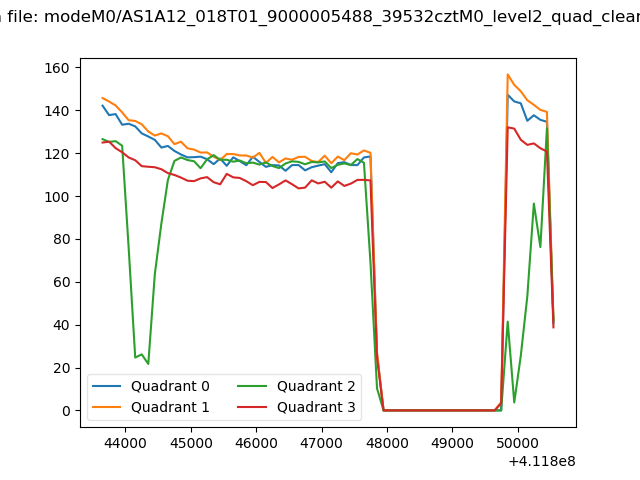 |
|
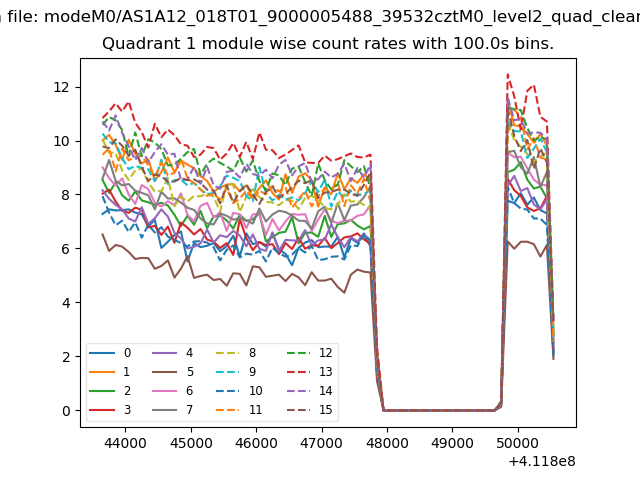
| Module-wise count rates for Quadrant A Data is divided into 100 sec bins |
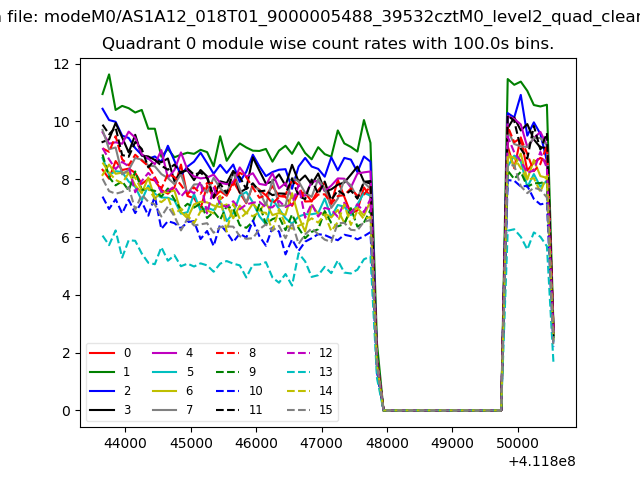 |
 |
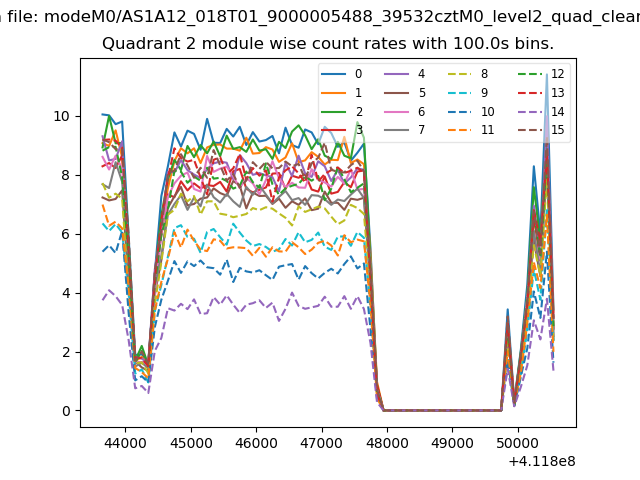
| Module-wise count rates for Quadrant B Data is divided into 100 sec bins |
 |
 |
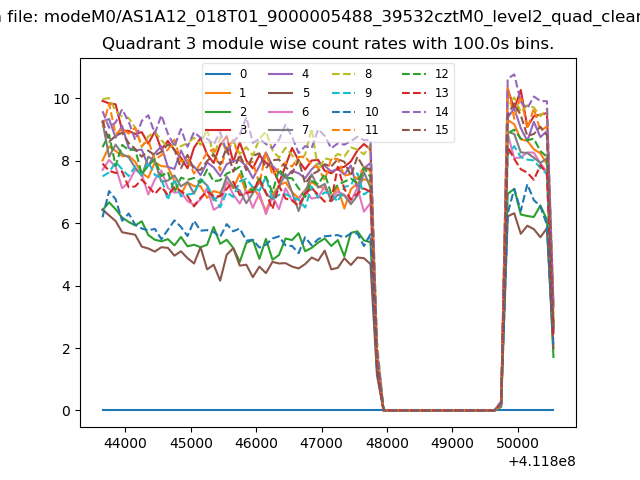
| Module-wise count rates for Quadrant C Data is divided into 100 sec bins |
 |
 |
| Module-wise count rates for Quadrant D Data is divided into 100 sec bins |
 |
 |
| Parameter | Plot |
|---|---|
| CZT HV Monitor | 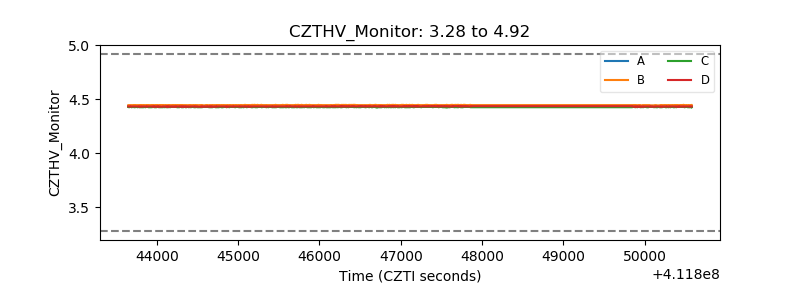 |
| D_VDD | 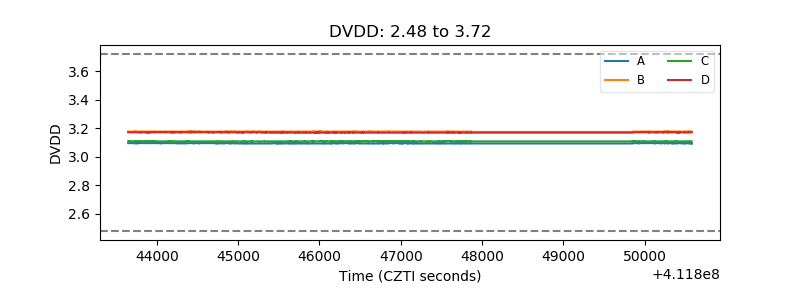 |
| Temperature 1 | 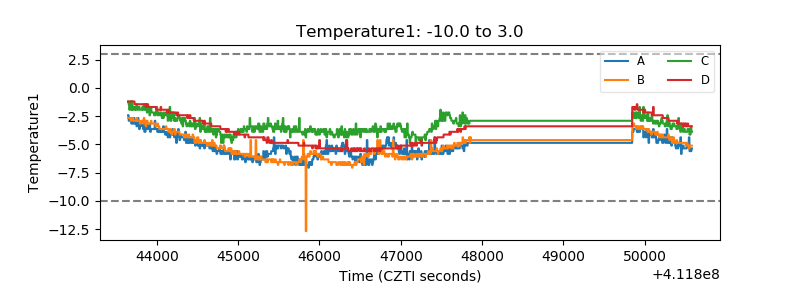 |
| Veto HV Monitor |  |
| Veto LLD | 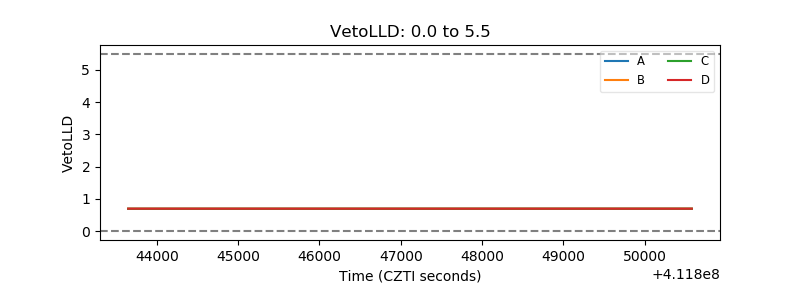 |
| Alpha Counter |  |
| _CPM_Rate | 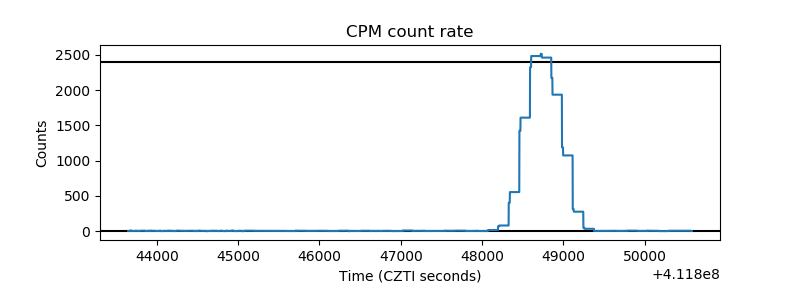 |
| CZT Counter | 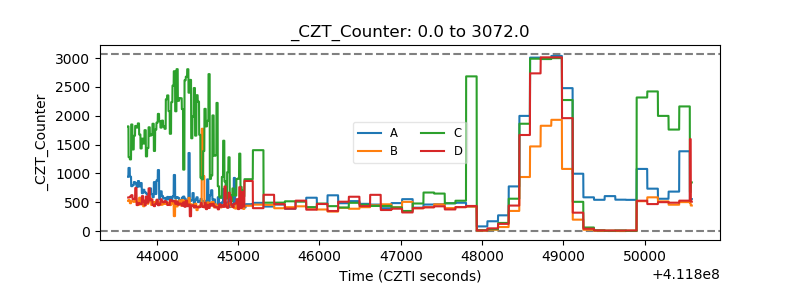 |
| +2.5 Volts monitor | 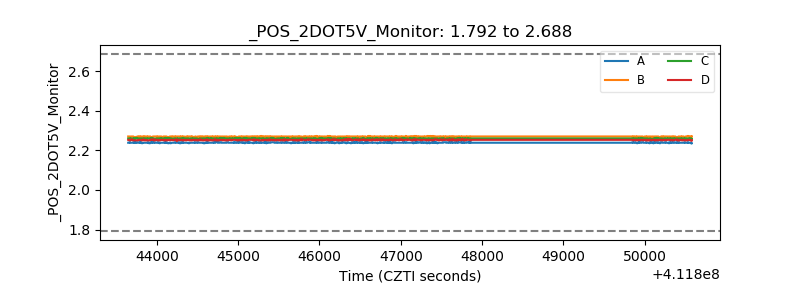 |
| +5 Volts monitor | 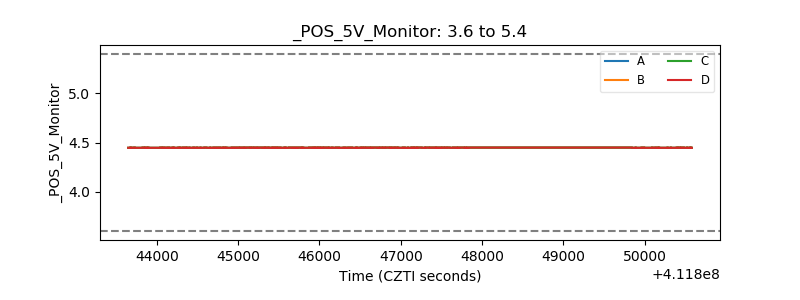 |
| _ROLL_ROT | 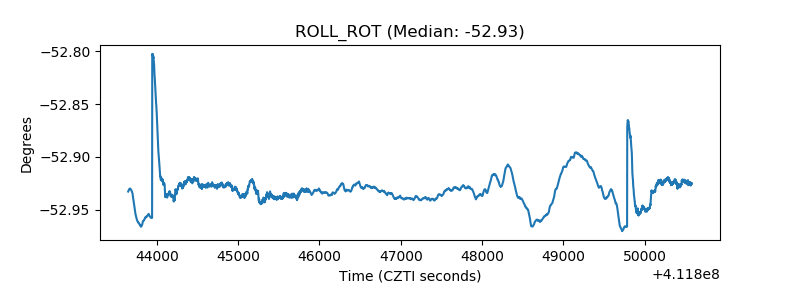 |
| _Roll_DEC | 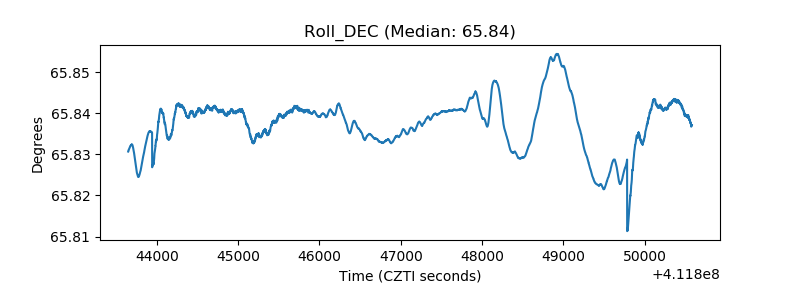 |
| _Roll_RA | 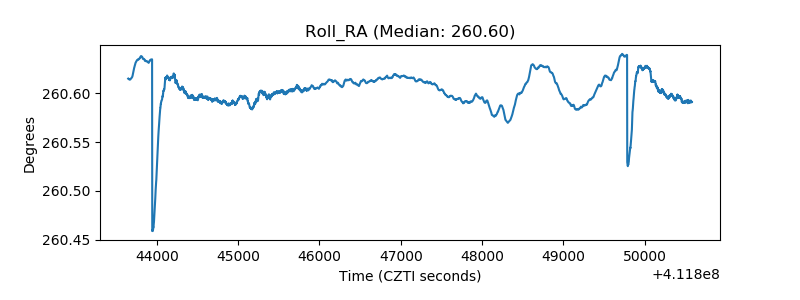 |
| Veto Counter | 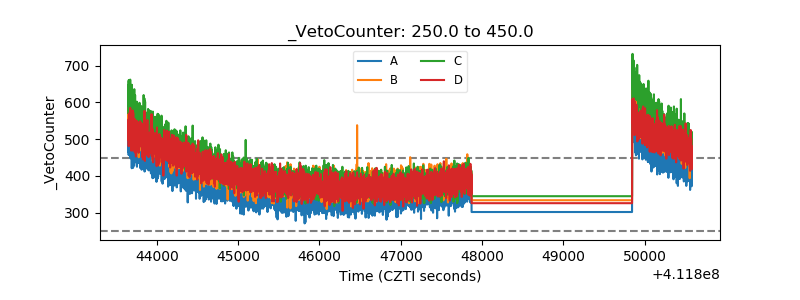 |