| Param | Original file | Final file |
|---|---|---|
| Filename | modeM0/AS1A12_018T01_9000005488_39533cztM0_level2.fits | modeM0/AS1A12_018T01_9000005488_39533cztM0_level2_quad_clean.evt |
| Size (bytes) | 340,646,400 | 88,966,080 |
| Size | 324.9 MB | 84.8 MB |
| Events in quadrant A | 2,809,632 | 617,442 |
| Events in quadrant B | 2,237,917 | 639,702 |
| Events in quadrant C | 3,951,984 | 550,691 |
| Events in quadrant D | 3,227,670 | 542,181 |
| Mode SS | |||
|---|---|---|---|
| Quadrant | BADHDUFLAG | Total packets | Discarded packets |
| A | 0 | 100 | 0 |
| B | 0 | 100 | 0 |
| C | 0 | 100 | 0 |
| D | 0 | 100 | 0 |
| Mode M0 | |||
|---|---|---|---|
| Quadrant | BADHDUFLAG | Total packets | Discarded packets |
| A | 0 | 11494 | 3 |
| B | 0 | 9889 | 2 |
| C | 0 | 14885 | 2 |
| D | 0 | 12936 | 2 |
| Mode M9 | |||
|---|---|---|---|
| Quadrant | BADHDUFLAG | Total packets | Discarded packets |
| A | 0 | 23 | 0 |
| B | 0 | 23 | 0 |
| C | 0 | 23 | 0 |
| D | 0 | 24 | 0 |
| Quadrant | Total seconds | Saturated seconds | Saturation percentage |
|---|---|---|---|
| A | 4906 | 22 | 0.448430% |
| B | 4906 | 3 | 0.061150% |
| C | 4906 | 537 | 10.945781% |
| D | 4906 | 269 | 5.483082% |
Noise dominated data is calculated using 1-second bins in cleaned event files. If a bin has >2000 counts, and if more than 50% of those come from <1% of pixels, then it is considered to be noise-dominated and hence unusable.
| Quadrant | # 1 sec bins | Bins with >0 counts | Bins with >2000 counts | High rate bins dominated by noise | Noise dominated (total time) | Noise dominated (detector-on time) | Marked lightcurve |
|---|---|---|---|---|---|---|---|
| A | 6970 | 4907 | 17 | 17 | 0.24% | 0.35% | 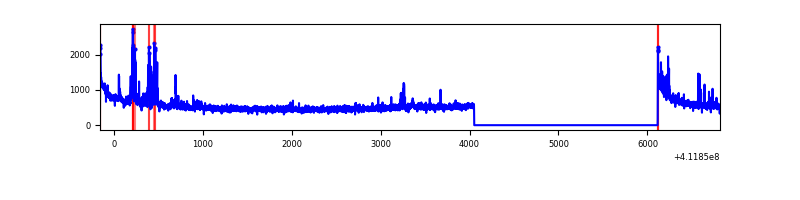 |
| B | 6970 | 4907 | 0 | 0 | 0.00% | 0.00% | 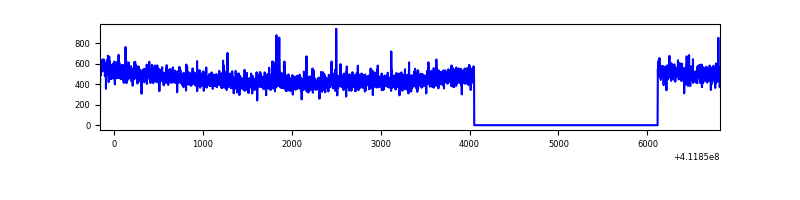 |
| C | 6970 | 4907 | 473 | 473 | 6.79% | 9.64% | 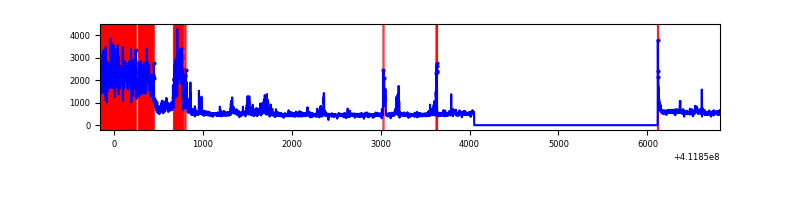 |
| D | 6970 | 4907 | 248 | 248 | 3.56% | 5.05% | 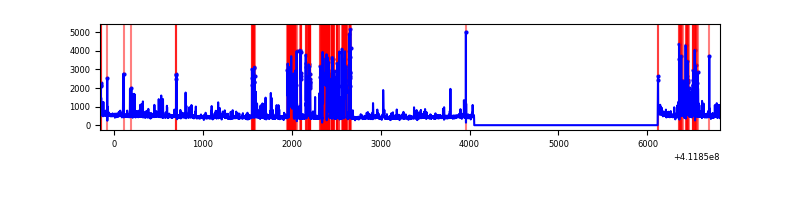 |
Top three noisy pixels from each quadrant. If the there are fewer than three noisy pixels in the level2.evt file, extra rows are filled as -1
| Pixel properties | Quadrant properties | ||||||
|---|---|---|---|---|---|---|---|
| Quadrant | DetID | PixID | Counts | Sigma | Mean | Median | Sigma |
| A | 10 | 83 | 412793 | 3670.42 | 561 | 551 | 112.3 |
| A | 13 | 248 | 193431 | 1717.32 | 561 | 551 | 112.3 |
| A | 2 | 79 | 12674 | 107.94 | 561 | 551 | 112.3 |
| B | 12 | 111 | 12785 | 115.02 | 564 | 551 | 106.4 |
| B | 0 | 213 | 12044 | 108.05 | 564 | 551 | 106.4 |
| B | 11 | 111 | 11767 | 105.45 | 564 | 551 | 106.4 |
| C | 9 | 187 | 1600067 | 12996.83 | 538 | 541 | 123.1 |
| C | 15 | 214 | 212988 | 1726.22 | 538 | 541 | 123.1 |
| C | 0 | 10 | 34377 | 274.93 | 538 | 541 | 123.1 |
| D | 13 | 249 | 761222 | 5741.57 | 543 | 528 | 132.5 |
| D | 12 | 227 | 146257 | 1099.93 | 543 | 528 | 132.5 |
| D | 5 | 32 | 135107 | 1015.77 | 543 | 528 | 132.5 |
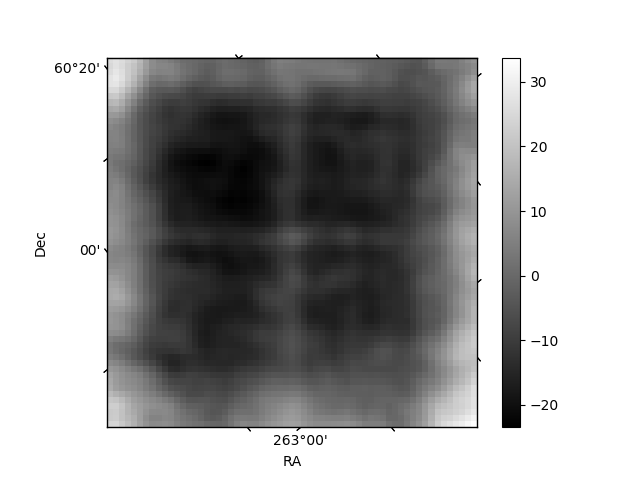
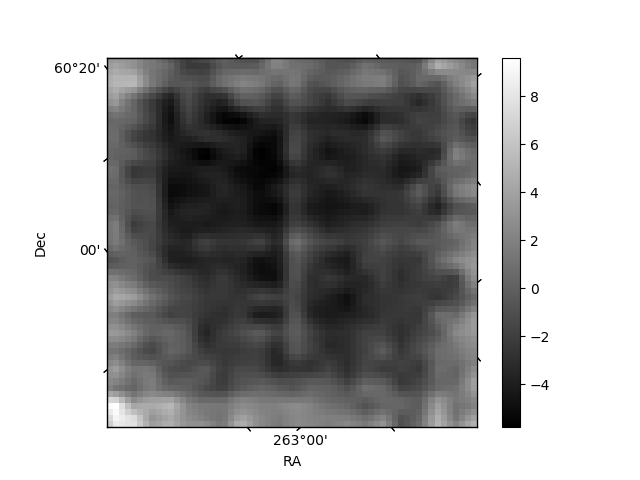
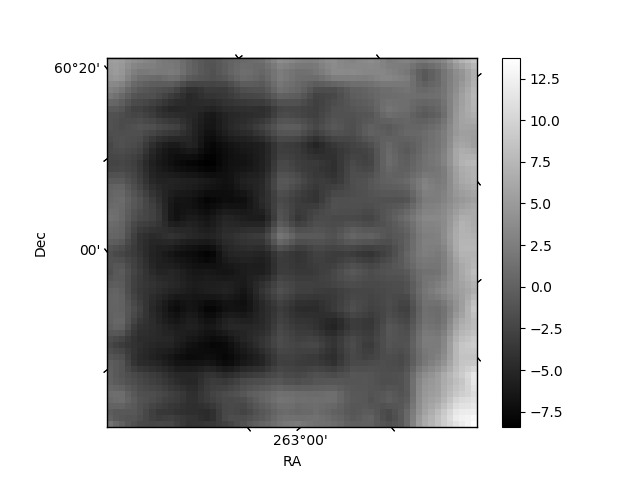
Histogram calculated using DETX and DETY for each event in the final _common_clean file
| Quadrant A | 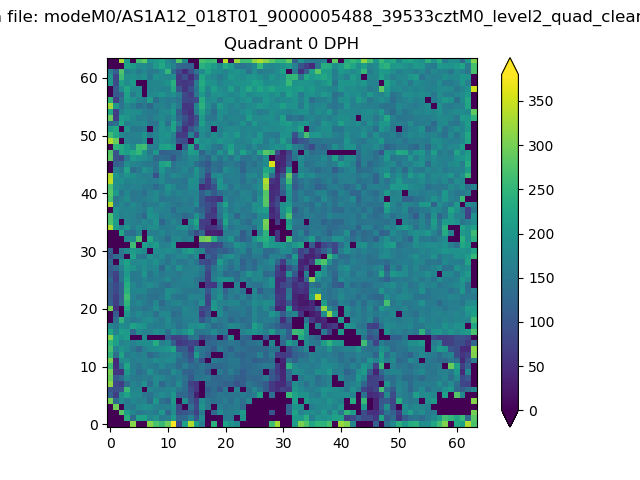 |
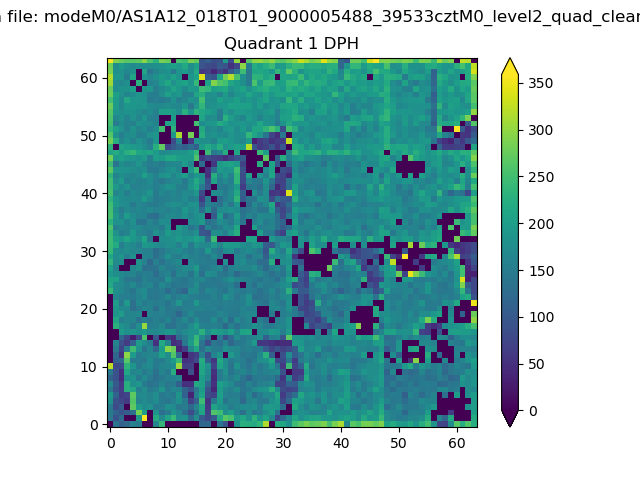 |
Quadrant B |
|---|---|---|---|
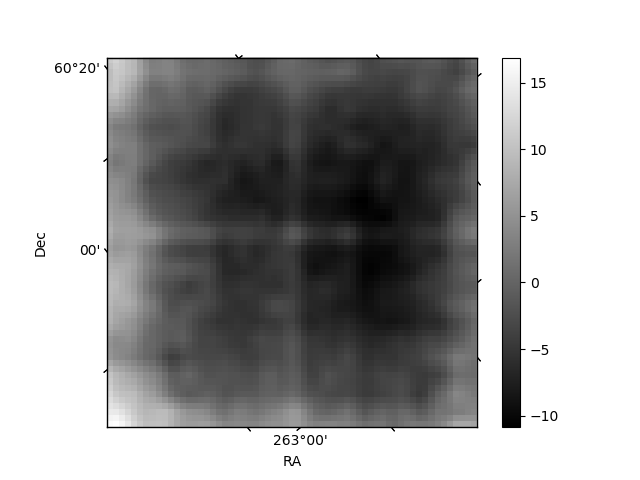
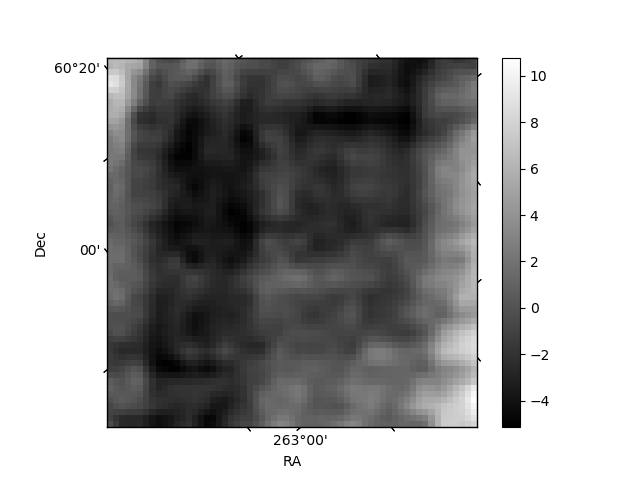
| Quadrant D | 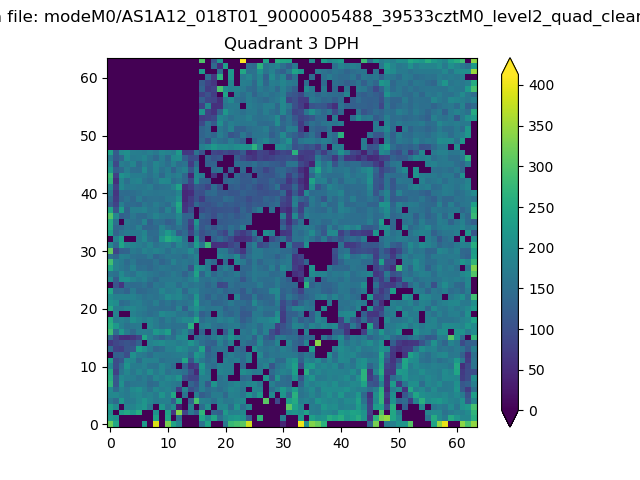 |
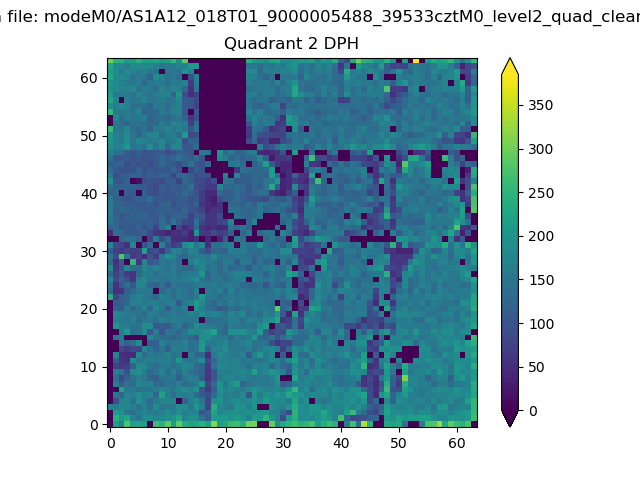 |
Quadrant C |
| Plot type | Count rate plots | Images |
|---|---|---|
| Comparison with Poisson distribution Blue bars denote a histogram of data divided into 1 sec bins. Red curve is a Poisson curve with rate = median count rate of data. |
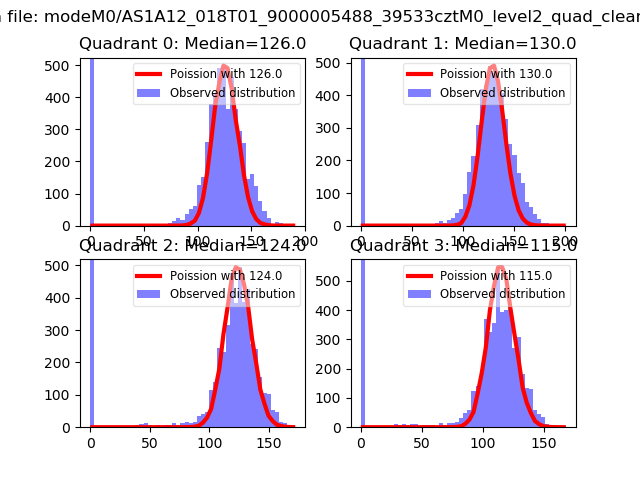 |
 |
| Quadrant-wise count rates Data is divided into 100 sec bins |
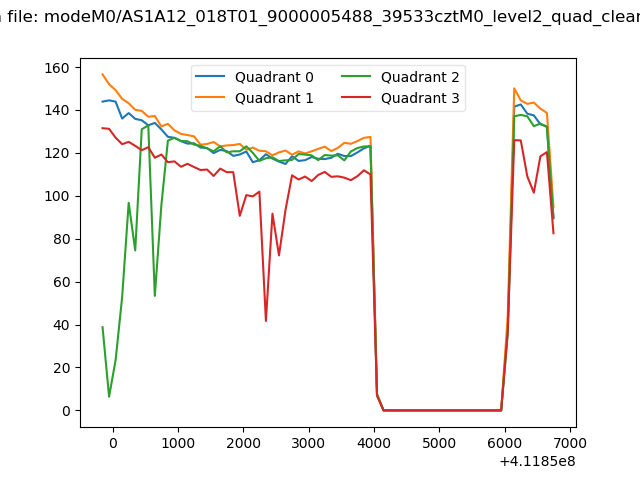 |
|
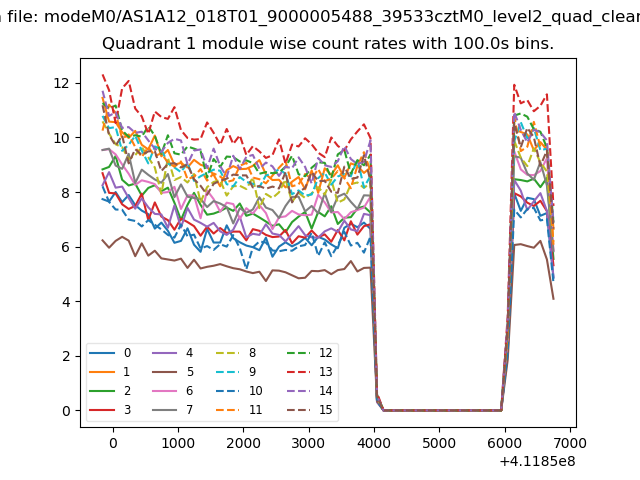
| Module-wise count rates for Quadrant A Data is divided into 100 sec bins |
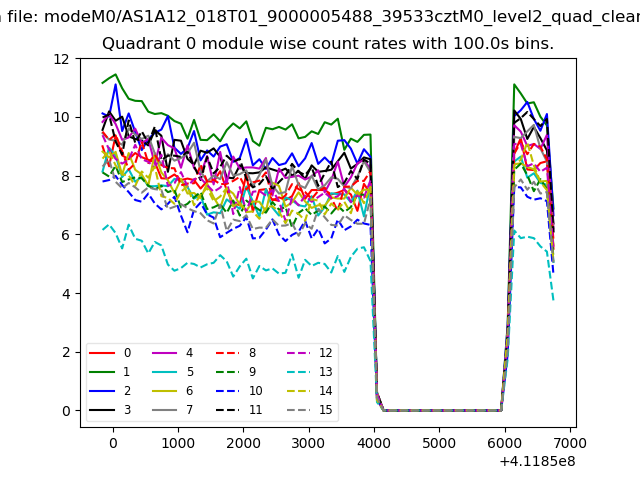 |
 |
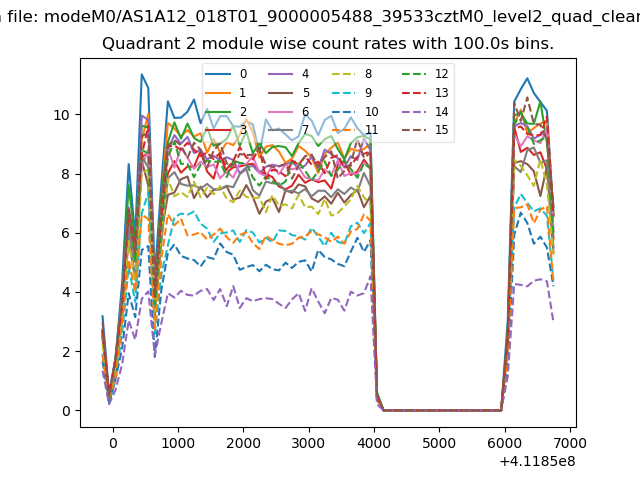
| Module-wise count rates for Quadrant B Data is divided into 100 sec bins |
 |
 |
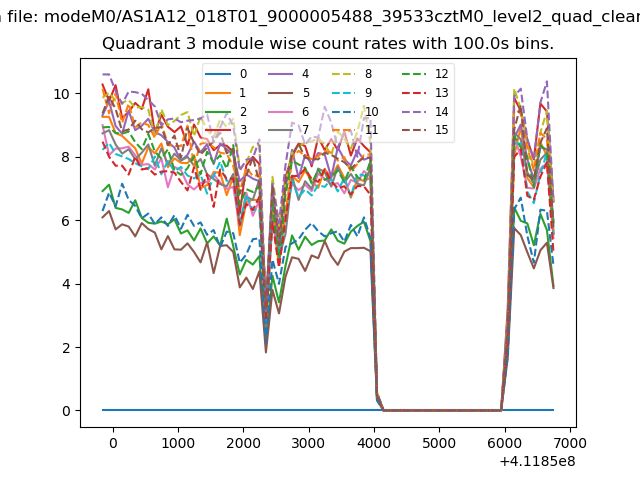
| Module-wise count rates for Quadrant C Data is divided into 100 sec bins |
 |
 |
| Module-wise count rates for Quadrant D Data is divided into 100 sec bins |
 |
 |
| Parameter | Plot |
|---|---|
| CZT HV Monitor | 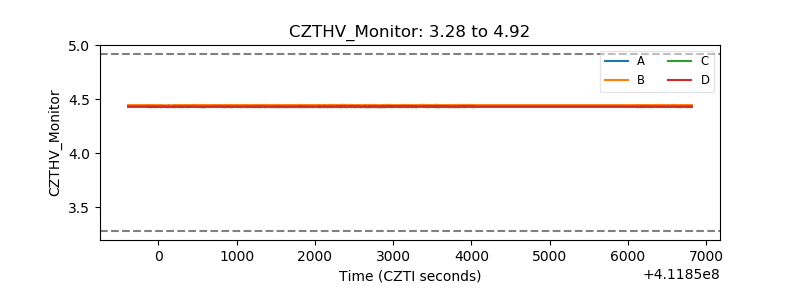 |
| D_VDD | 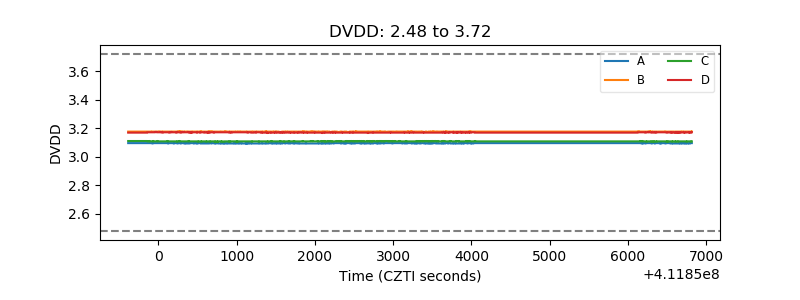 |
| Temperature 1 | 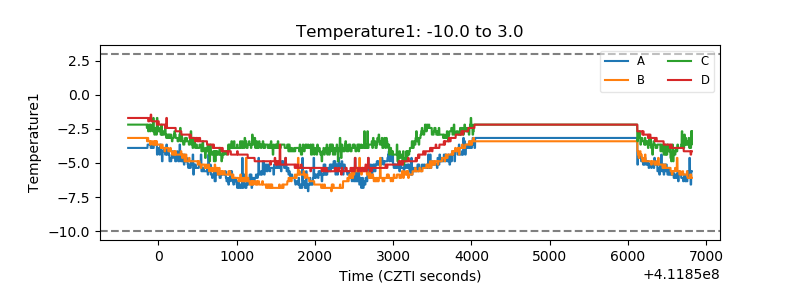 |
| Veto HV Monitor | 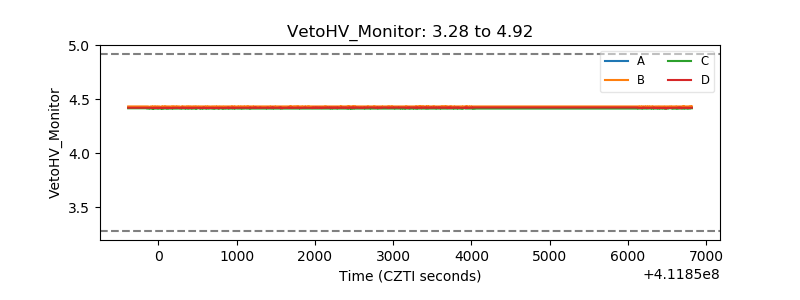 |
| Veto LLD | 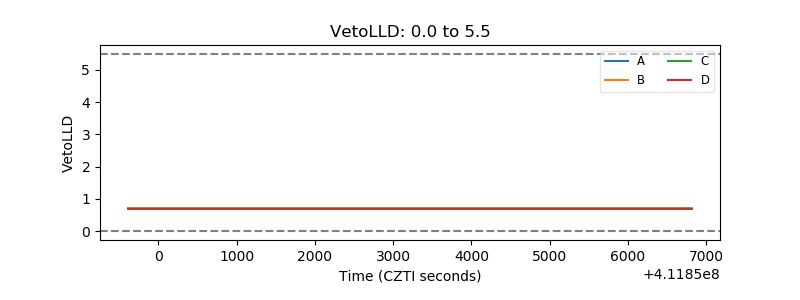 |
| Alpha Counter | 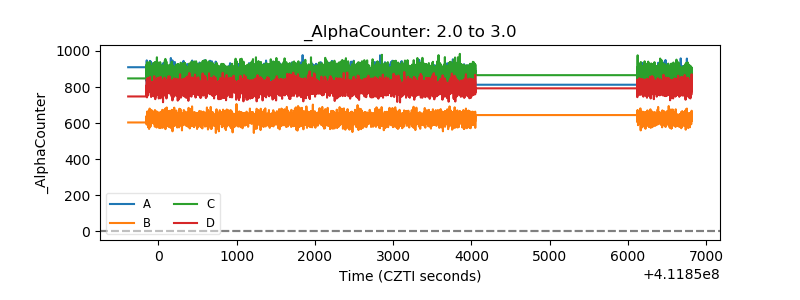 |
| _CPM_Rate | 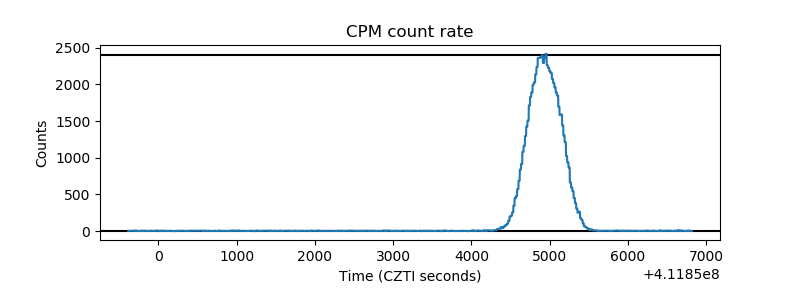 |
| CZT Counter | 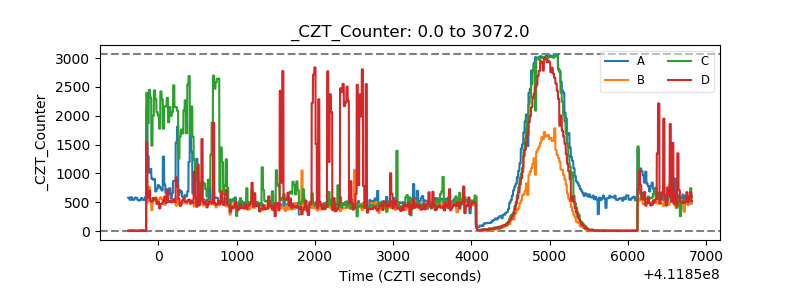 |
| +2.5 Volts monitor | 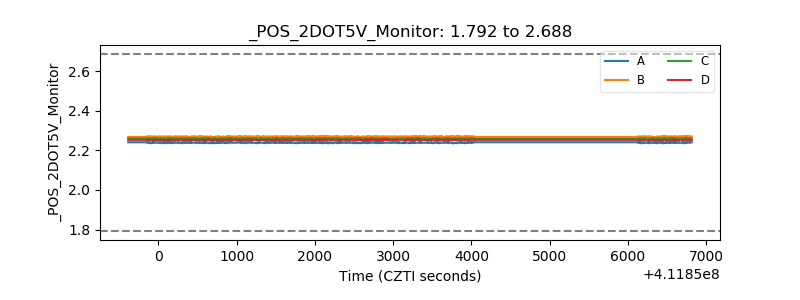 |
| +5 Volts monitor | 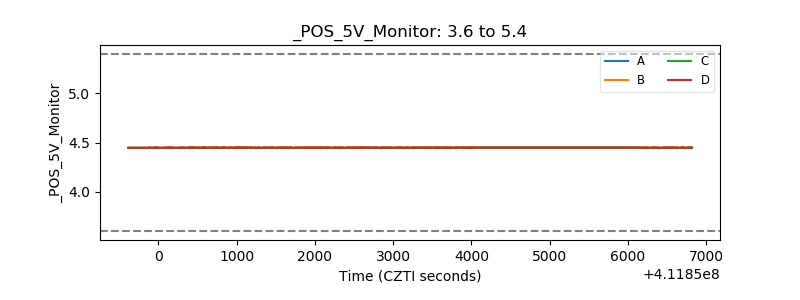 |
| _ROLL_ROT | 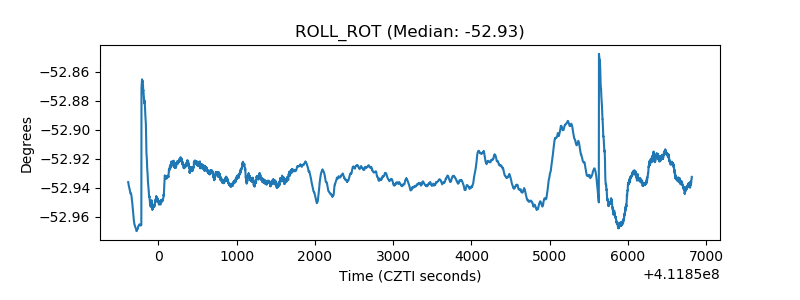 |
| _Roll_DEC | 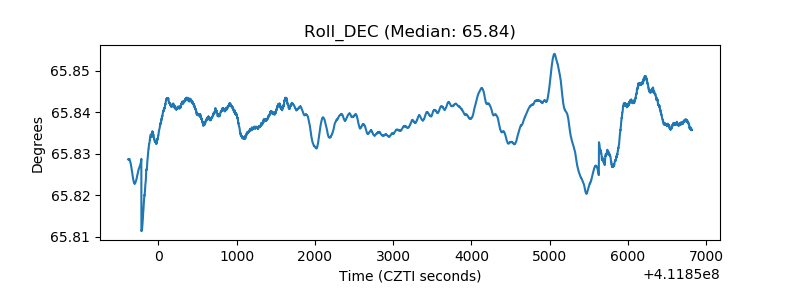 |
| _Roll_RA | 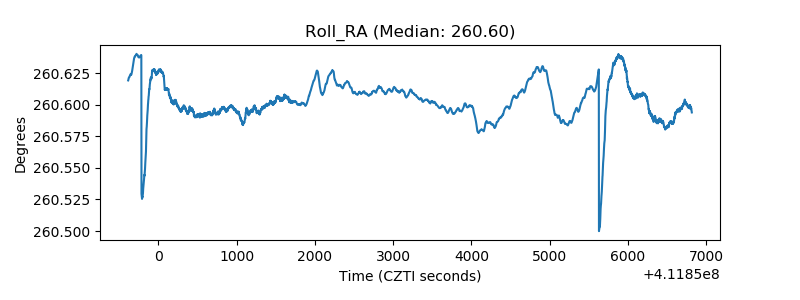 |
| Veto Counter | 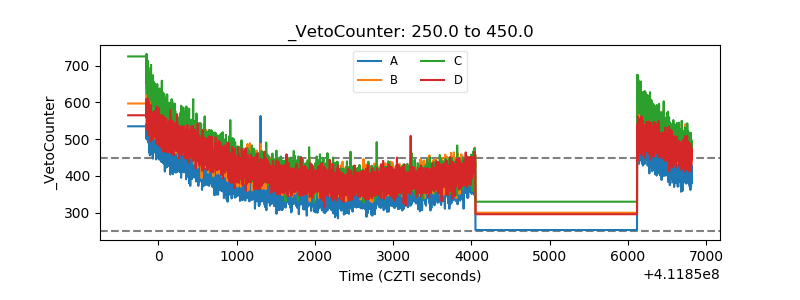 |