| Param | Original file | Final file |
|---|---|---|
| Filename | modeM0/AS1A12_018T01_9000005488_39534cztM0_level2.fits | modeM0/AS1A12_018T01_9000005488_39534cztM0_level2_quad_clean.evt |
| Size (bytes) | 293,126,400 | 88,640,640 |
| Size | 279.5 MB | 84.5 MB |
| Events in quadrant A | 2,604,771 | 596,714 |
| Events in quadrant B | 2,175,287 | 619,683 |
| Events in quadrant C | 3,099,369 | 584,689 |
| Events in quadrant D | 2,591,483 | 542,116 |
| Mode SS | |||
|---|---|---|---|
| Quadrant | BADHDUFLAG | Total packets | Discarded packets |
| A | 0 | 98 | 0 |
| B | 0 | 98 | 0 |
| C | 0 | 98 | 0 |
| D | 0 | 98 | 0 |
| Mode M0 | |||
|---|---|---|---|
| Quadrant | BADHDUFLAG | Total packets | Discarded packets |
| A | 0 | 10817 | 3 |
| B | 0 | 9803 | 2 |
| C | 0 | 12379 | 2 |
| D | 0 | 11247 | 2 |
| Mode M9 | |||
|---|---|---|---|
| Quadrant | BADHDUFLAG | Total packets | Discarded packets |
| A | 0 | 26 | 0 |
| B | 0 | 26 | 0 |
| C | 0 | 26 | 0 |
| D | 0 | 27 | 0 |
| Quadrant | Total seconds | Saturated seconds | Saturation percentage |
|---|---|---|---|
| A | 4867 | 9 | 0.184919% |
| B | 4867 | 4 | 0.082186% |
| C | 4867 | 144 | 2.958701% |
| D | 4867 | 75 | 1.540990% |
Noise dominated data is calculated using 1-second bins in cleaned event files. If a bin has >2000 counts, and if more than 50% of those come from <1% of pixels, then it is considered to be noise-dominated and hence unusable.
| Quadrant | # 1 sec bins | Bins with >0 counts | Bins with >2000 counts | High rate bins dominated by noise | Noise dominated (total time) | Noise dominated (detector-on time) | Marked lightcurve |
|---|---|---|---|---|---|---|---|
| A | 6990 | 4868 | 6 | 6 | 0.09% | 0.12% | 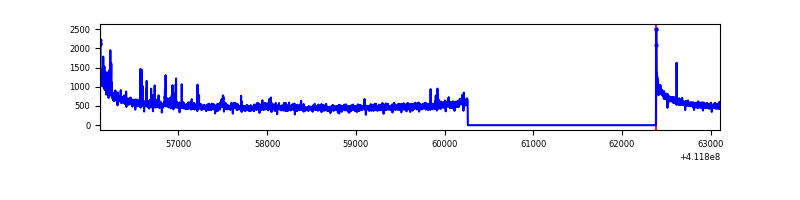 |
| B | 6990 | 4868 | 0 | 0 | 0.00% | 0.00% | 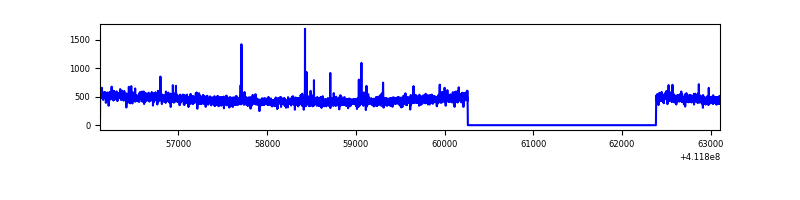 |
| C | 6990 | 4868 | 105 | 105 | 1.50% | 2.16% | 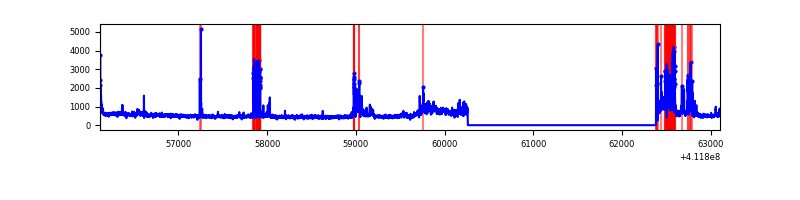 |
| D | 6990 | 4868 | 60 | 60 | 0.86% | 1.23% | 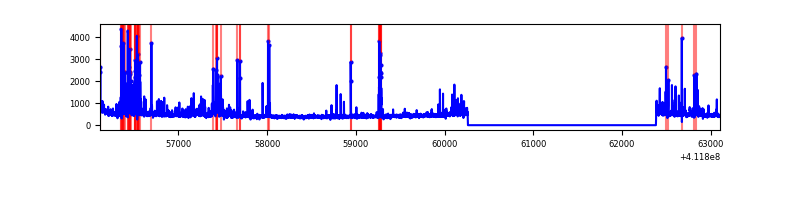 |
Top three noisy pixels from each quadrant. If the there are fewer than three noisy pixels in the level2.evt file, extra rows are filled as -1
| Pixel properties | Quadrant properties | ||||||
|---|---|---|---|---|---|---|---|
| Quadrant | DetID | PixID | Counts | Sigma | Mean | Median | Sigma |
| A | 10 | 83 | 402032 | 3683.04 | 543 | 534 | 109.0 |
| A | 13 | 248 | 81080 | 738.87 | 543 | 534 | 109.0 |
| A | 6 | 10 | 10369 | 90.22 | 543 | 534 | 109.0 |
| B | 5 | 255 | 15709 | 146.49 | 546 | 531 | 103.6 |
| B | 12 | 111 | 12495 | 115.47 | 546 | 531 | 103.6 |
| B | 11 | 111 | 11652 | 107.33 | 546 | 531 | 103.6 |
| C | 9 | 187 | 748235 | 6031.54 | 536 | 541 | 124.0 |
| C | 15 | 214 | 216973 | 1745.93 | 536 | 541 | 124.0 |
| C | 0 | 10 | 33257 | 263.92 | 536 | 541 | 124.0 |
| D | 5 | 32 | 147311 | 1139.1 | 532 | 518 | 128.9 |
| D | 13 | 249 | 143577 | 1110.13 | 532 | 518 | 128.9 |
| D | 12 | 227 | 100623 | 776.81 | 532 | 518 | 128.9 |
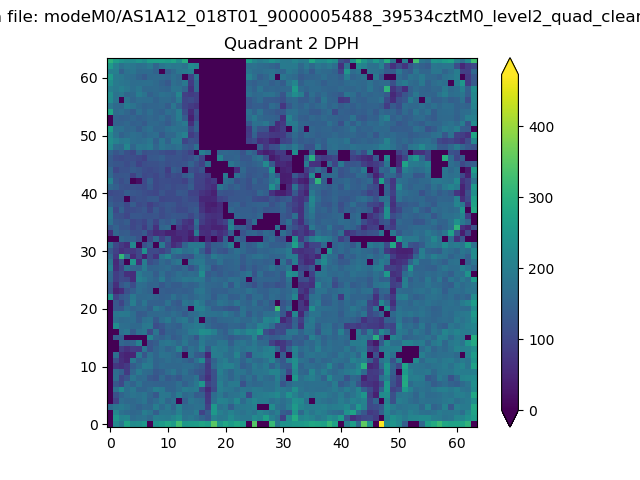
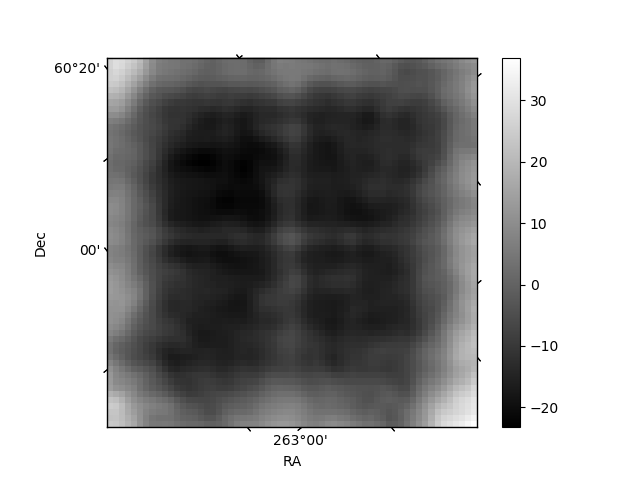
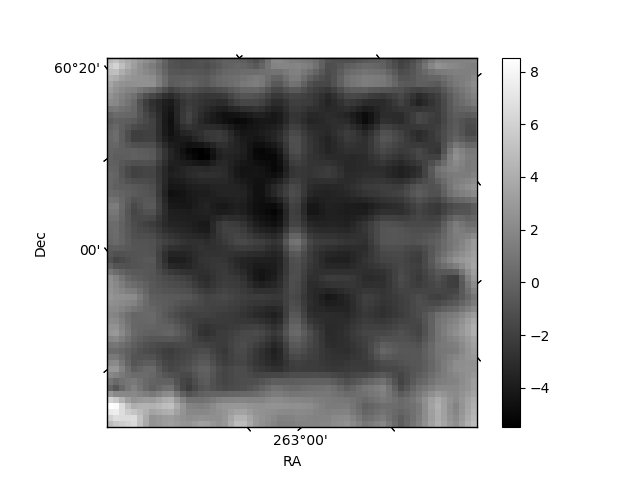
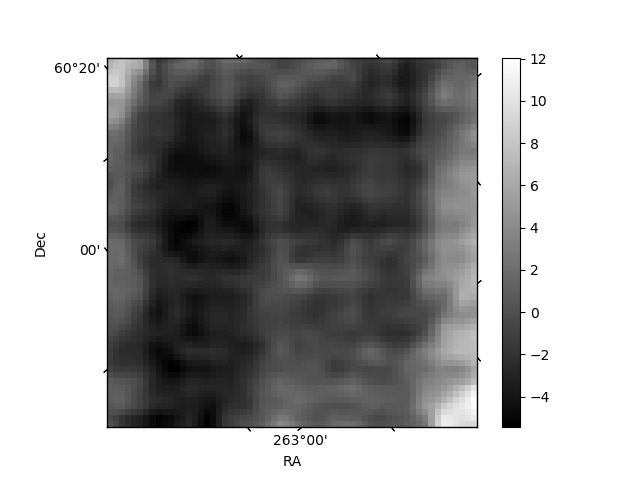
Histogram calculated using DETX and DETY for each event in the final _common_clean file
| Quadrant A | 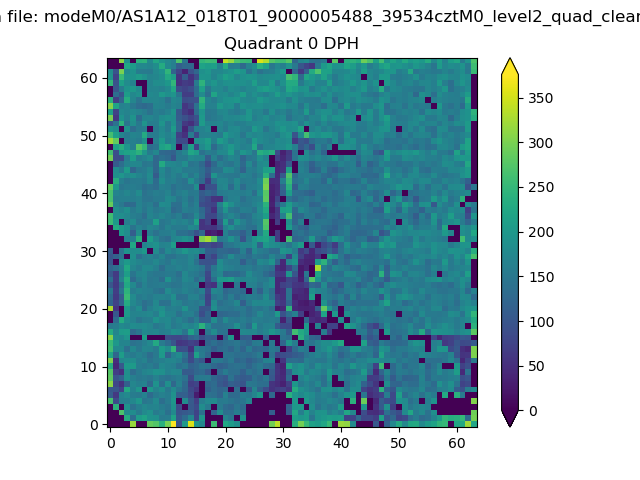 |
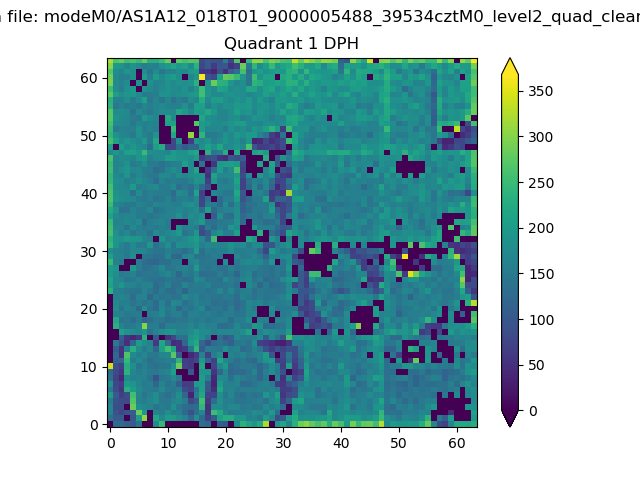 |
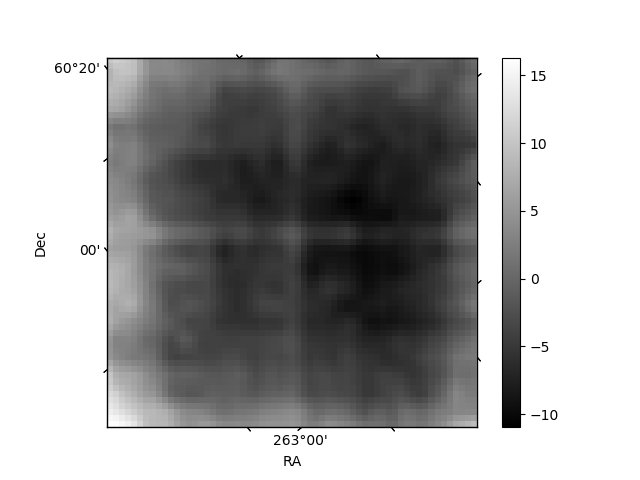
Quadrant B |
|---|---|---|---|
| Quadrant D | 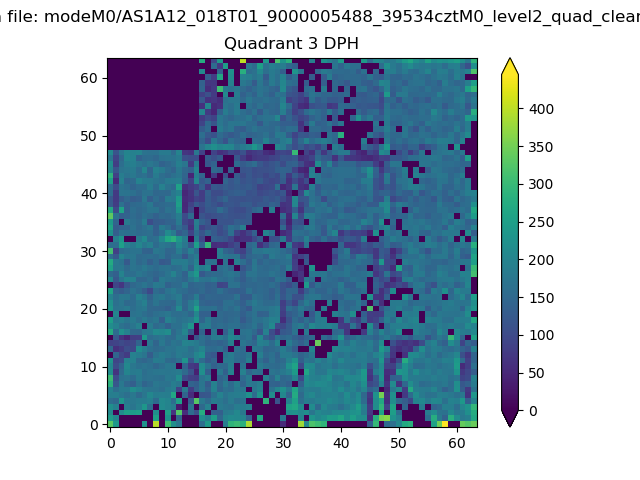 |
 |
Quadrant C |
| Plot type | Count rate plots | Images |
|---|---|---|
| Comparison with Poisson distribution Blue bars denote a histogram of data divided into 1 sec bins. Red curve is a Poisson curve with rate = median count rate of data. |
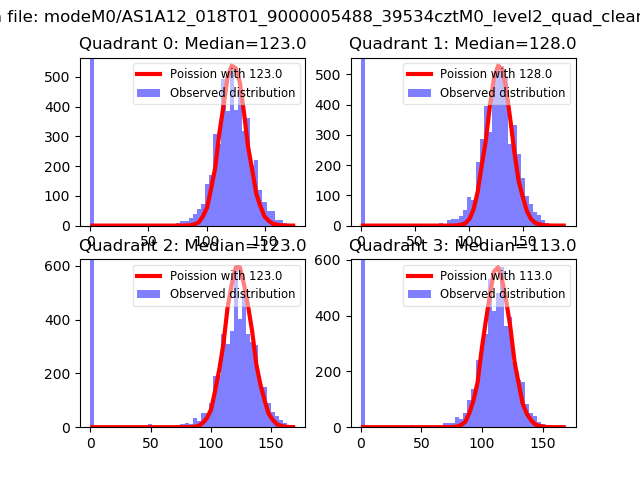 |
 |
| Quadrant-wise count rates Data is divided into 100 sec bins |
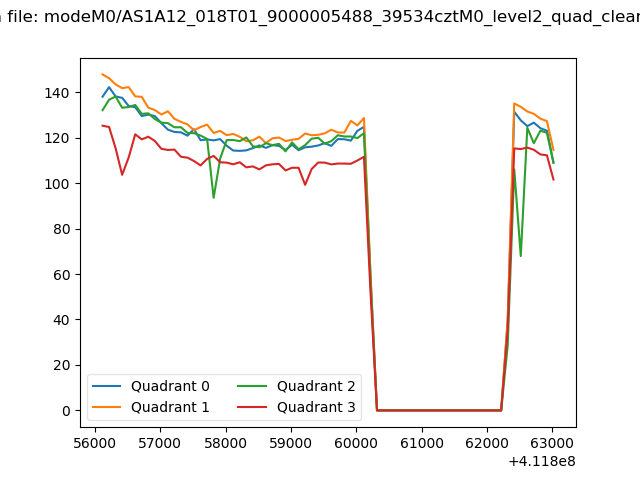 |
|
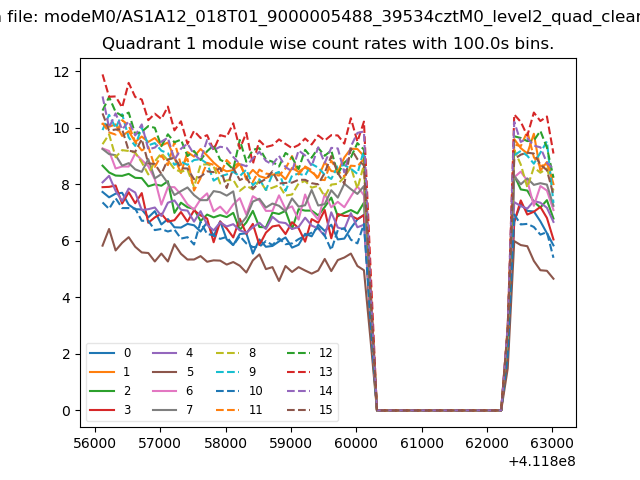
| Module-wise count rates for Quadrant A Data is divided into 100 sec bins |
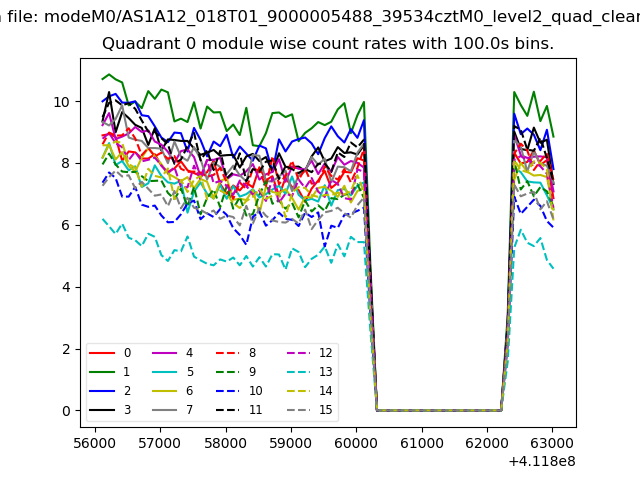 |
 |
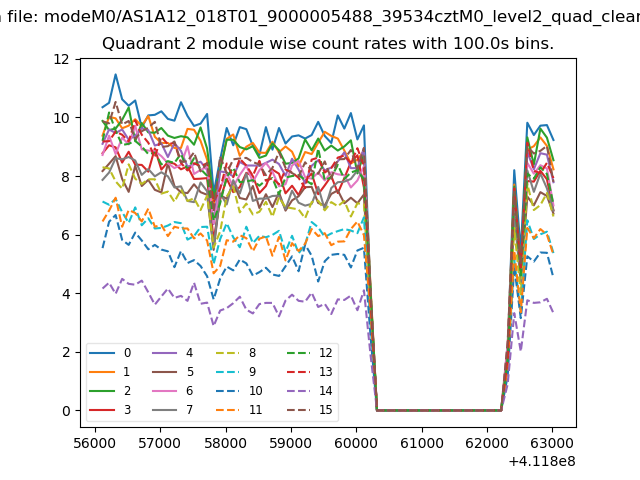
| Module-wise count rates for Quadrant B Data is divided into 100 sec bins |
 |
 |
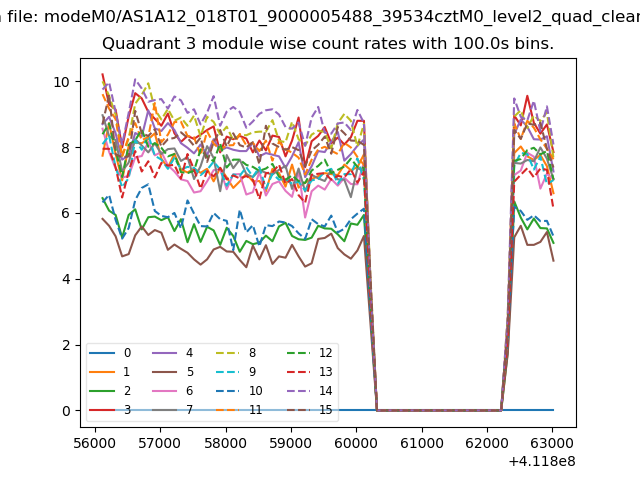
| Module-wise count rates for Quadrant C Data is divided into 100 sec bins |
 |
 |
| Module-wise count rates for Quadrant D Data is divided into 100 sec bins |
 |
 |
| Parameter | Plot |
|---|---|
| CZT HV Monitor | 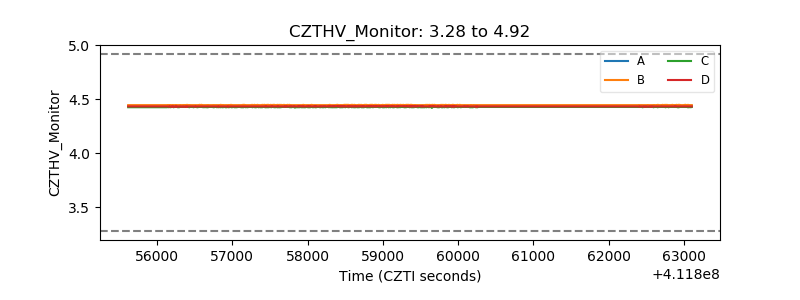 |
| D_VDD | 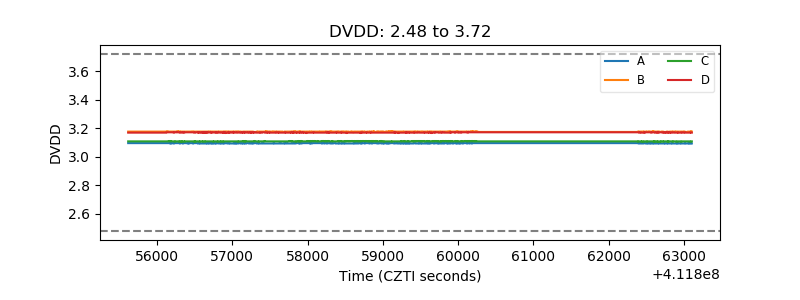 |
| Temperature 1 | 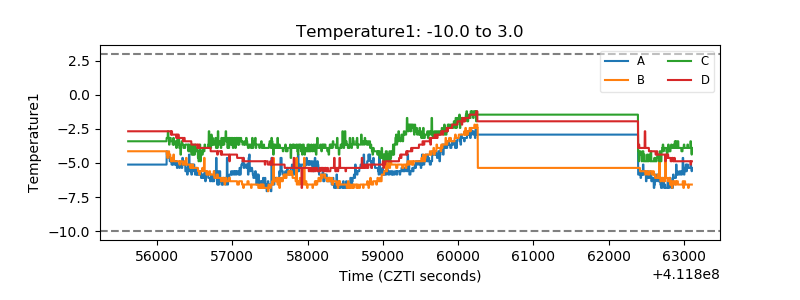 |
| Veto HV Monitor | 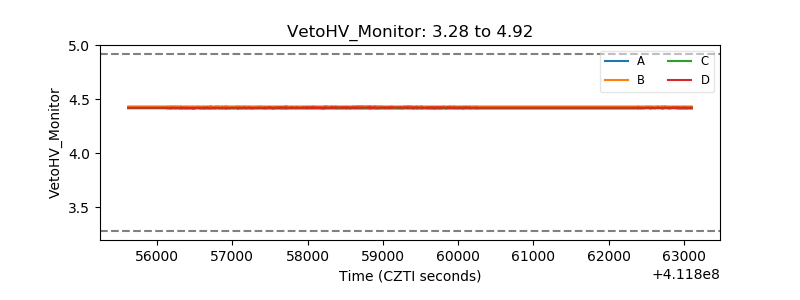 |
| Veto LLD | 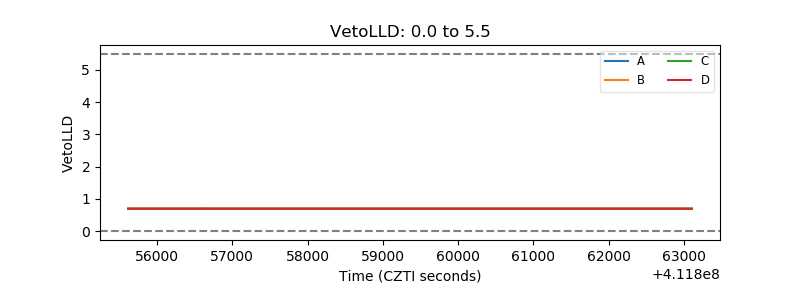 |
| Alpha Counter |  |
| _CPM_Rate | 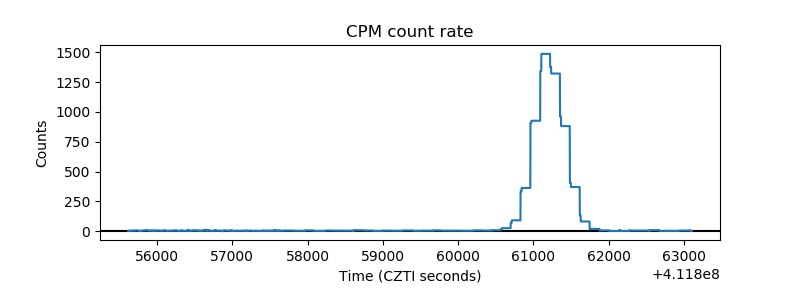 |
| CZT Counter | 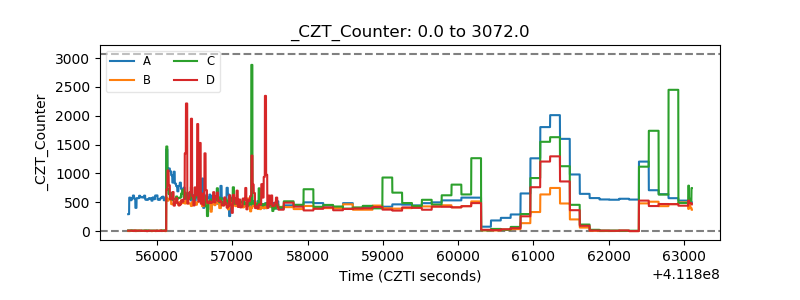 |
| +2.5 Volts monitor | 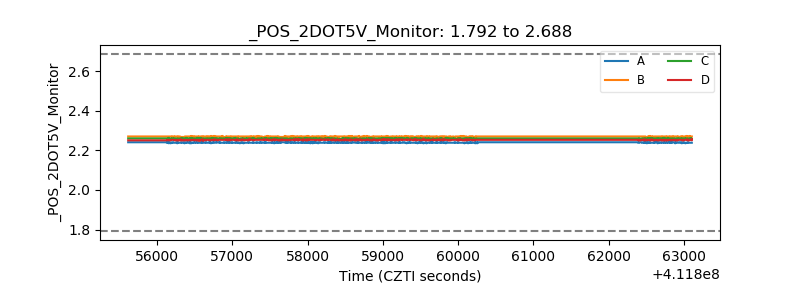 |
| +5 Volts monitor | 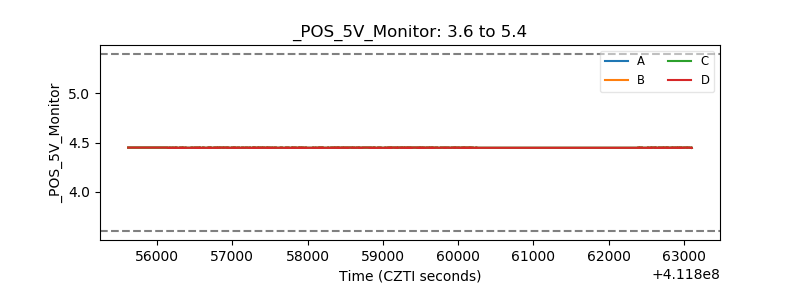 |
| _ROLL_ROT | 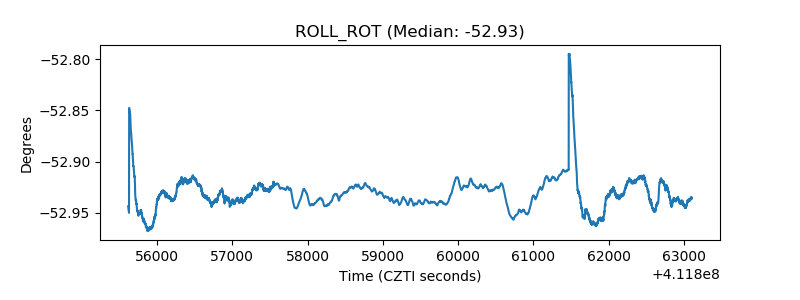 |
| _Roll_DEC | 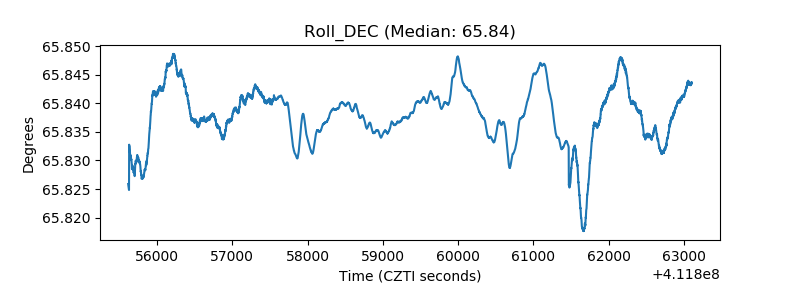 |
| _Roll_RA | 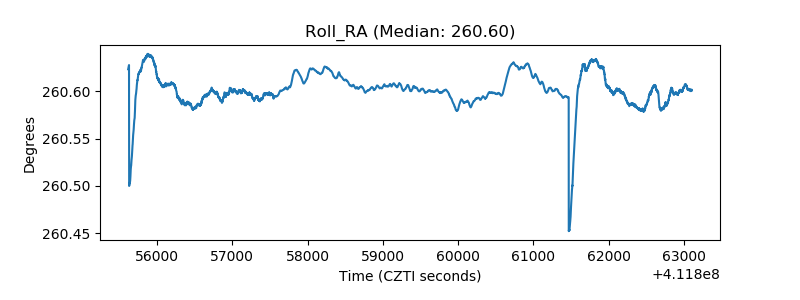 |
| Veto Counter | 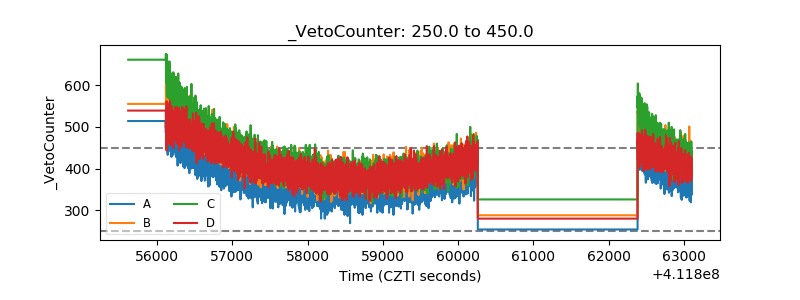 |