| Param | Original file | Final file |
|---|---|---|
| Filename | modeM0/AS1A12_018T01_9000005488_39535cztM0_level2.fits | modeM0/AS1A12_018T01_9000005488_39535cztM0_level2_quad_clean.evt |
| Size (bytes) | 295,571,520 | 85,896,000 |
| Size | 281.9 MB | 81.9 MB |
| Events in quadrant A | 2,514,040 | 575,844 |
| Events in quadrant B | 2,121,840 | 596,583 |
| Events in quadrant C | 3,257,677 | 561,479 |
| Events in quadrant D | 2,661,554 | 519,975 |
| Mode SS | |||
|---|---|---|---|
| Quadrant | BADHDUFLAG | Total packets | Discarded packets |
| A | 0 | 102 | 0 |
| B | 0 | 102 | 0 |
| C | 0 | 102 | 0 |
| D | 0 | 102 | 0 |
| Mode M0 | |||
|---|---|---|---|
| Quadrant | BADHDUFLAG | Total packets | Discarded packets |
| A | 0 | 10621 | 3 |
| B | 0 | 9944 | 2 |
| C | 0 | 12988 | 2 |
| D | 0 | 11607 | 2 |
| Mode M9 | |||
|---|---|---|---|
| Quadrant | BADHDUFLAG | Total packets | Discarded packets |
| A | 0 | 28 | 0 |
| B | 0 | 28 | 0 |
| C | 0 | 28 | 0 |
| D | 0 | 29 | 0 |
| Quadrant | Total seconds | Saturated seconds | Saturation percentage |
|---|---|---|---|
| A | 4947 | 9 | 0.181928% |
| B | 4947 | 4 | 0.080857% |
| C | 4947 | 147 | 2.971498% |
| D | 4947 | 88 | 1.778856% |
Noise dominated data is calculated using 1-second bins in cleaned event files. If a bin has >2000 counts, and if more than 50% of those come from <1% of pixels, then it is considered to be noise-dominated and hence unusable.
| Quadrant | # 1 sec bins | Bins with >0 counts | Bins with >2000 counts | High rate bins dominated by noise | Noise dominated (total time) | Noise dominated (detector-on time) | Marked lightcurve |
|---|---|---|---|---|---|---|---|
| A | 7069 | 4948 | 4 | 4 | 0.06% | 0.08% | 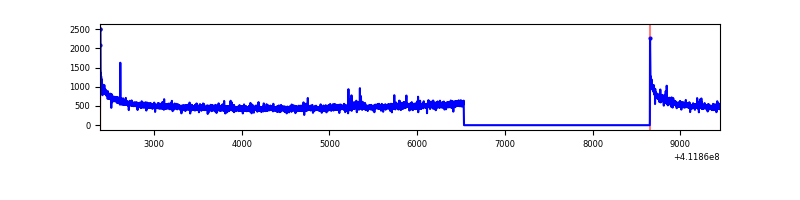 |
| B | 7069 | 4948 | 0 | 0 | 0.00% | 0.00% | 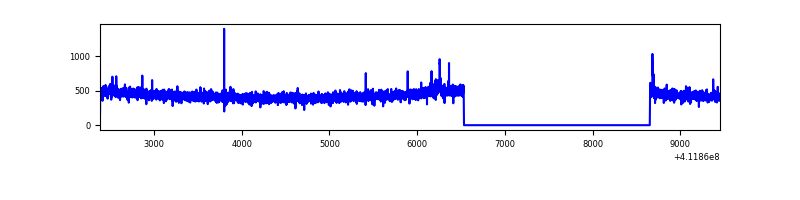 |
| C | 7069 | 4948 | 133 | 133 | 1.88% | 2.69% | 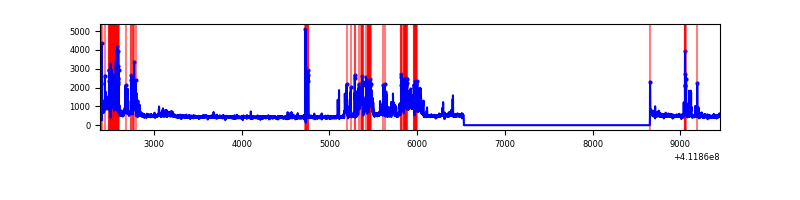 |
| D | 7069 | 4948 | 88 | 88 | 1.24% | 1.78% | 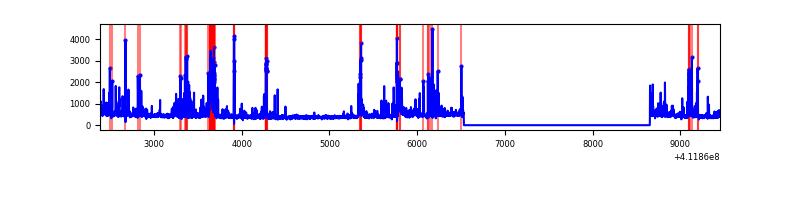 |
Top three noisy pixels from each quadrant. If the there are fewer than three noisy pixels in the level2.evt file, extra rows are filled as -1
| Pixel properties | Quadrant properties | ||||||
|---|---|---|---|---|---|---|---|
| Quadrant | DetID | PixID | Counts | Sigma | Mean | Median | Sigma |
| A | 10 | 83 | 406682 | 3722.63 | 534 | 524 | 109.1 |
| A | 15 | 222 | 22303 | 199.61 | 534 | 524 | 109.1 |
| A | 13 | 248 | 12259 | 107.56 | 534 | 524 | 109.1 |
| B | 0 | 230 | 13057 | 123.12 | 533 | 520 | 101.8 |
| B | 12 | 111 | 12644 | 119.06 | 533 | 520 | 101.8 |
| B | 11 | 111 | 11624 | 109.04 | 533 | 520 | 101.8 |
| C | 9 | 187 | 946605 | 7882.7 | 519 | 523 | 120.0 |
| C | 15 | 214 | 208317 | 1731.33 | 519 | 523 | 120.0 |
| C | 15 | 208 | 63433 | 524.16 | 519 | 523 | 120.0 |
| D | 2 | 249 | 287879 | 2278.9 | 516 | 502 | 126.1 |
| D | 13 | 249 | 214460 | 1696.69 | 516 | 502 | 126.1 |
| D | 12 | 227 | 111301 | 878.64 | 516 | 502 | 126.1 |
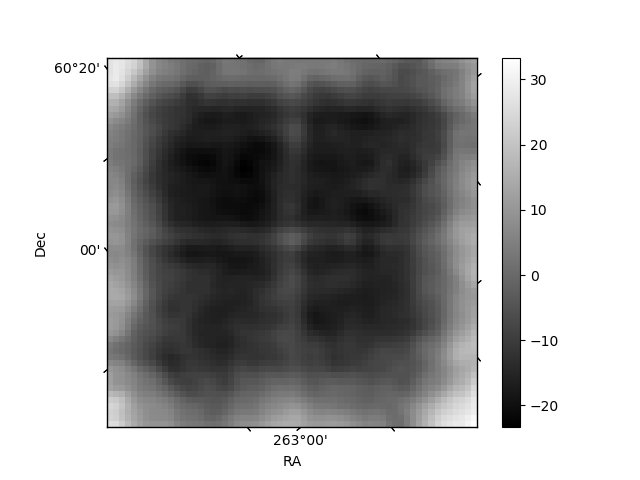
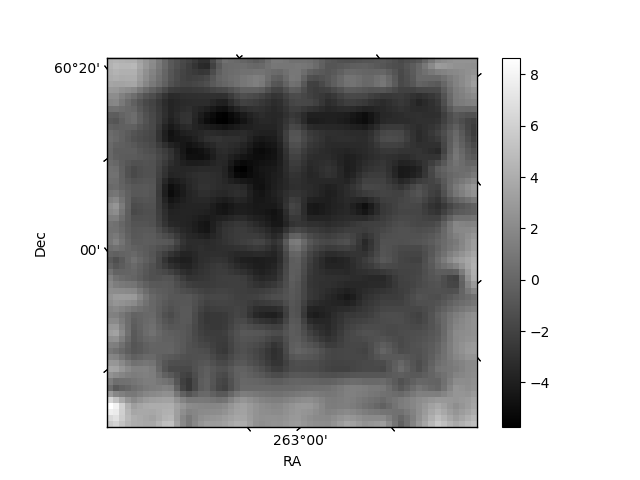
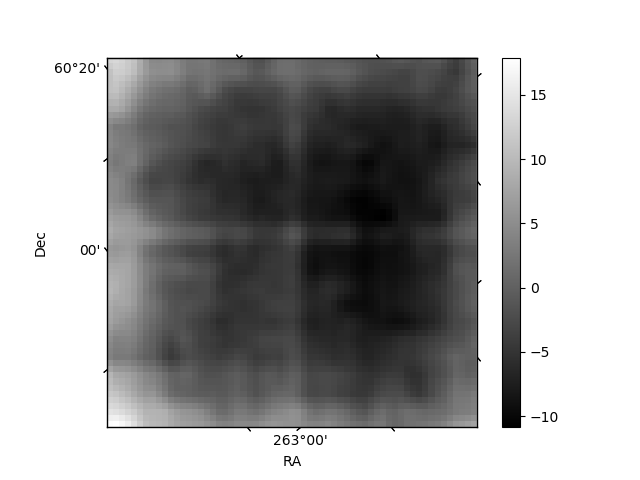
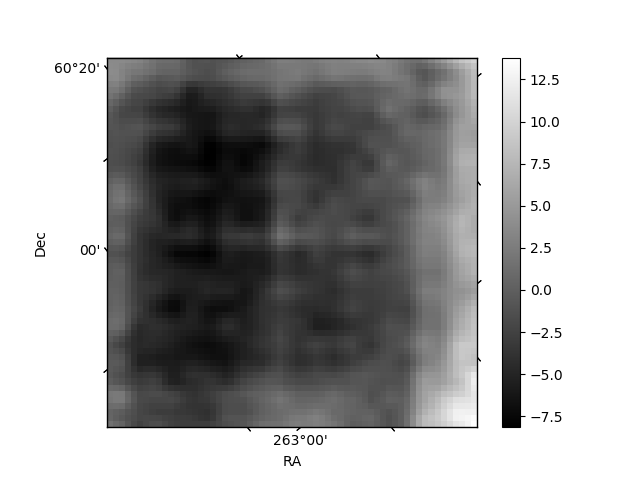
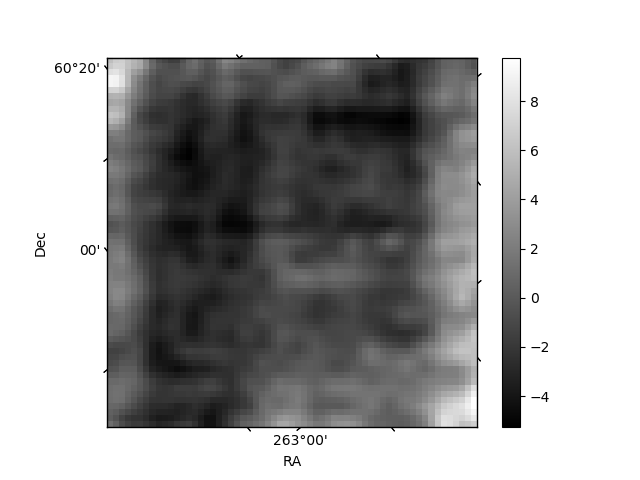
Histogram calculated using DETX and DETY for each event in the final _common_clean file
| Quadrant A | 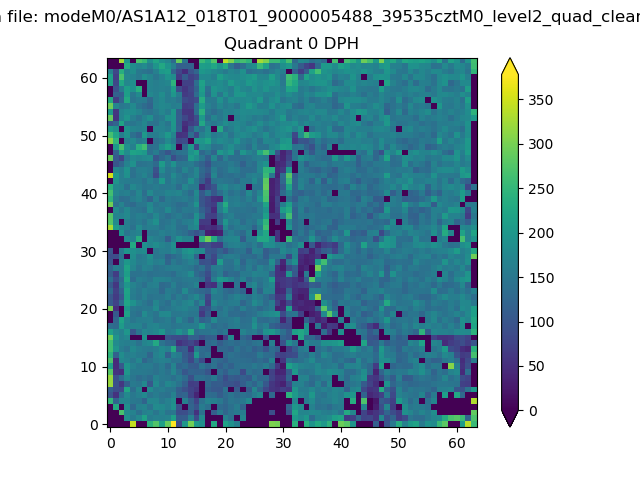 |
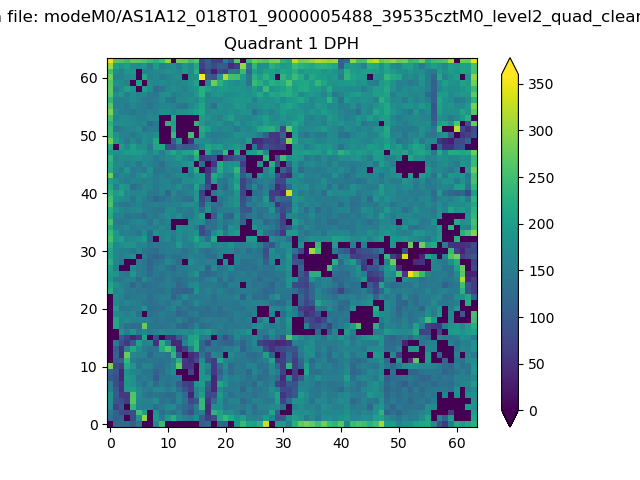 |
Quadrant B |
|---|---|---|---|
| Quadrant D | 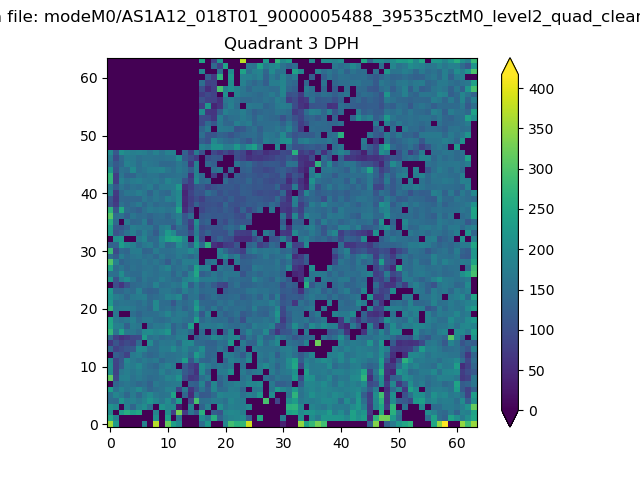 |
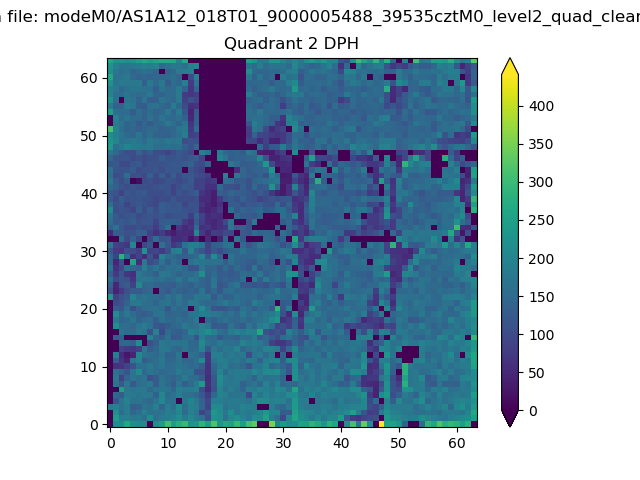 |
Quadrant C |
| Plot type | Count rate plots | Images |
|---|---|---|
| Comparison with Poisson distribution Blue bars denote a histogram of data divided into 1 sec bins. Red curve is a Poisson curve with rate = median count rate of data. |
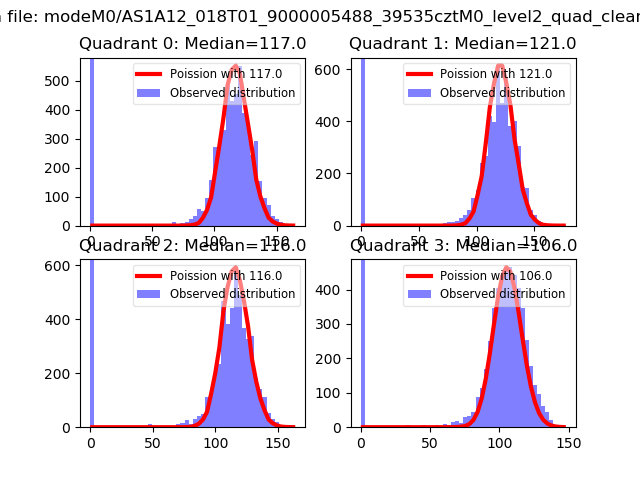 |
 |
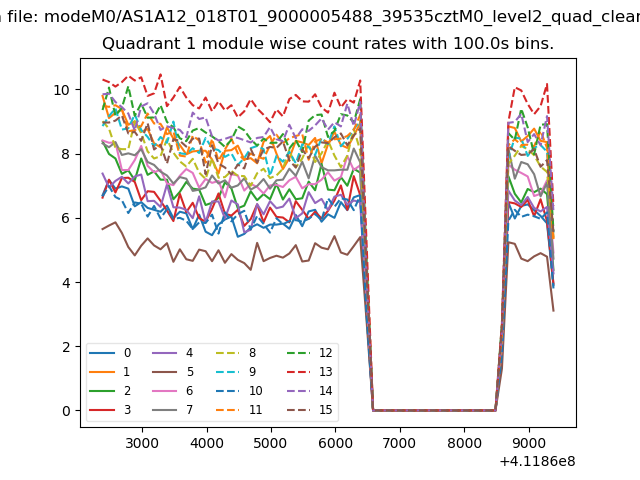
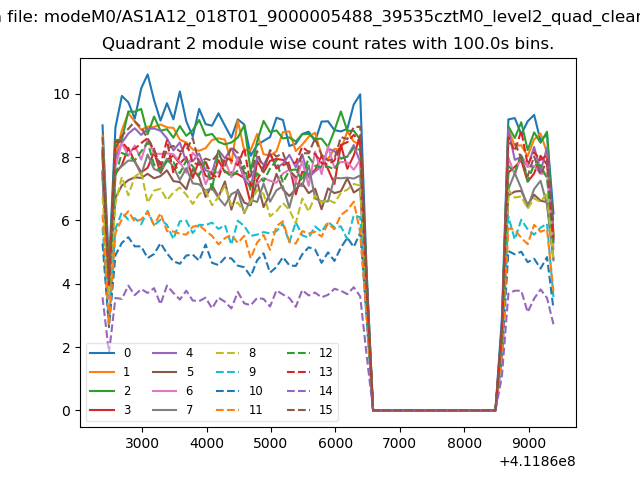
| Quadrant-wise count rates Data is divided into 100 sec bins |
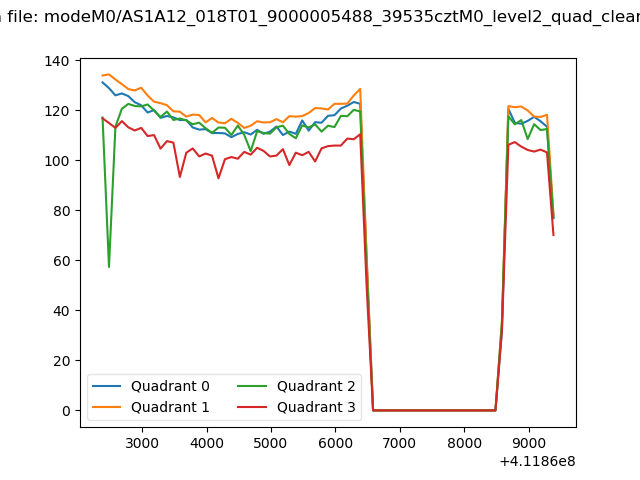 |
|
| Module-wise count rates for Quadrant A Data is divided into 100 sec bins |
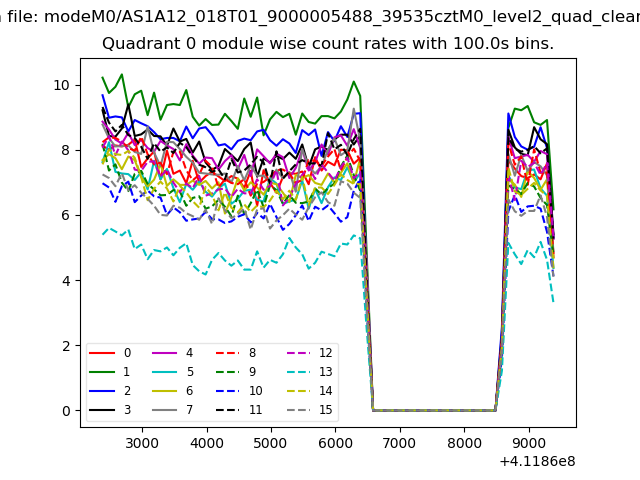 |
 |
| Module-wise count rates for Quadrant B Data is divided into 100 sec bins |
 |
 |
| Module-wise count rates for Quadrant C Data is divided into 100 sec bins |
 |
 |
| Module-wise count rates for Quadrant D Data is divided into 100 sec bins |
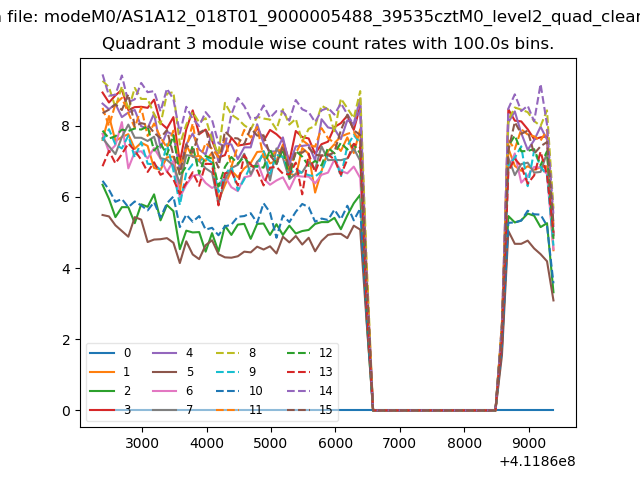 |
 |
| Parameter | Plot |
|---|---|
| CZT HV Monitor | 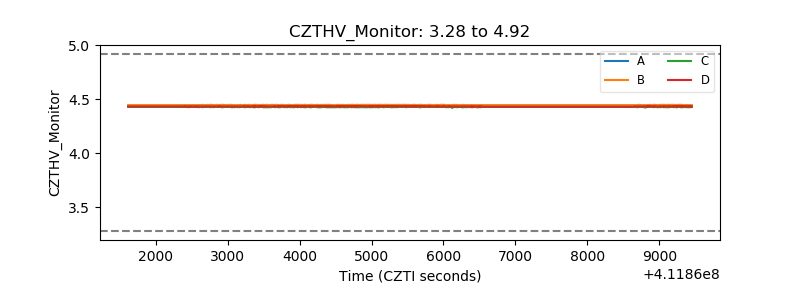 |
| D_VDD | 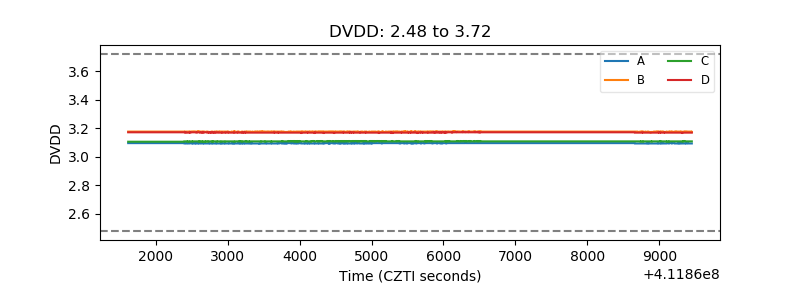 |
| Temperature 1 | 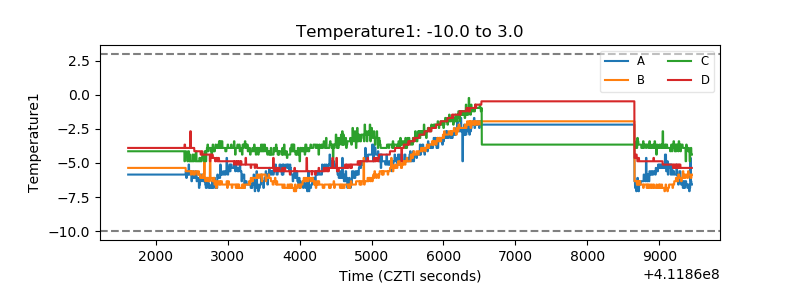 |
| Veto HV Monitor | 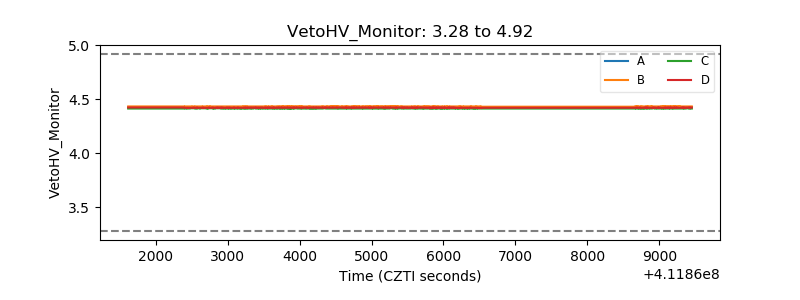 |
| Veto LLD | 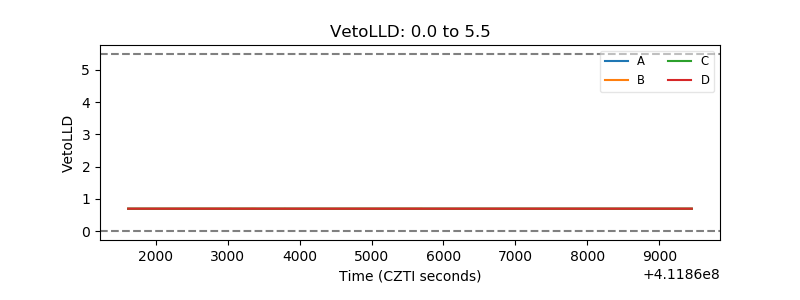 |
| Alpha Counter | 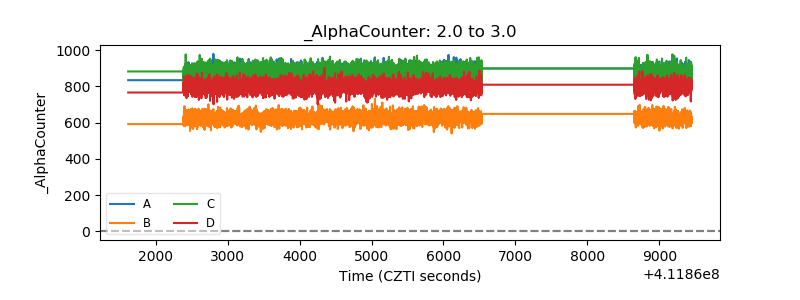 |
| _CPM_Rate | 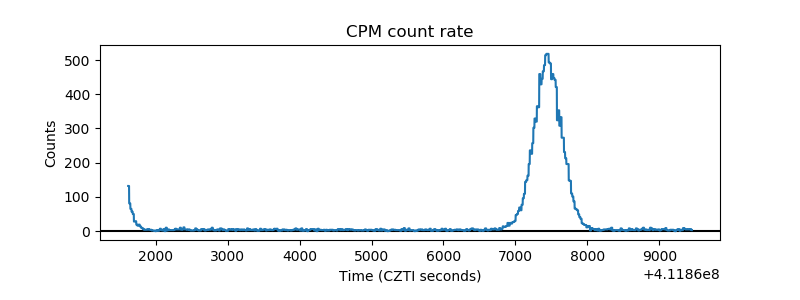 |
| CZT Counter | 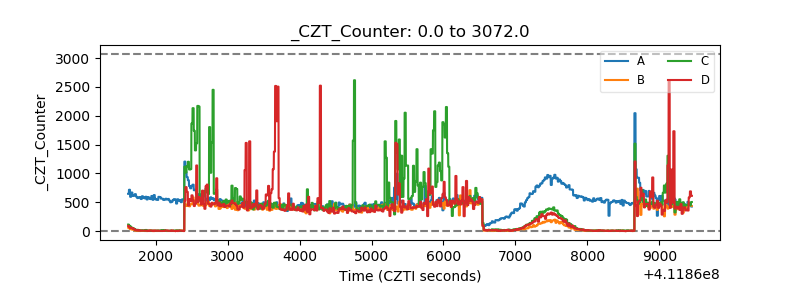 |
| +2.5 Volts monitor | 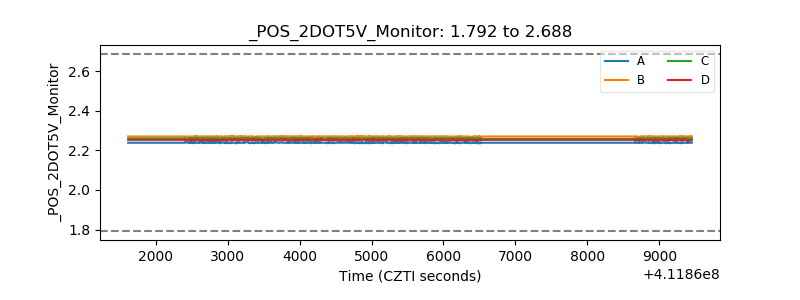 |
| +5 Volts monitor | 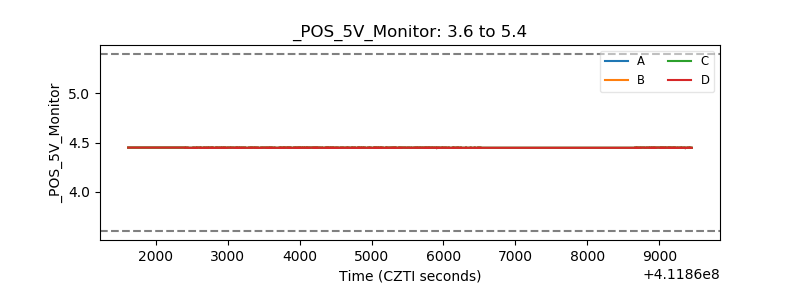 |
| _ROLL_ROT | 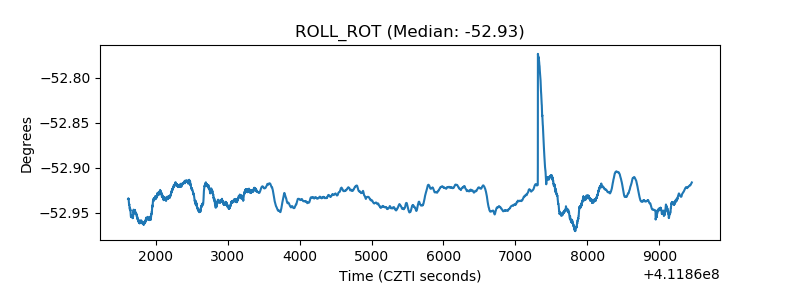 |
| _Roll_DEC | 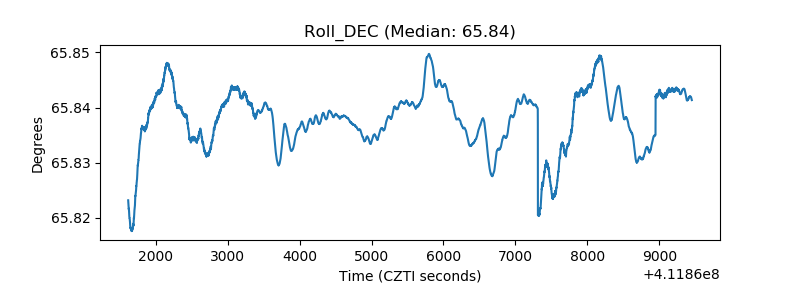 |
| _Roll_RA | 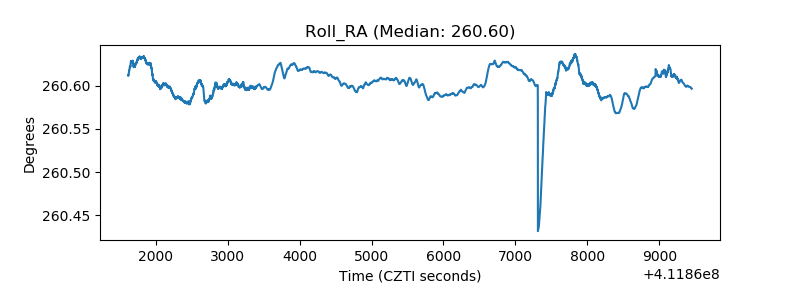 |
| Veto Counter | 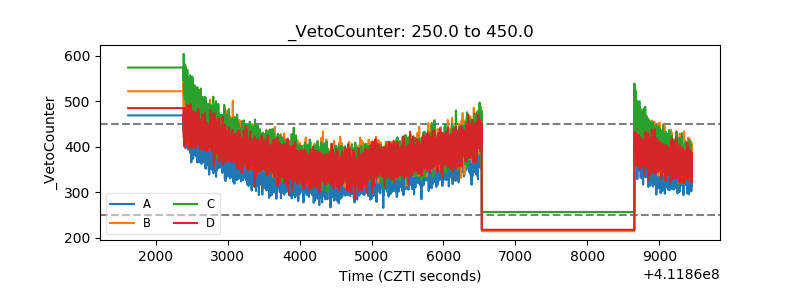 |