| Param | Original file | Final file |
|---|---|---|
| Filename | modeM0/AS1A12_018T01_9000005488_39536cztM0_level2.fits | modeM0/AS1A12_018T01_9000005488_39536cztM0_level2_quad_clean.evt |
| Size (bytes) | 286,701,120 | 87,805,440 |
| Size | 273.4 MB | 83.7 MB |
| Events in quadrant A | 2,607,611 | 583,719 |
| Events in quadrant B | 2,233,226 | 602,036 |
| Events in quadrant C | 2,698,544 | 577,655 |
| Events in quadrant D | 2,663,880 | 527,593 |
| Mode SS | |||
|---|---|---|---|
| Quadrant | BADHDUFLAG | Total packets | Discarded packets |
| A | 0 | 108 | 0 |
| B | 0 | 108 | 0 |
| C | 0 | 108 | 0 |
| D | 0 | 108 | 0 |
| Mode M0 | |||
|---|---|---|---|
| Quadrant | BADHDUFLAG | Total packets | Discarded packets |
| A | 0 | 11141 | 3 |
| B | 0 | 10660 | 2 |
| C | 0 | 11479 | 2 |
| D | 0 | 12019 | 2 |
| Mode M9 | |||
|---|---|---|---|
| Quadrant | BADHDUFLAG | Total packets | Discarded packets |
| A | 0 | 29 | 0 |
| B | 0 | 29 | 0 |
| C | 0 | 29 | 0 |
| D | 0 | 30 | 0 |
| Quadrant | Total seconds | Saturated seconds | Saturation percentage |
|---|---|---|---|
| A | 5249 | 10 | 0.190512% |
| B | 5249 | 11 | 0.209564% |
| C | 5249 | 30 | 0.571537% |
| D | 5249 | 81 | 1.543151% |
Noise dominated data is calculated using 1-second bins in cleaned event files. If a bin has >2000 counts, and if more than 50% of those come from <1% of pixels, then it is considered to be noise-dominated and hence unusable.
| Quadrant | # 1 sec bins | Bins with >0 counts | Bins with >2000 counts | High rate bins dominated by noise | Noise dominated (total time) | Noise dominated (detector-on time) | Marked lightcurve |
|---|---|---|---|---|---|---|---|
| A | 7221 | 5250 | 3 | 3 | 0.04% | 0.06% | 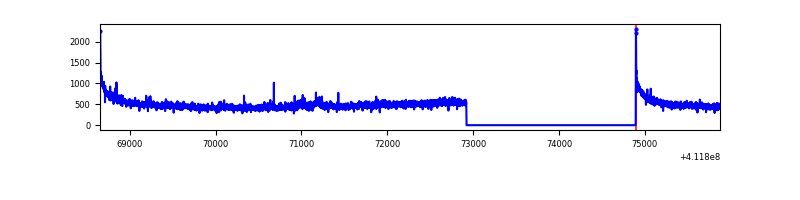 |
| B | 7221 | 5250 | 2 | 2 | 0.03% | 0.04% | 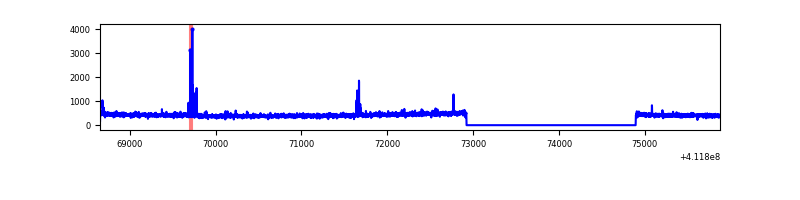 |
| C | 7221 | 5250 | 28 | 28 | 0.39% | 0.53% | 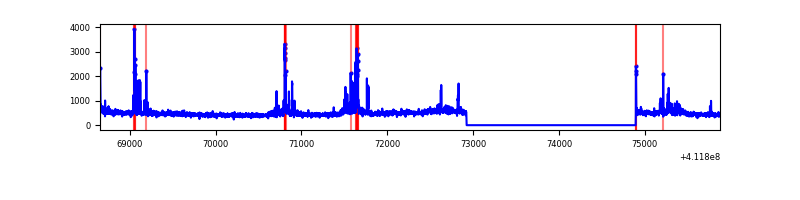 |
| D | 7221 | 5250 | 73 | 73 | 1.01% | 1.39% | 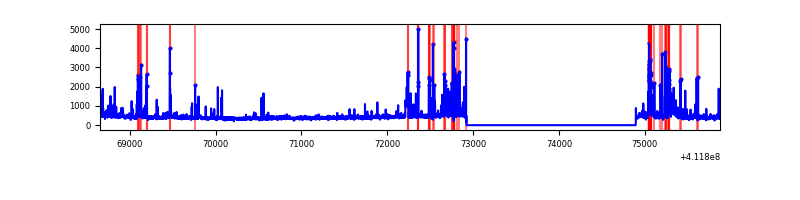 |
Top three noisy pixels from each quadrant. If the there are fewer than three noisy pixels in the level2.evt file, extra rows are filled as -1
| Pixel properties | Quadrant properties | ||||||
|---|---|---|---|---|---|---|---|
| Quadrant | DetID | PixID | Counts | Sigma | Mean | Median | Sigma |
| A | 10 | 83 | 421290 | 3727.65 | 550 | 538 | 112.9 |
| A | 15 | 222 | 54452 | 477.65 | 550 | 538 | 112.9 |
| A | 13 | 254 | 7573 | 62.33 | 550 | 538 | 112.9 |
| B | 5 | 255 | 53260 | 490.02 | 550 | 534 | 107.6 |
| B | 12 | 111 | 13336 | 118.98 | 550 | 534 | 107.6 |
| B | 11 | 111 | 11990 | 106.47 | 550 | 534 | 107.6 |
| C | 9 | 187 | 321467 | 2566.89 | 538 | 540 | 125.0 |
| C | 15 | 214 | 222868 | 1778.26 | 538 | 540 | 125.0 |
| C | 15 | 208 | 36354 | 286.45 | 538 | 540 | 125.0 |
| D | 12 | 227 | 310157 | 2391.79 | 530 | 515 | 129.5 |
| D | 13 | 249 | 214663 | 1654.16 | 530 | 515 | 129.5 |
| D | 2 | 250 | 33080 | 251.54 | 530 | 515 | 129.5 |
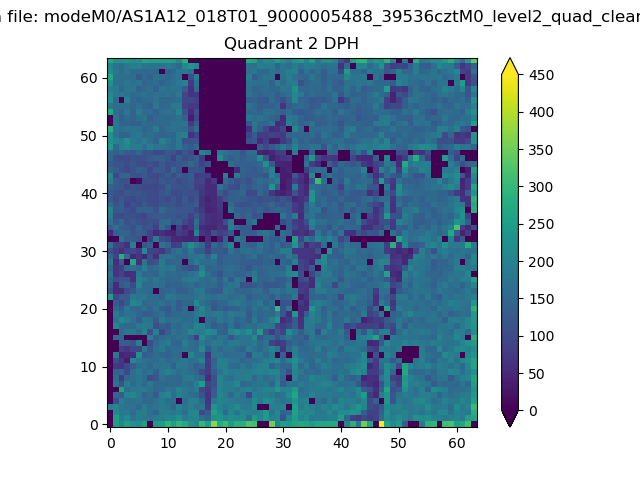
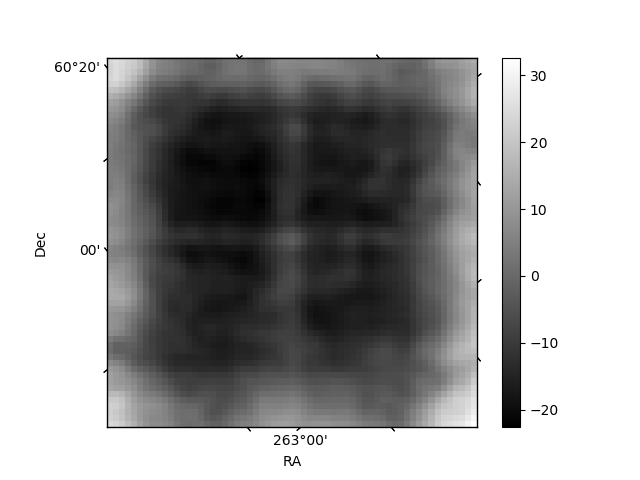
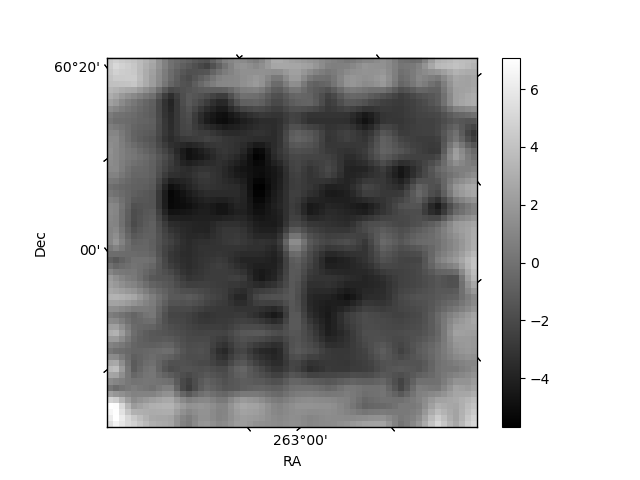
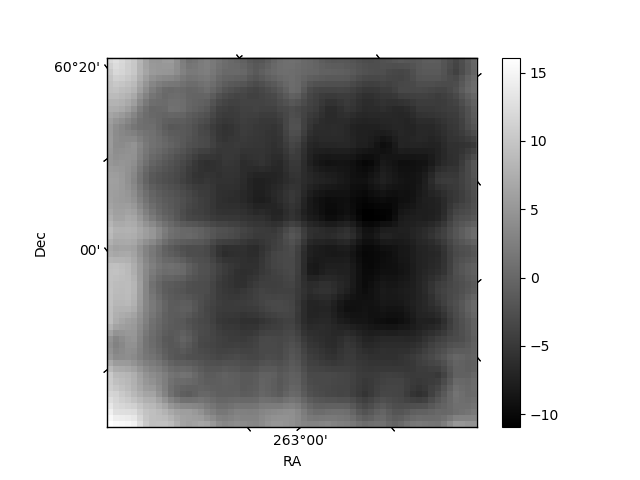
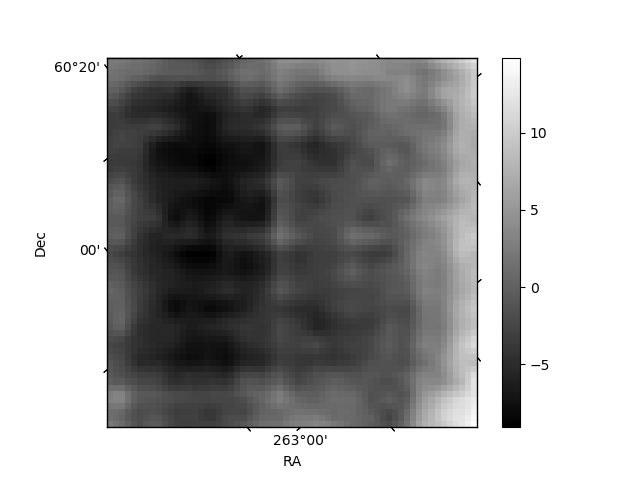
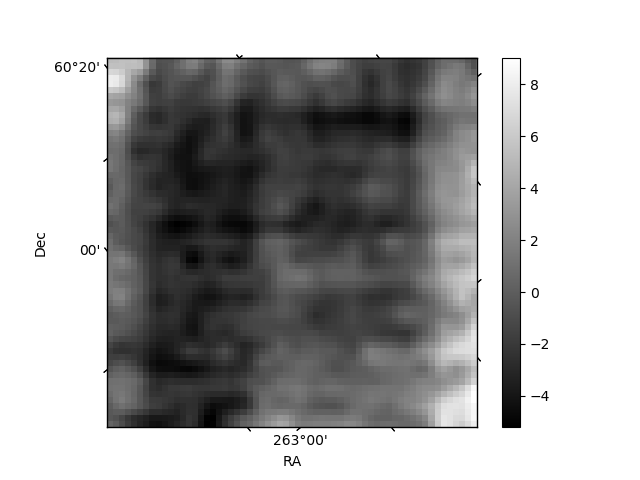
Histogram calculated using DETX and DETY for each event in the final _common_clean file
| Quadrant A | 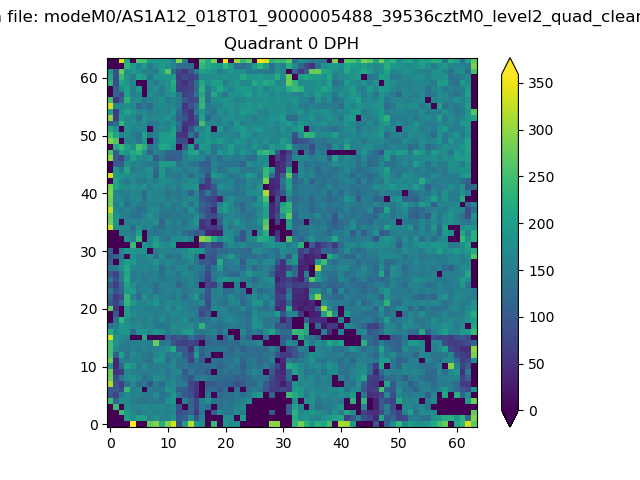 |
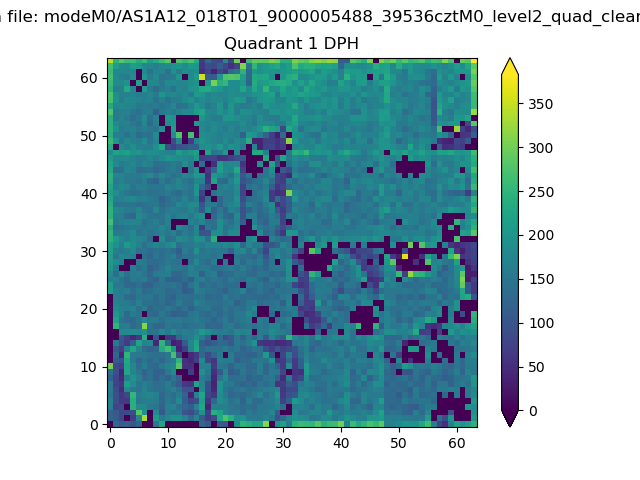 |
Quadrant B |
|---|---|---|---|
| Quadrant D | 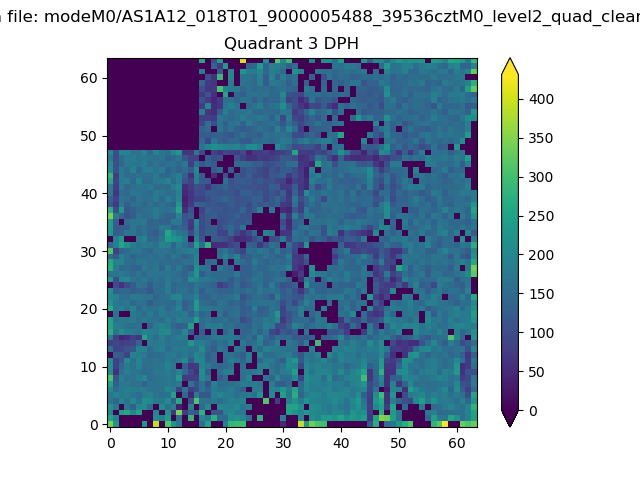 |
 |
Quadrant C |
| Plot type | Count rate plots | Images |
|---|---|---|
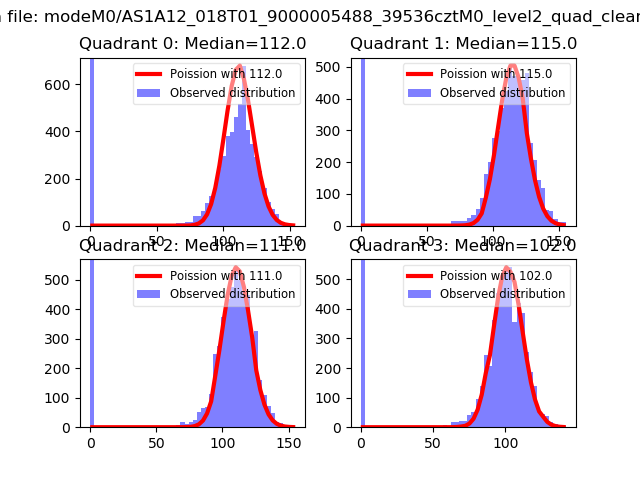
| Comparison with Poisson distribution Blue bars denote a histogram of data divided into 1 sec bins. Red curve is a Poisson curve with rate = median count rate of data. |
 |
 |
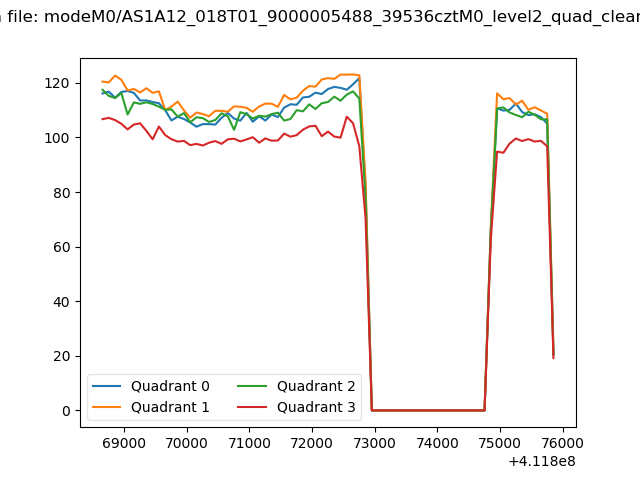
| Quadrant-wise count rates Data is divided into 100 sec bins |
 |
|
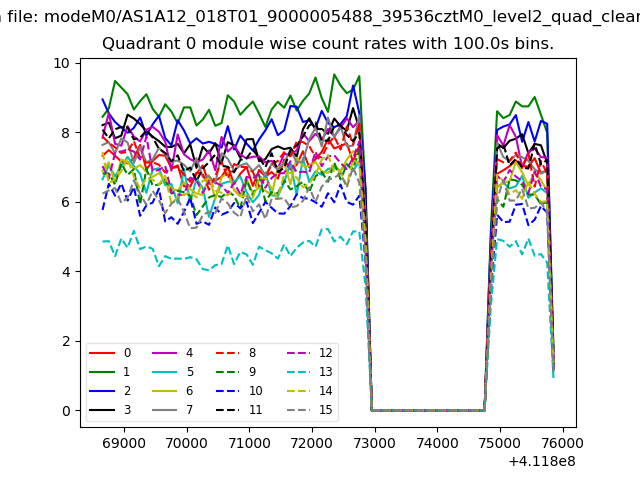
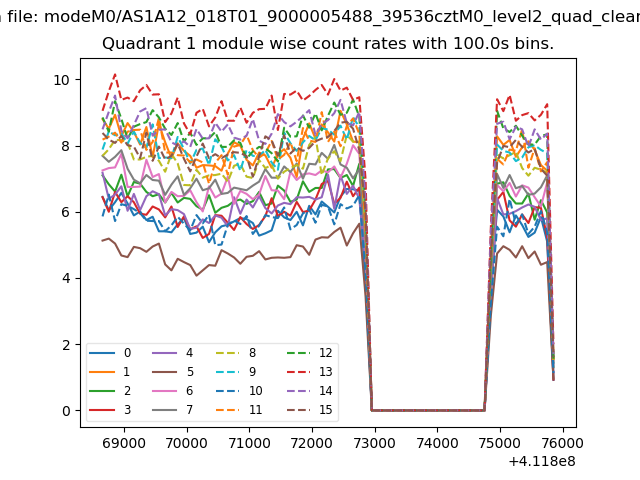
| Module-wise count rates for Quadrant A Data is divided into 100 sec bins |
 |
 |
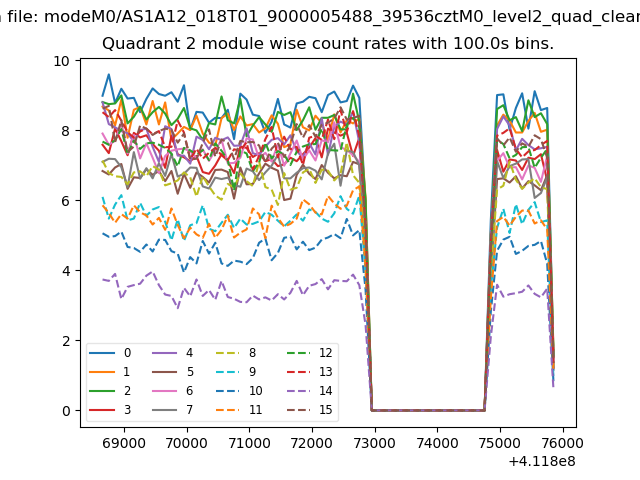
| Module-wise count rates for Quadrant B Data is divided into 100 sec bins |
 |
 |
| Module-wise count rates for Quadrant C Data is divided into 100 sec bins |
 |
 |
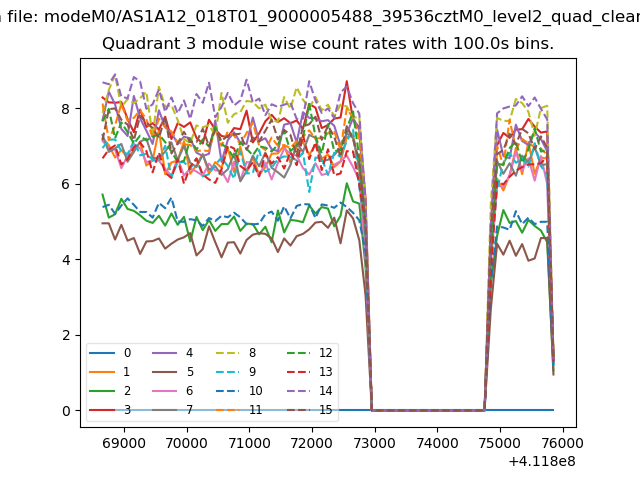
| Module-wise count rates for Quadrant D Data is divided into 100 sec bins |
 |
 |
| Parameter | Plot |
|---|---|
| CZT HV Monitor | 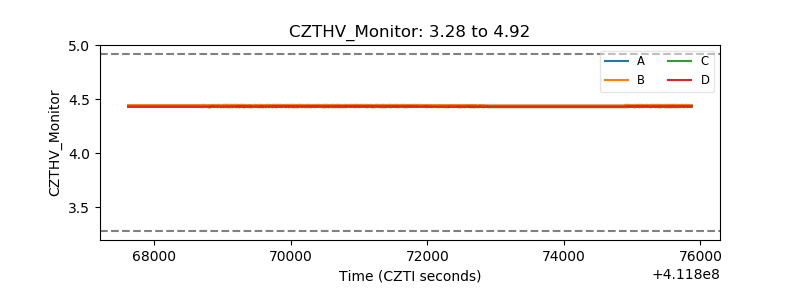 |
| D_VDD | 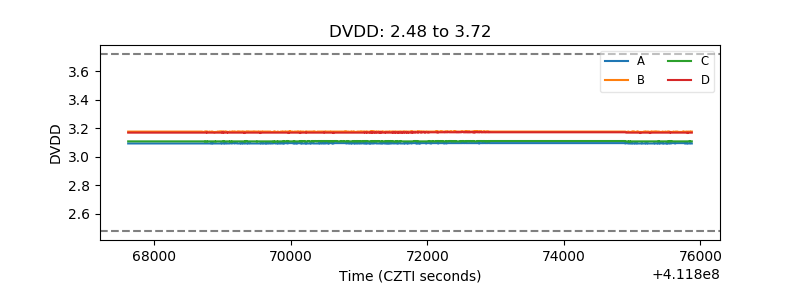 |
| Temperature 1 | 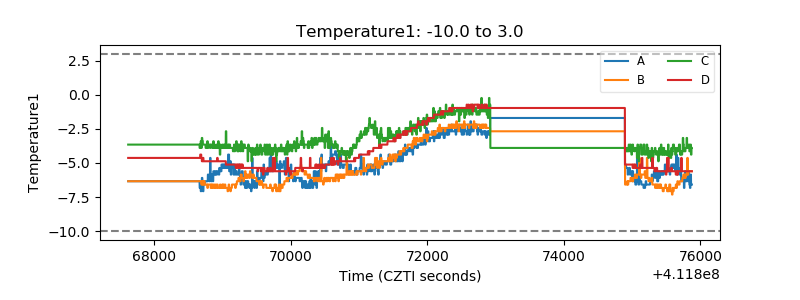 |
| Veto HV Monitor | 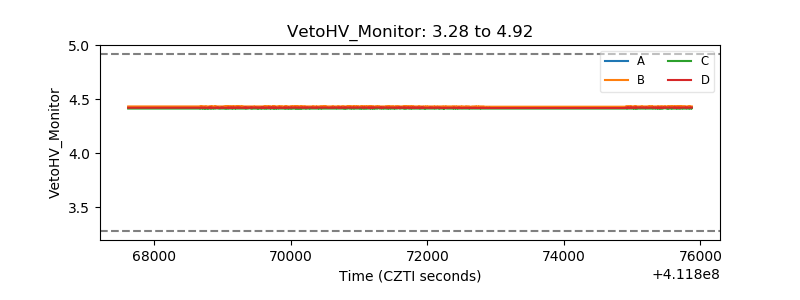 |
| Veto LLD | 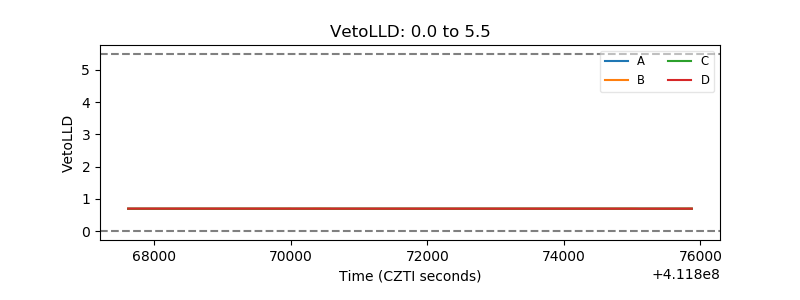 |
| Alpha Counter | 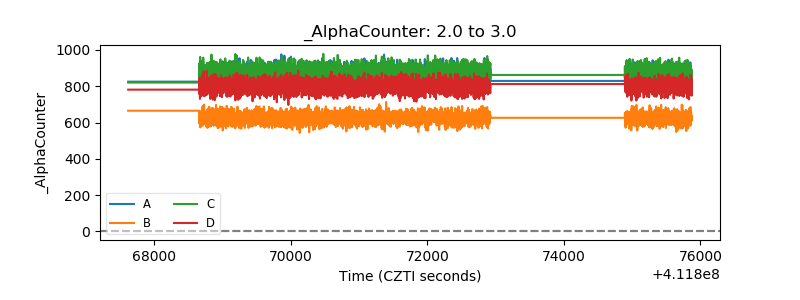 |
| _CPM_Rate | 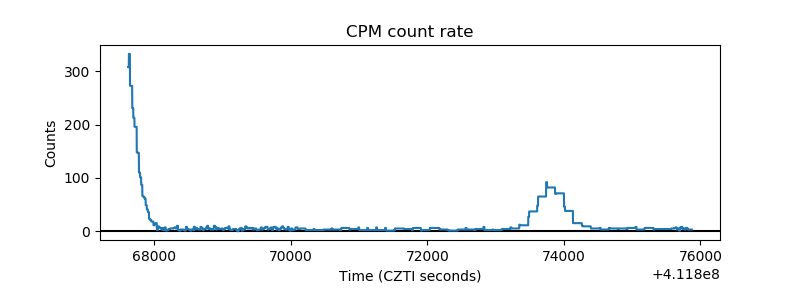 |
| CZT Counter | 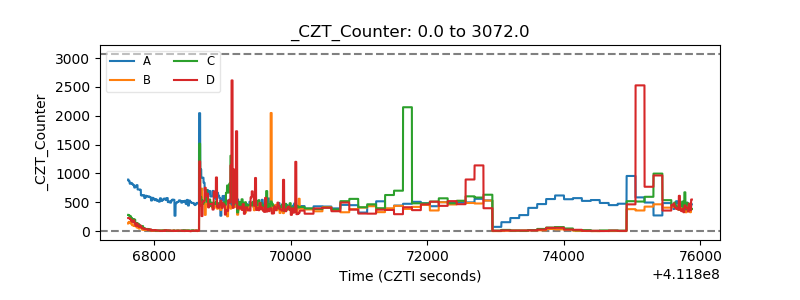 |
| +2.5 Volts monitor |  |
| +5 Volts monitor | 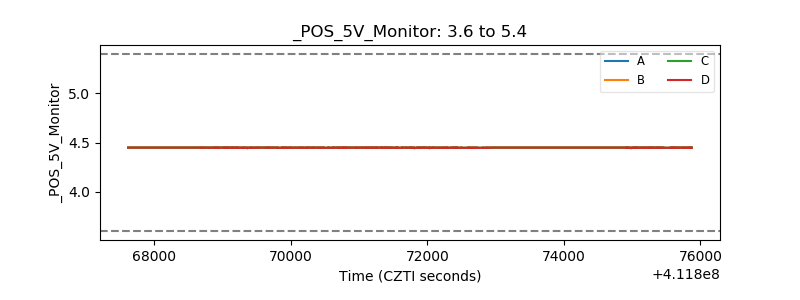 |
| _ROLL_ROT | 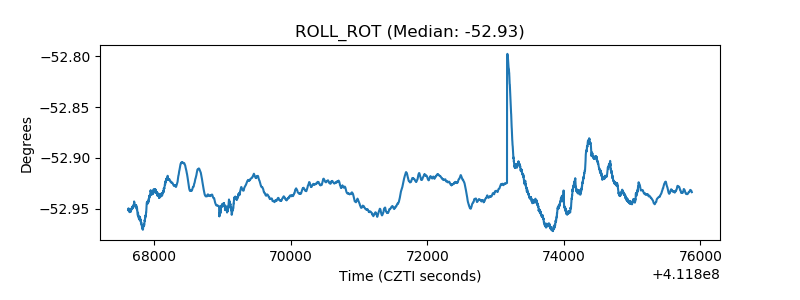 |
| _Roll_DEC | 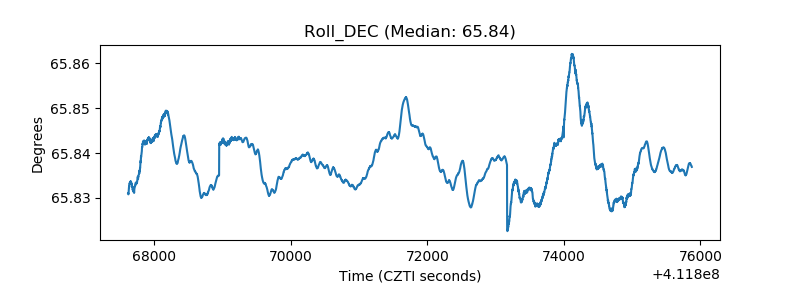 |
| _Roll_RA | 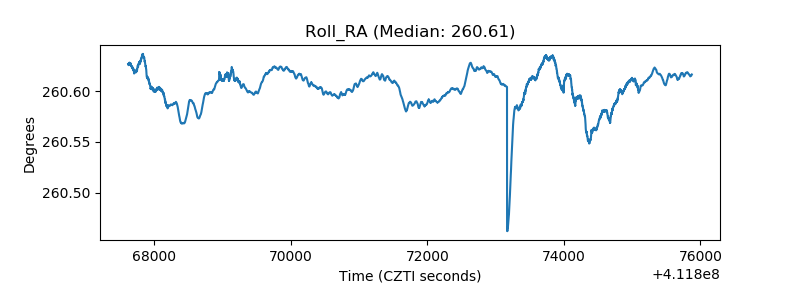 |
| Veto Counter | 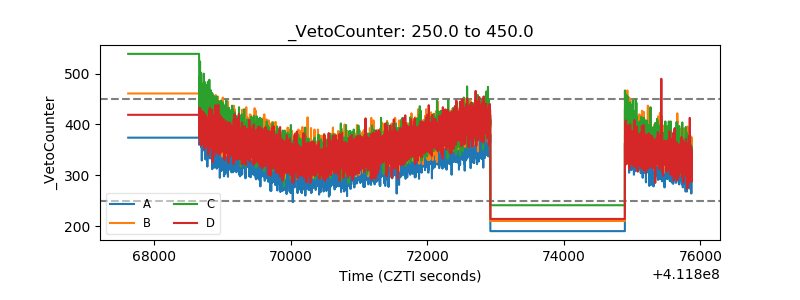 |