| Param | Original file | Final file |
|---|---|---|
| Filename | modeM0/AS1A12_018T01_9000005488_39537cztM0_level2.fits | modeM0/AS1A12_018T01_9000005488_39537cztM0_level2_quad_clean.evt |
| Size (bytes) | 350,017,920 | 89,910,720 |
| Size | 333.8 MB | 85.7 MB |
| Events in quadrant A | 3,287,046 | 589,176 |
| Events in quadrant B | 2,303,644 | 626,331 |
| Events in quadrant C | 3,643,559 | 578,983 |
| Events in quadrant D | 3,287,976 | 538,050 |
| Mode SS | |||
|---|---|---|---|
| Quadrant | BADHDUFLAG | Total packets | Discarded packets |
| A | 0 | 114 | 0 |
| B | 0 | 114 | 0 |
| C | 0 | 114 | 0 |
| D | 0 | 114 | 0 |
| Mode M0 | |||
|---|---|---|---|
| Quadrant | BADHDUFLAG | Total packets | Discarded packets |
| A | 0 | 13420 | 3 |
| B | 0 | 11181 | 2 |
| C | 0 | 14519 | 2 |
| D | 0 | 13895 | 2 |
| Mode M9 | |||
|---|---|---|---|
| Quadrant | BADHDUFLAG | Total packets | Discarded packets |
| A | 0 | 29 | 0 |
| B | 0 | 29 | 0 |
| C | 0 | 29 | 0 |
| D | 0 | 30 | 0 |
| Quadrant | Total seconds | Saturated seconds | Saturation percentage |
|---|---|---|---|
| A | 5573 | 146 | 2.619774% |
| B | 5573 | 7 | 0.125606% |
| C | 5573 | 267 | 4.790956% |
| D | 5573 | 172 | 3.086309% |
Noise dominated data is calculated using 1-second bins in cleaned event files. If a bin has >2000 counts, and if more than 50% of those come from <1% of pixels, then it is considered to be noise-dominated and hence unusable.
| Quadrant | # 1 sec bins | Bins with >0 counts | Bins with >2000 counts | High rate bins dominated by noise | Noise dominated (total time) | Noise dominated (detector-on time) | Marked lightcurve |
|---|---|---|---|---|---|---|---|
| A | 7246 | 5574 | 122 | 122 | 1.68% | 2.19% | 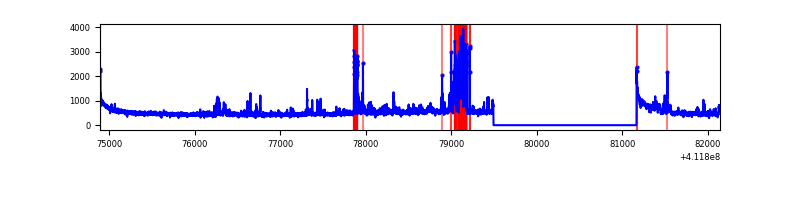 |
| B | 7246 | 5574 | 1 | 1 | 0.01% | 0.02% | 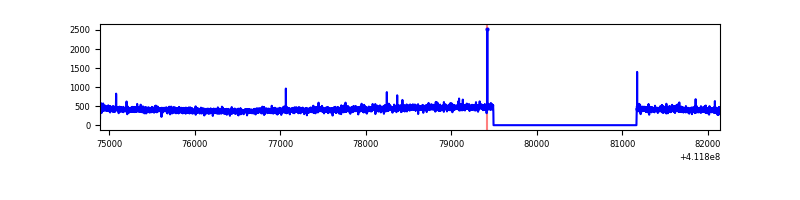 |
| C | 7246 | 5574 | 226 | 226 | 3.12% | 4.05% | 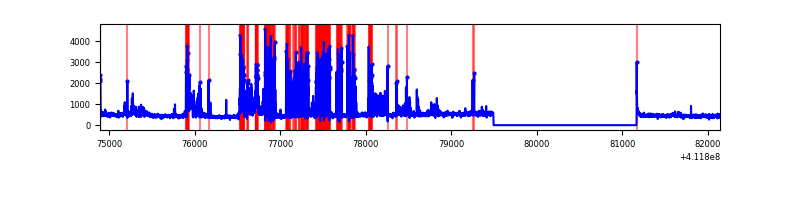 |
| D | 7246 | 5574 | 146 | 146 | 2.01% | 2.62% | 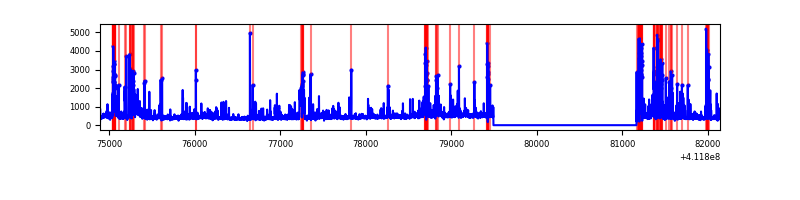 |
Top three noisy pixels from each quadrant. If the there are fewer than three noisy pixels in the level2.evt file, extra rows are filled as -1
| Pixel properties | Quadrant properties | ||||||
|---|---|---|---|---|---|---|---|
| Quadrant | DetID | PixID | Counts | Sigma | Mean | Median | Sigma |
| A | 6 | 10 | 454988 | 3909.09 | 575 | 564 | 116.2 |
| A | 10 | 83 | 435787 | 3743.92 | 575 | 564 | 116.2 |
| A | 15 | 222 | 152690 | 1308.63 | 575 | 564 | 116.2 |
| B | 12 | 111 | 14306 | 122.67 | 582 | 568 | 112.0 |
| B | 11 | 111 | 12954 | 110.6 | 582 | 568 | 112.0 |
| B | 14 | 111 | 12631 | 107.71 | 582 | 568 | 112.0 |
| C | 15 | 208 | 905350 | 6926.19 | 558 | 562 | 130.6 |
| C | 9 | 187 | 291978 | 2230.8 | 558 | 562 | 130.6 |
| C | 15 | 214 | 230730 | 1761.95 | 558 | 562 | 130.6 |
| D | 12 | 227 | 878863 | 6361.82 | 558 | 540 | 138.1 |
| D | 13 | 249 | 145706 | 1051.46 | 558 | 540 | 138.1 |
| D | 2 | 250 | 63470 | 455.81 | 558 | 540 | 138.1 |
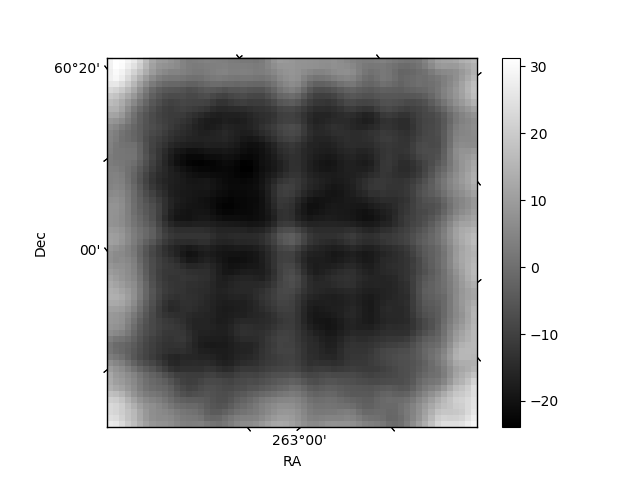
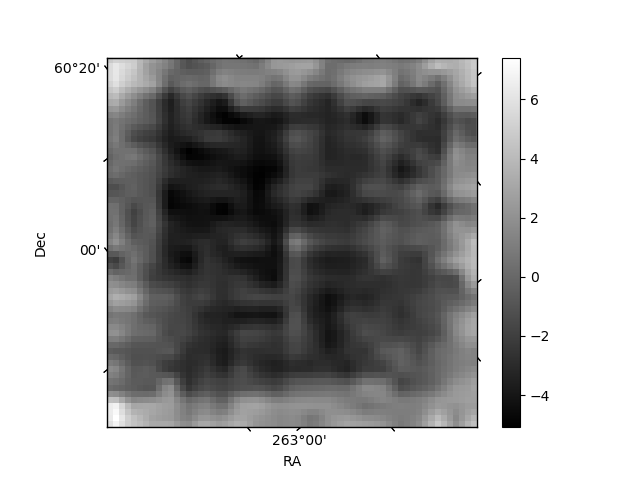
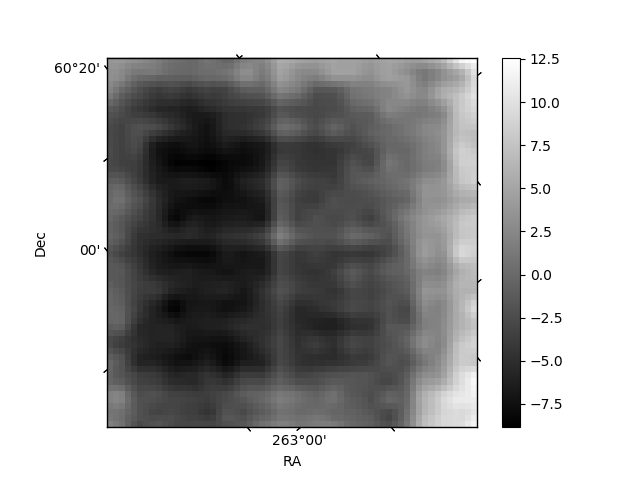
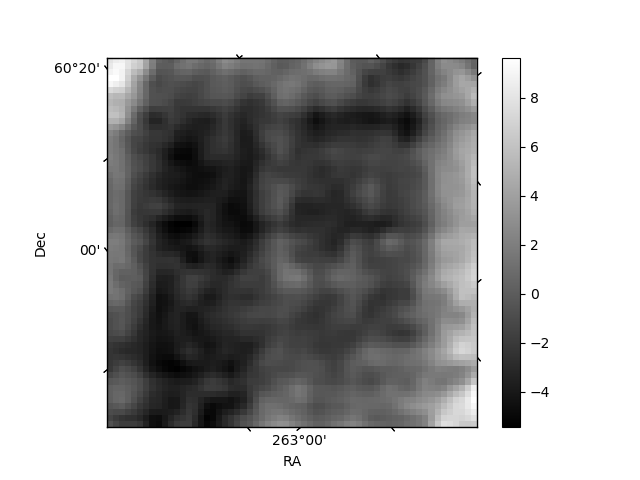
Histogram calculated using DETX and DETY for each event in the final _common_clean file
| Quadrant A | 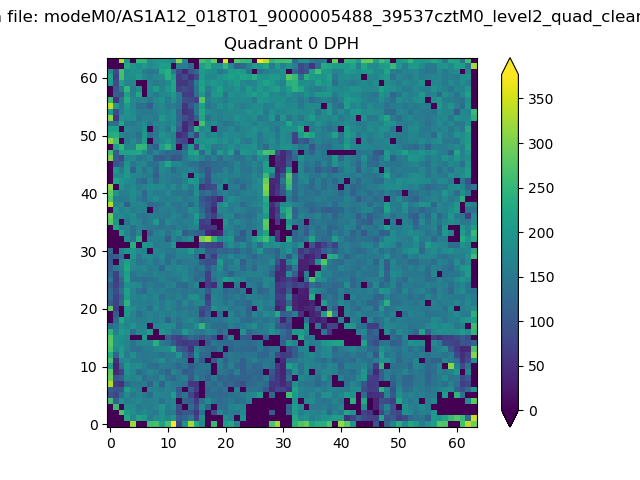 |
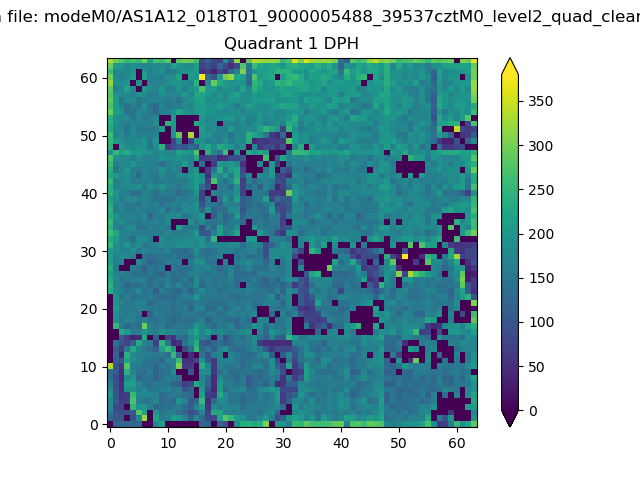 |
Quadrant B |
|---|---|---|---|
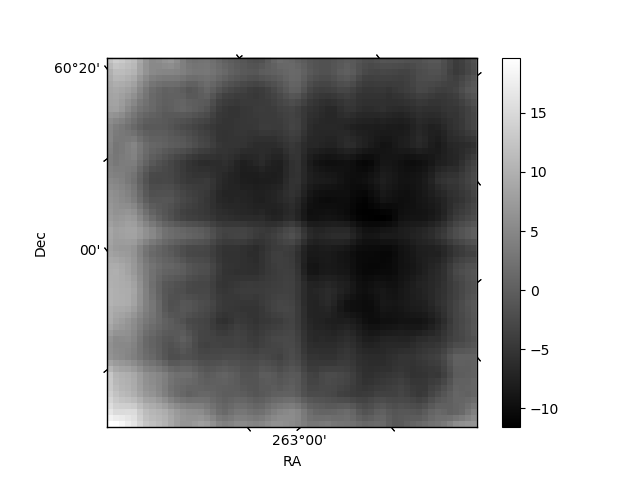
| Quadrant D | 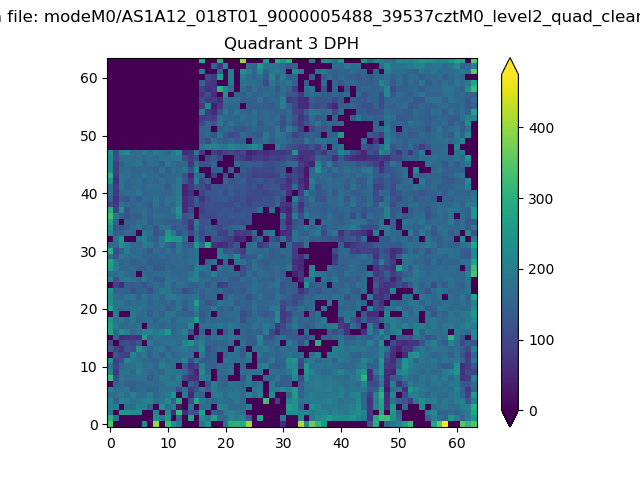 |
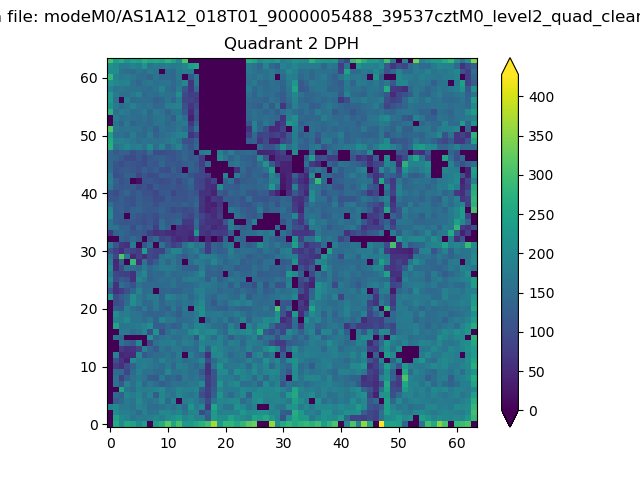 |
Quadrant C |
| Plot type | Count rate plots | Images |
|---|---|---|
| Comparison with Poisson distribution Blue bars denote a histogram of data divided into 1 sec bins. Red curve is a Poisson curve with rate = median count rate of data. |
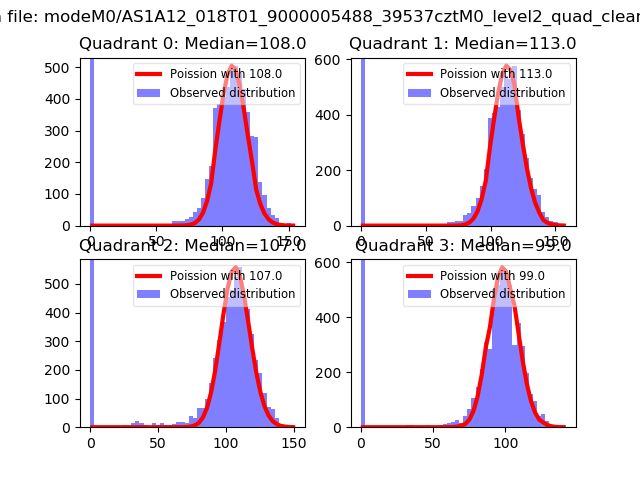 |
 |
| Quadrant-wise count rates Data is divided into 100 sec bins |
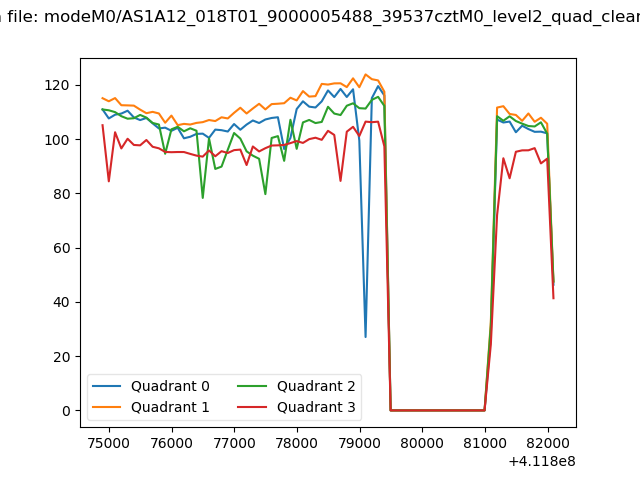 |
|
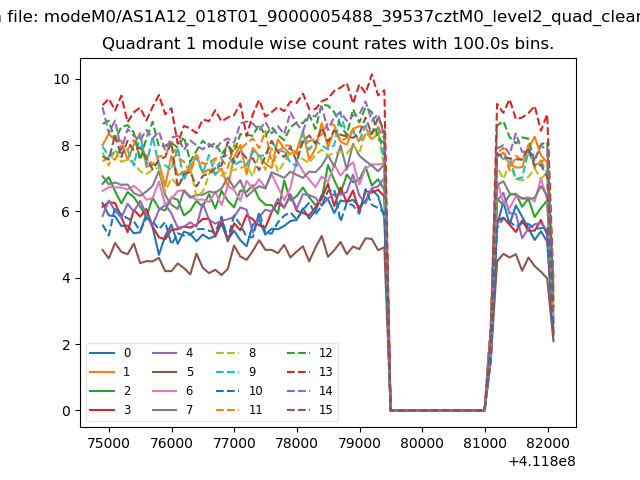
| Module-wise count rates for Quadrant A Data is divided into 100 sec bins |
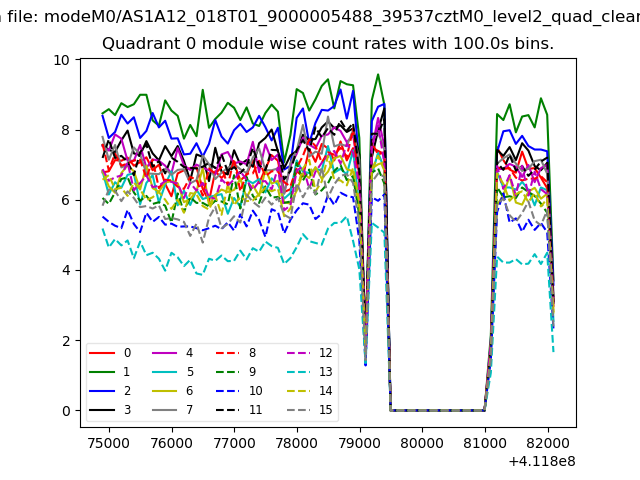 |
 |
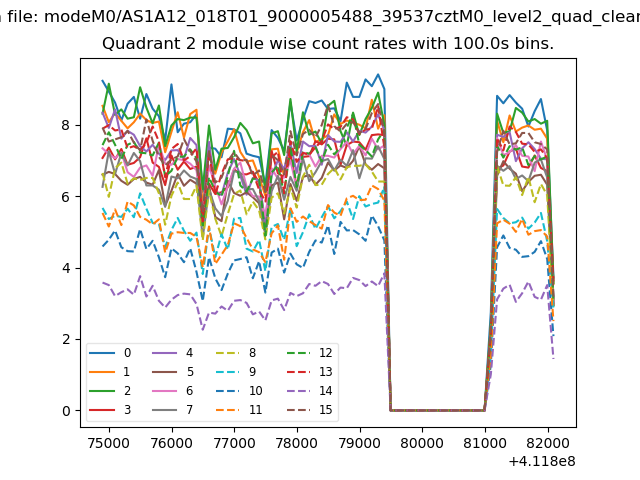
| Module-wise count rates for Quadrant B Data is divided into 100 sec bins |
 |
 |
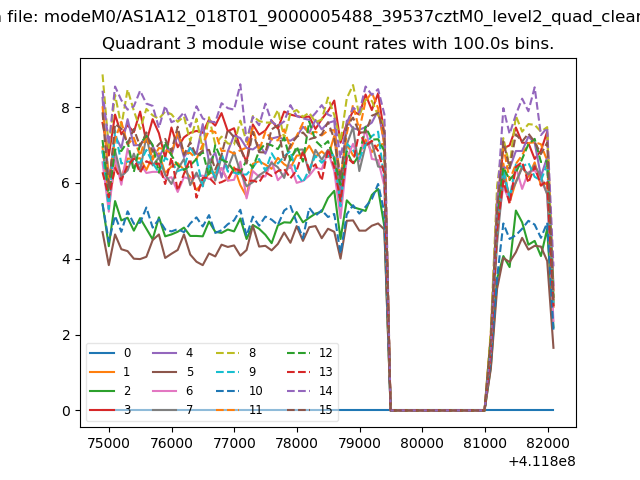
| Module-wise count rates for Quadrant C Data is divided into 100 sec bins |
 |
 |
| Module-wise count rates for Quadrant D Data is divided into 100 sec bins |
 |
 |
| Parameter | Plot |
|---|---|
| CZT HV Monitor | 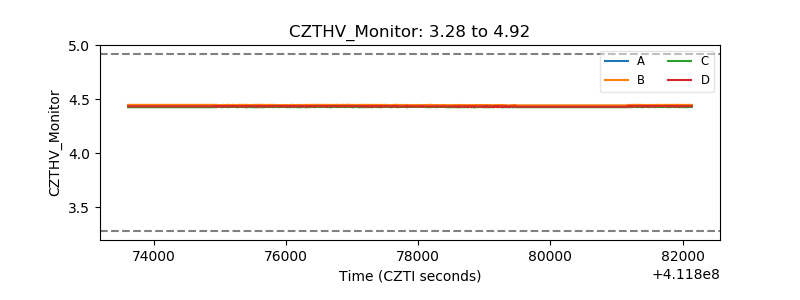 |
| D_VDD | 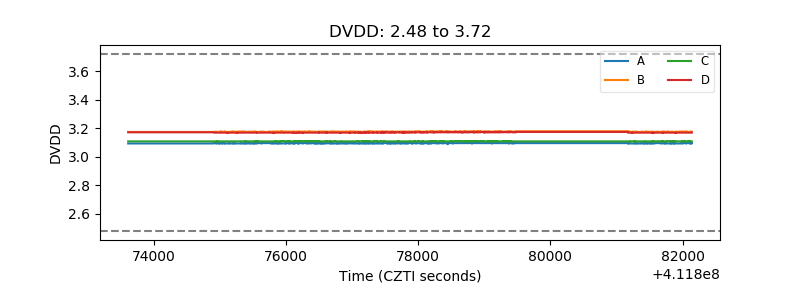 |
| Temperature 1 | 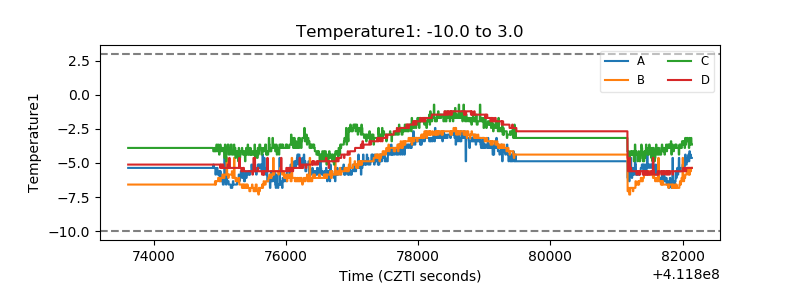 |
| Veto HV Monitor | 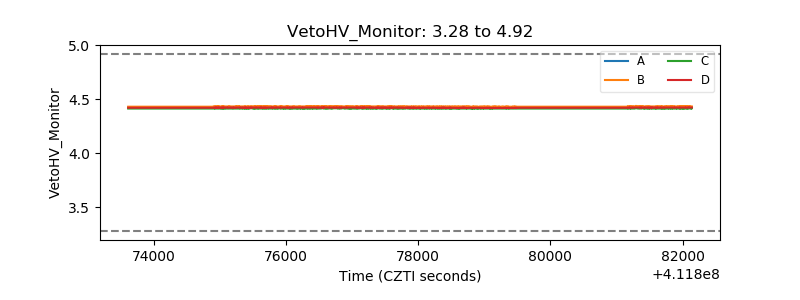 |
| Veto LLD | 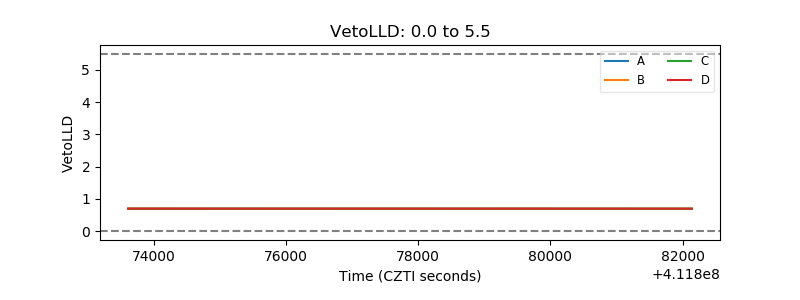 |
| Alpha Counter | 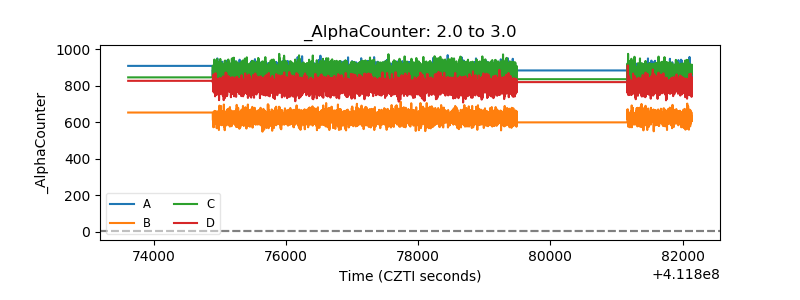 |
| _CPM_Rate | 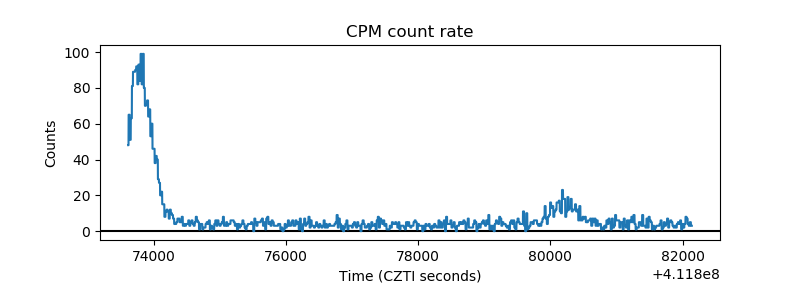 |
| CZT Counter | 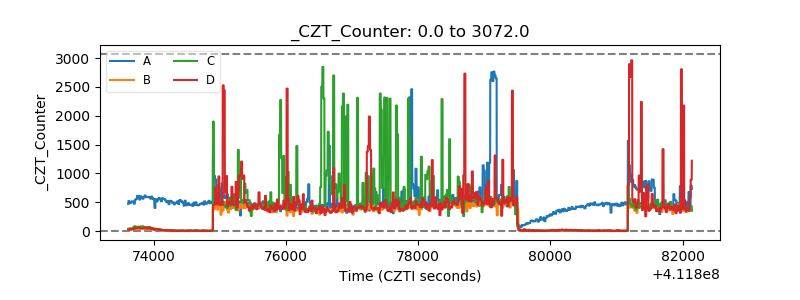 |
| +2.5 Volts monitor | 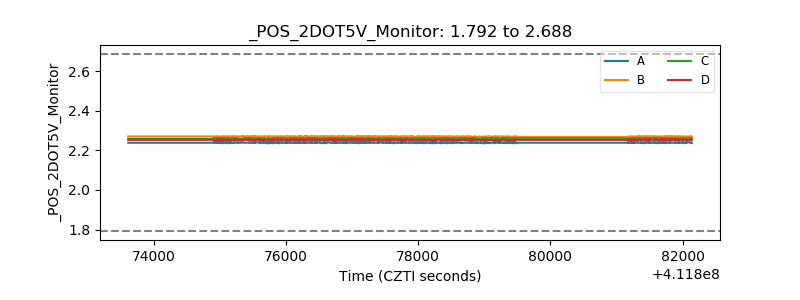 |
| +5 Volts monitor | 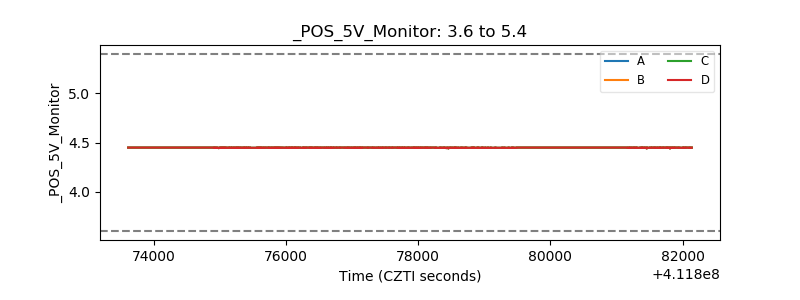 |
| _ROLL_ROT | 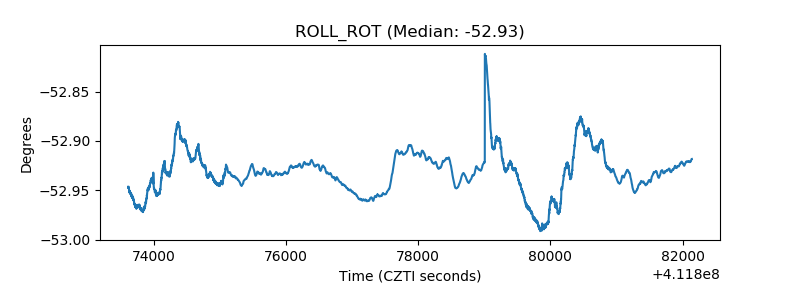 |
| _Roll_DEC | 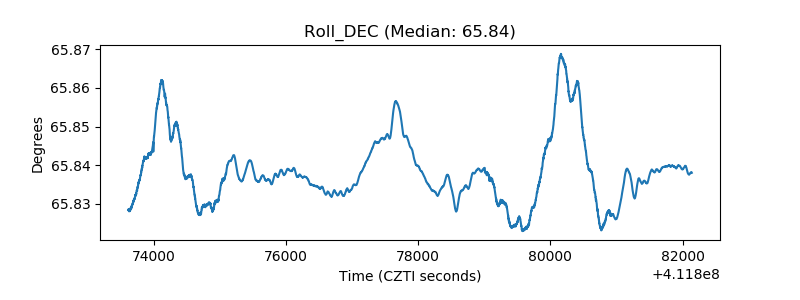 |
| _Roll_RA | 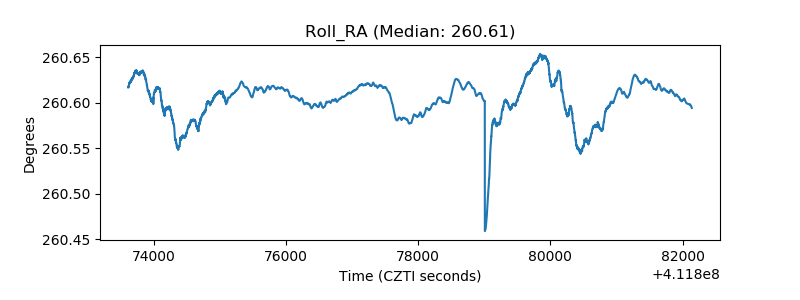 |
| Veto Counter | 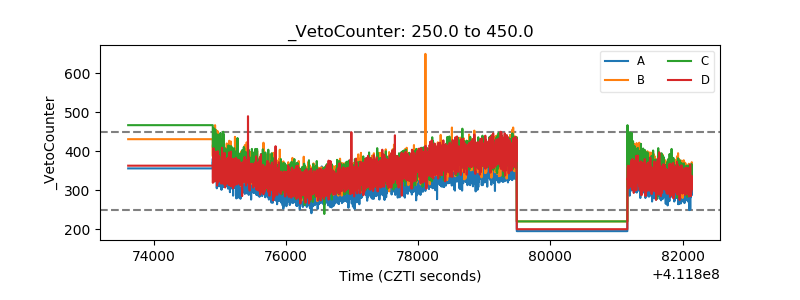 |