| Param | Original file | Final file |
|---|---|---|
| Filename | modeM0/AS1A12_018T01_9000005488_39538cztM0_level2.fits | modeM0/AS1A12_018T01_9000005488_39538cztM0_level2_quad_clean.evt |
| Size (bytes) | 373,636,800 | 88,407,360 |
| Size | 356.3 MB | 84.3 MB |
| Events in quadrant A | 2,972,207 | 598,390 |
| Events in quadrant B | 2,309,190 | 617,258 |
| Events in quadrant C | 4,855,849 | 538,047 |
| Events in quadrant D | 3,260,811 | 534,650 |
| Mode SS | |||
|---|---|---|---|
| Quadrant | BADHDUFLAG | Total packets | Discarded packets |
| A | 0 | 112 | 0 |
| B | 0 | 112 | 0 |
| C | 0 | 112 | 0 |
| D | 0 | 112 | 0 |
| Mode M0 | |||
|---|---|---|---|
| Quadrant | BADHDUFLAG | Total packets | Discarded packets |
| A | 0 | 12342 | 2 |
| B | 0 | 11135 | 5 |
| C | 0 | 18323 | 1 |
| D | 0 | 13756 | 2 |
| Mode M9 | |||
|---|---|---|---|
| Quadrant | BADHDUFLAG | Total packets | Discarded packets |
| A | 0 | 14 | 0 |
| B | 0 | 14 | 0 |
| C | 0 | 14 | 0 |
| D | 0 | 14 | 0 |
| Quadrant | Total seconds | Saturated seconds | Saturation percentage |
|---|---|---|---|
| A | 5558 | 17 | 0.305865% |
| B | 5555 | 5 | 0.090009% |
| C | 5558 | 553 | 9.949622% |
| D | 5557 | 149 | 2.681303% |
Noise dominated data is calculated using 1-second bins in cleaned event files. If a bin has >2000 counts, and if more than 50% of those come from <1% of pixels, then it is considered to be noise-dominated and hence unusable.
| Quadrant | # 1 sec bins | Bins with >0 counts | Bins with >2000 counts | High rate bins dominated by noise | Noise dominated (total time) | Noise dominated (detector-on time) | Marked lightcurve |
|---|---|---|---|---|---|---|---|
| A | 6933 | 5559 | 14 | 14 | 0.20% | 0.25% | 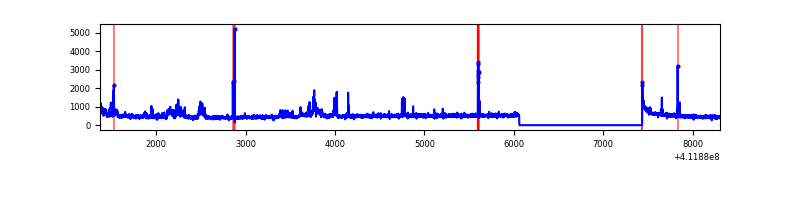 |
| B | 6933 | 5558 | 1 | 1 | 0.01% | 0.02% | 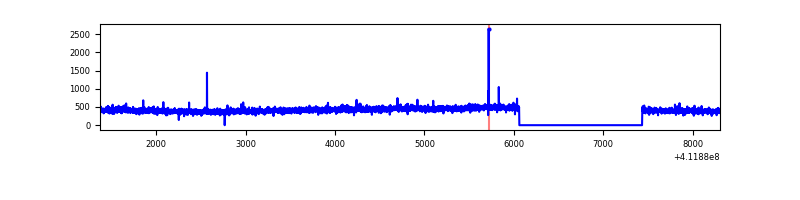 |
| C | 6933 | 5559 | 505 | 505 | 7.28% | 9.08% | 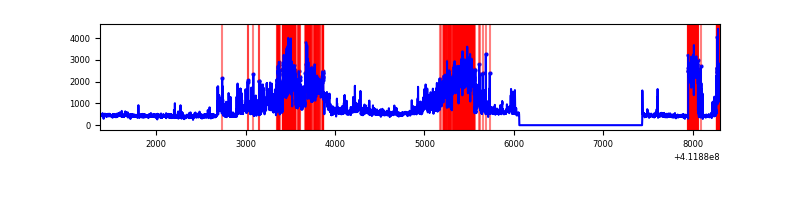 |
| D | 6933 | 5559 | 140 | 140 | 2.02% | 2.52% | 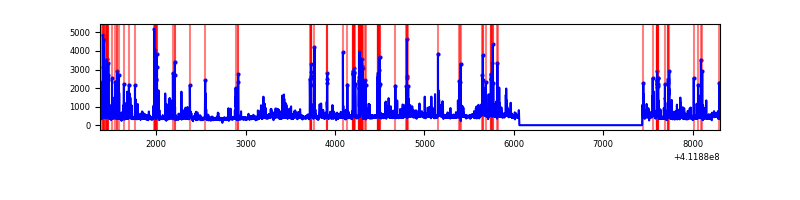 |
Top three noisy pixels from each quadrant. If the there are fewer than three noisy pixels in the level2.evt file, extra rows are filled as -1
| Pixel properties | Quadrant properties | ||||||
|---|---|---|---|---|---|---|---|
| Quadrant | DetID | PixID | Counts | Sigma | Mean | Median | Sigma |
| A | 10 | 83 | 382283 | 3180.71 | 583 | 571 | 120.0 |
| A | 6 | 10 | 296421 | 2465.25 | 583 | 571 | 120.0 |
| A | 15 | 222 | 24952 | 203.16 | 583 | 571 | 120.0 |
| B | 12 | 111 | 14317 | 121.65 | 582 | 563 | 113.1 |
| B | 11 | 111 | 13269 | 112.38 | 582 | 563 | 113.1 |
| B | 14 | 111 | 12405 | 104.74 | 582 | 563 | 113.1 |
| C | 9 | 187 | 2013072 | 15648.43 | 552 | 554 | 128.6 |
| C | 15 | 208 | 450536 | 3498.86 | 552 | 554 | 128.6 |
| C | 15 | 214 | 222989 | 1729.55 | 552 | 554 | 128.6 |
| D | 12 | 227 | 841469 | 6034.65 | 564 | 545 | 139.3 |
| D | 13 | 249 | 126716 | 905.43 | 564 | 545 | 139.3 |
| D | 2 | 250 | 73995 | 527.09 | 564 | 545 | 139.3 |
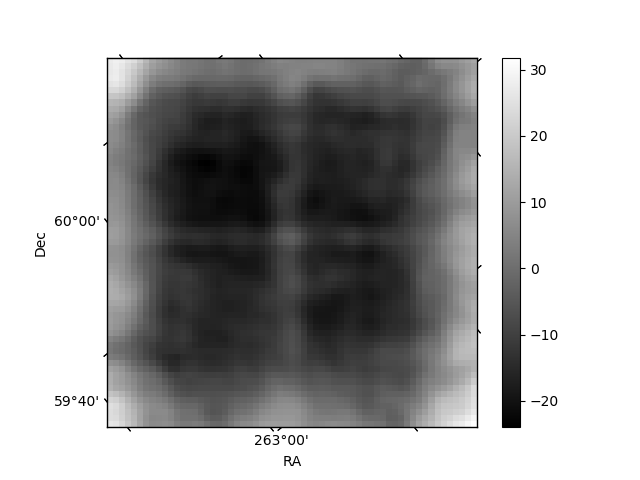
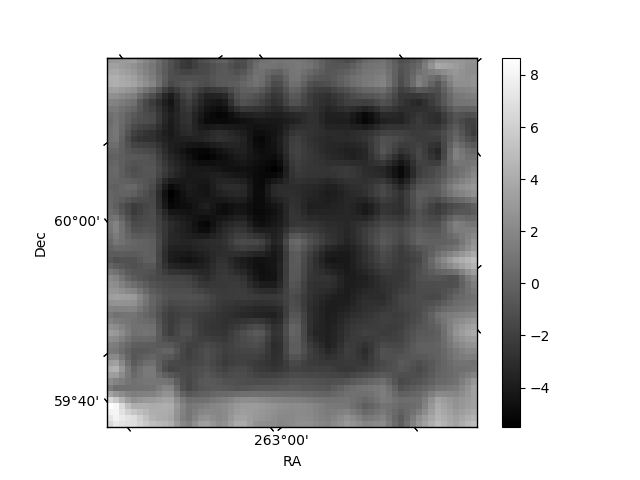
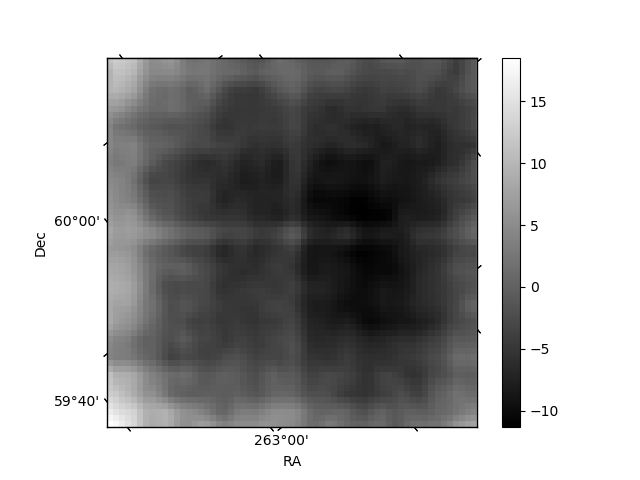
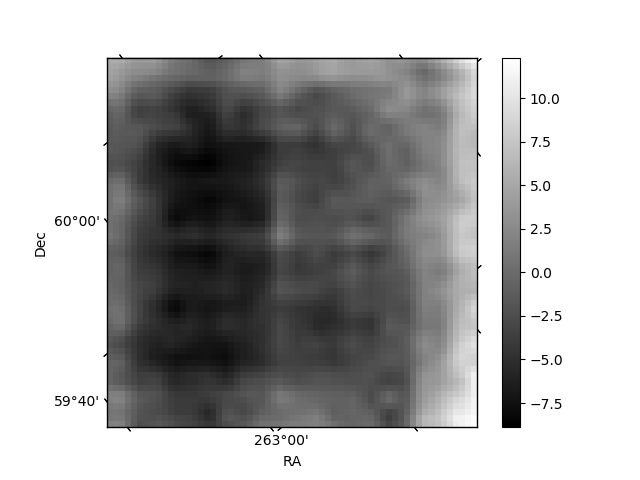
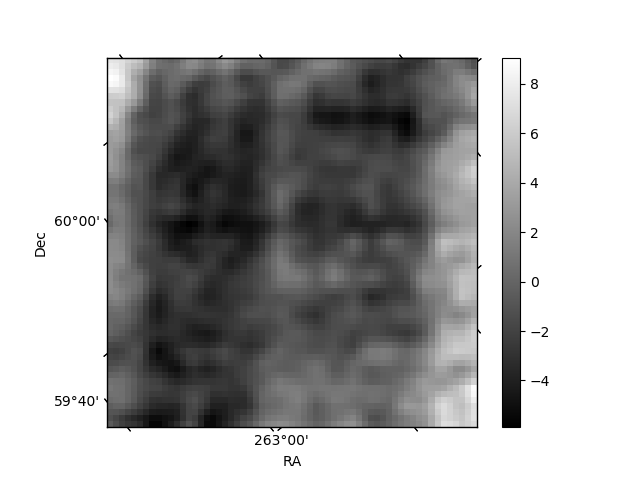
Histogram calculated using DETX and DETY for each event in the final _common_clean file
| Quadrant A | 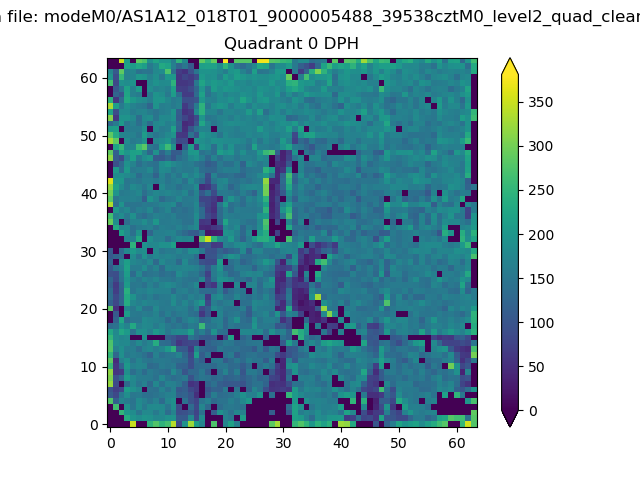 |
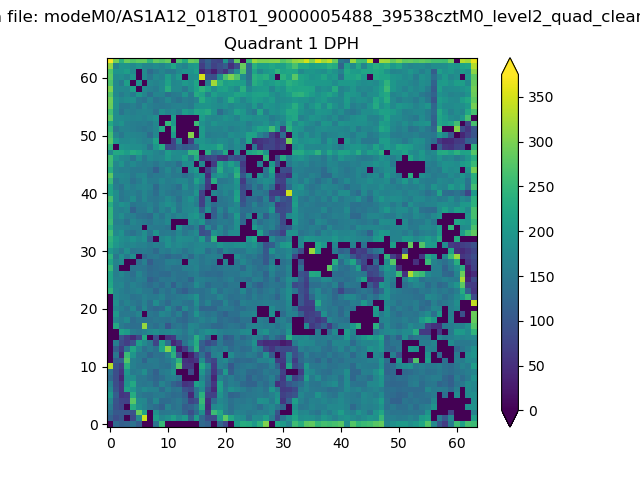 |
Quadrant B |
|---|---|---|---|
| Quadrant D | 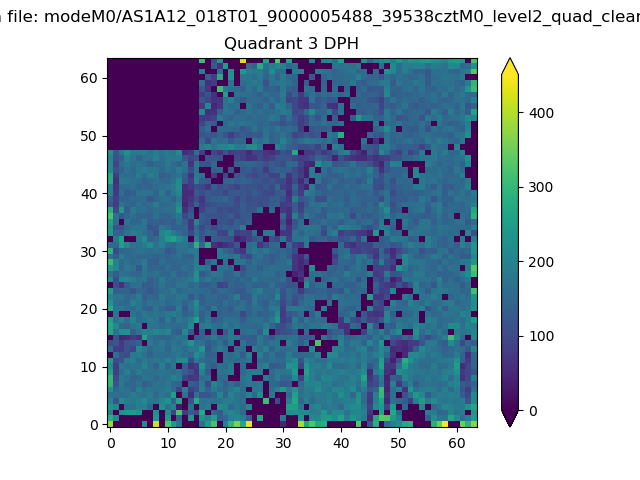 |
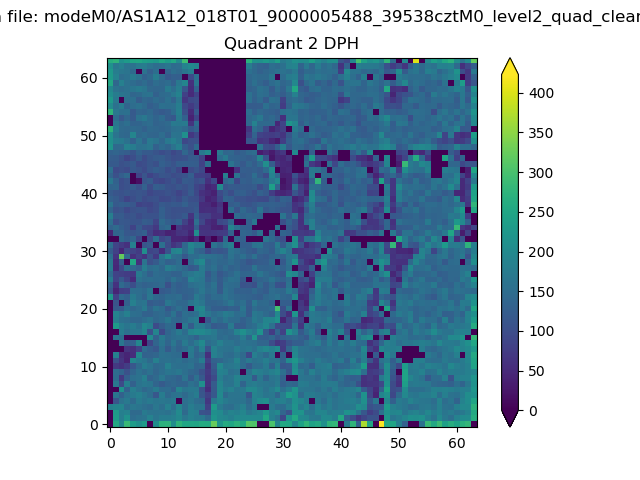 |
Quadrant C |
| Plot type | Count rate plots | Images |
|---|---|---|
| Comparison with Poisson distribution Blue bars denote a histogram of data divided into 1 sec bins. Red curve is a Poisson curve with rate = median count rate of data. |
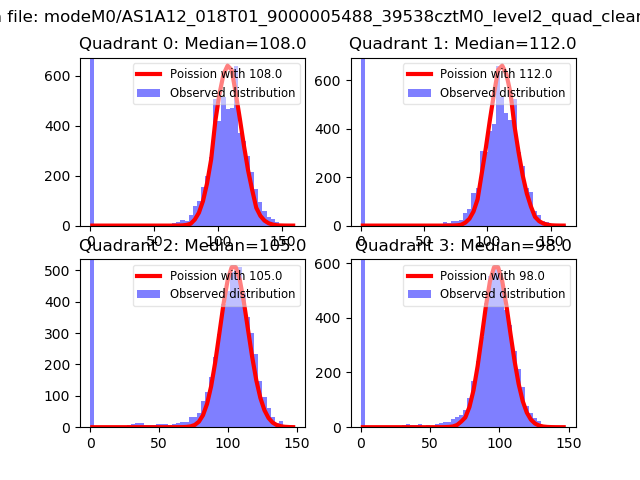 |
 |
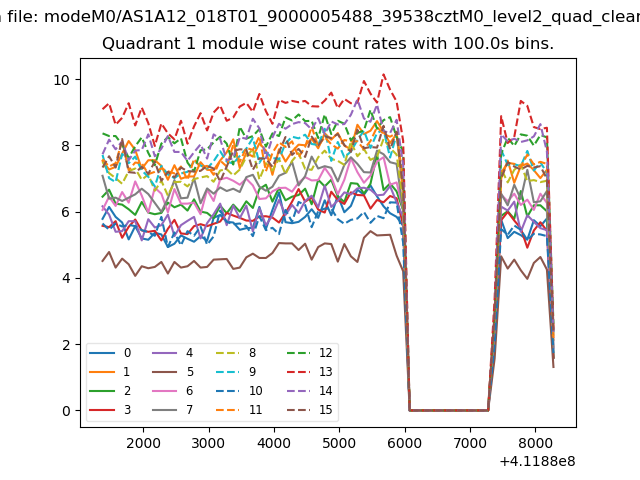
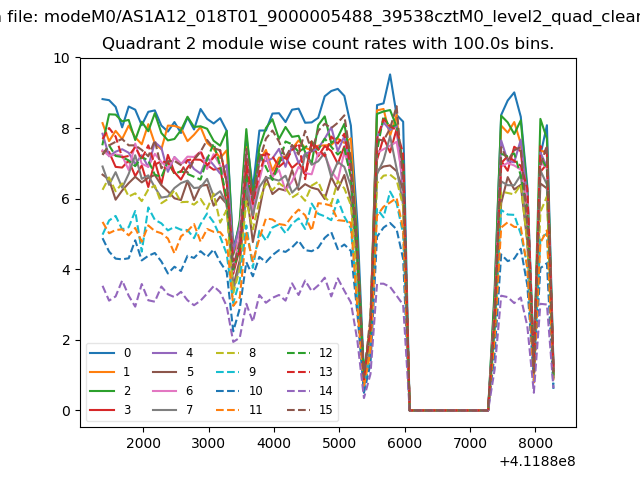
| Quadrant-wise count rates Data is divided into 100 sec bins |
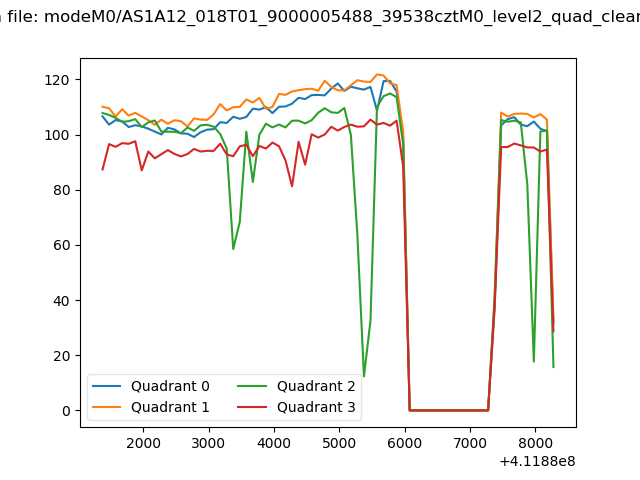 |
|
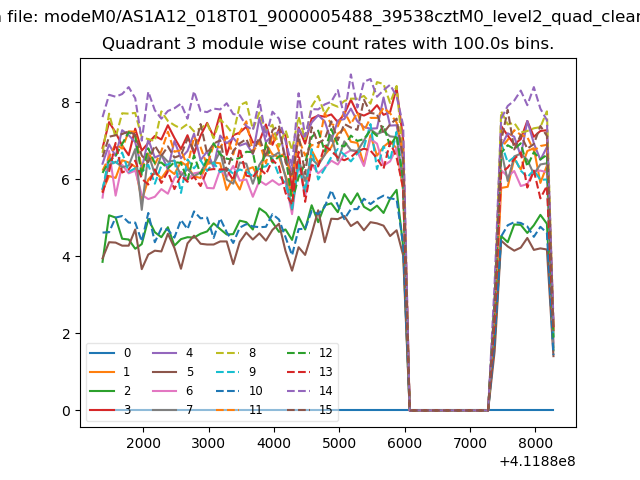
| Module-wise count rates for Quadrant A Data is divided into 100 sec bins |
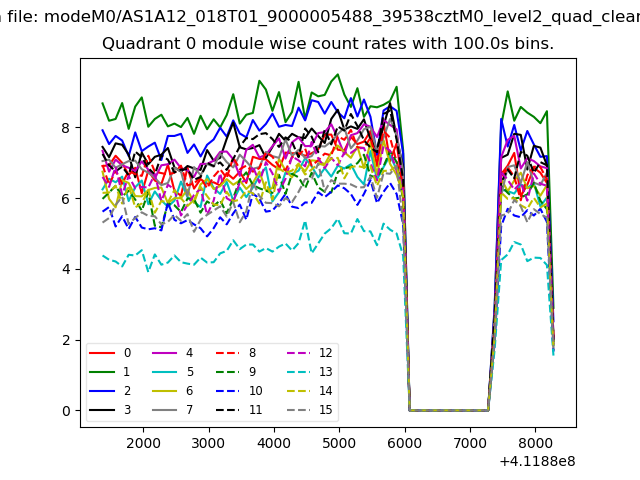 |
 |
| Module-wise count rates for Quadrant B Data is divided into 100 sec bins |
 |
 |
| Module-wise count rates for Quadrant C Data is divided into 100 sec bins |
 |
 |
| Module-wise count rates for Quadrant D Data is divided into 100 sec bins |
 |
 |
| Parameter | Plot |
|---|---|
| CZT HV Monitor | 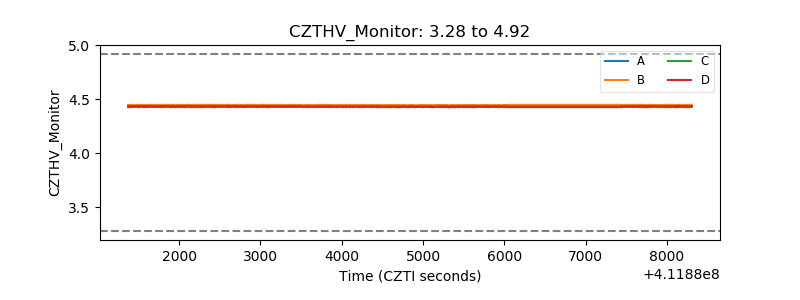 |
| D_VDD | 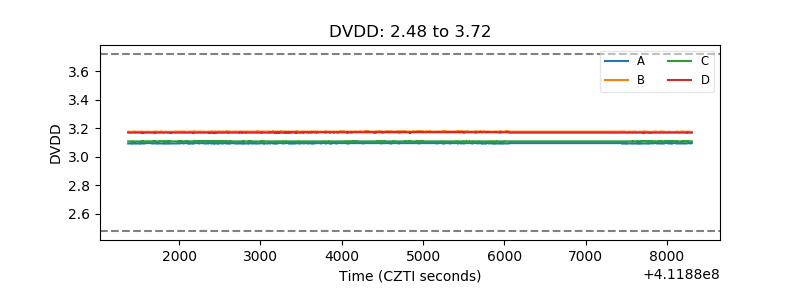 |
| Temperature 1 | 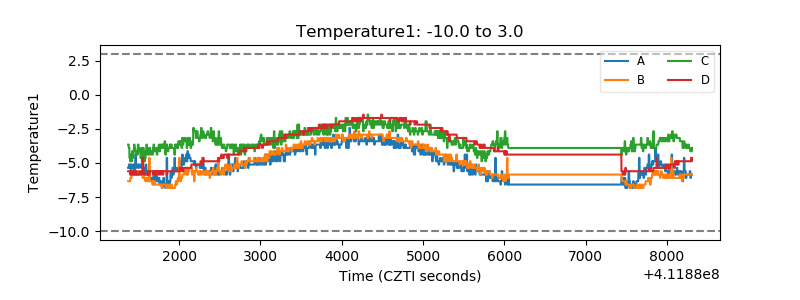 |
| Veto HV Monitor | 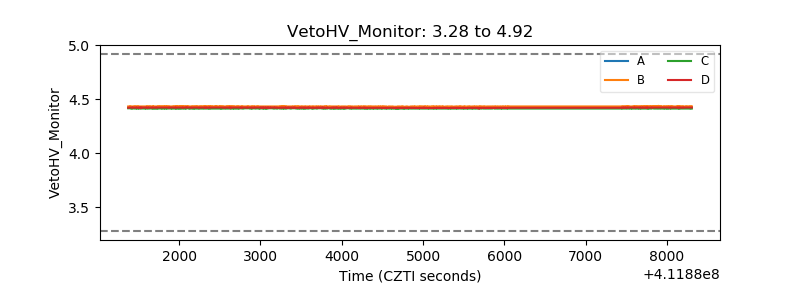 |
| Veto LLD | 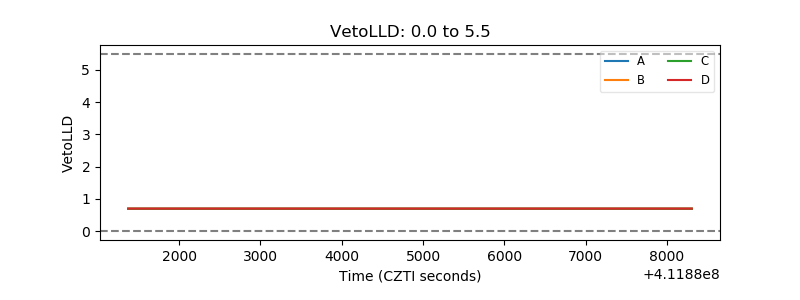 |
| Alpha Counter | 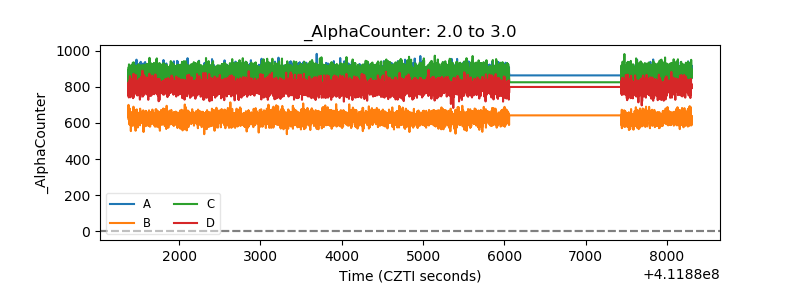 |
| _CPM_Rate | 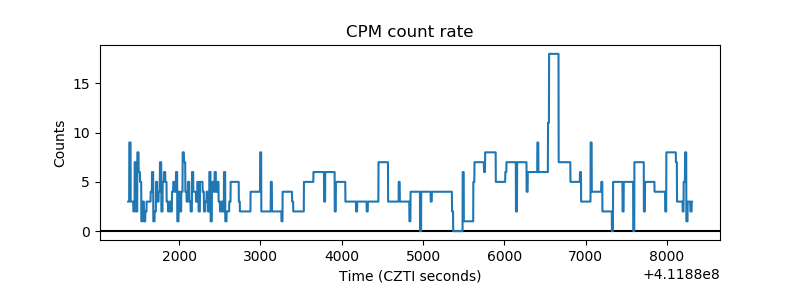 |
| CZT Counter | 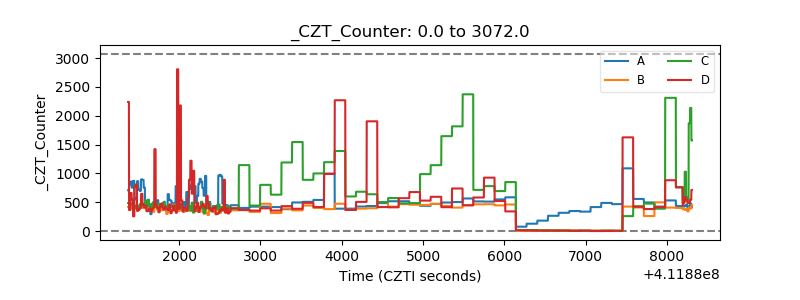 |
| +2.5 Volts monitor | 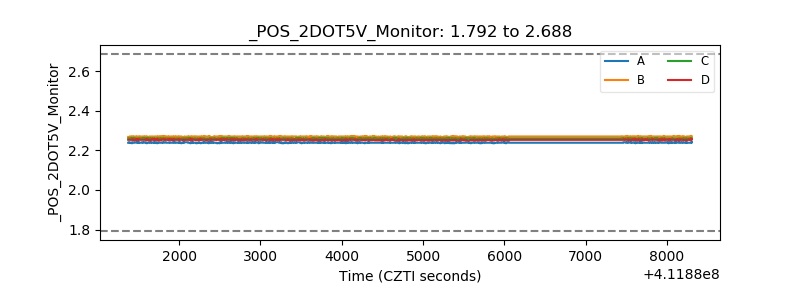 |
| +5 Volts monitor | 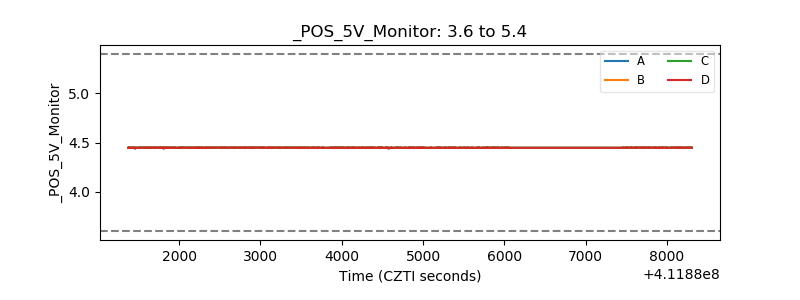 |
| _ROLL_ROT | 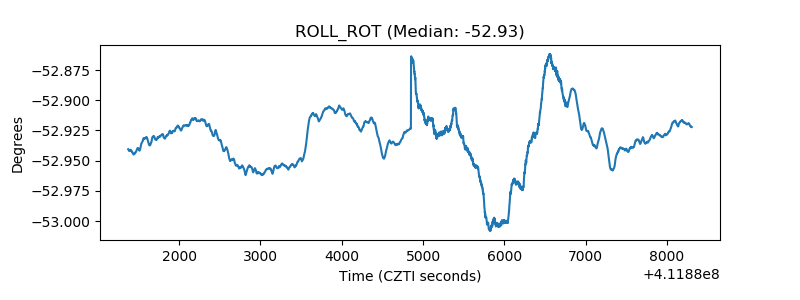 |
| _Roll_DEC | 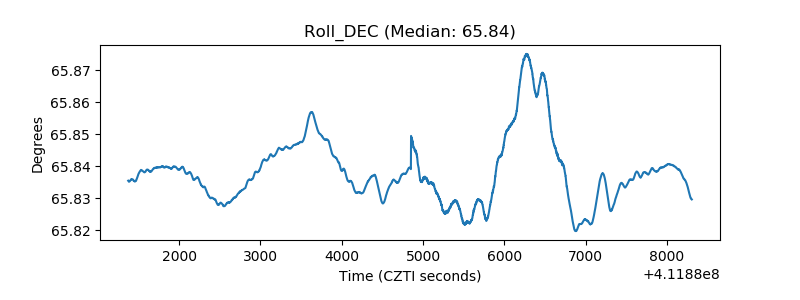 |
| _Roll_RA | 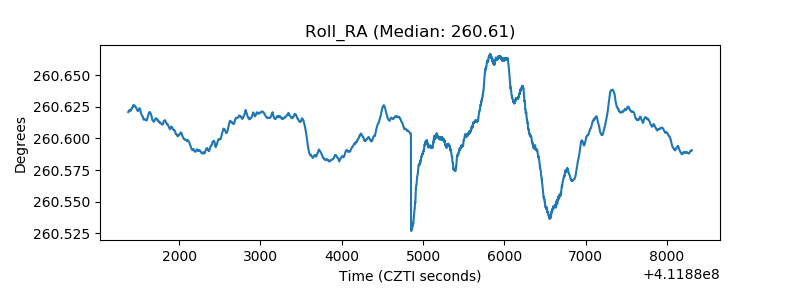 |
| Veto Counter | 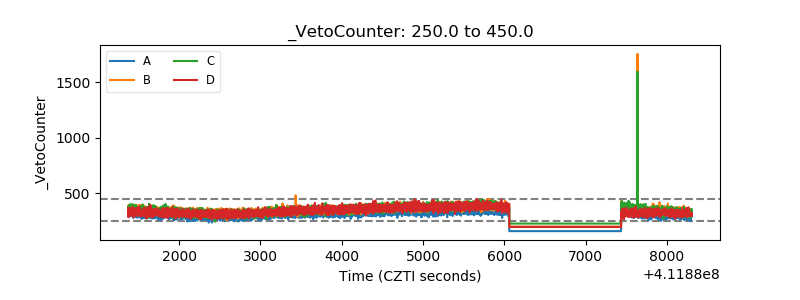 |