| Param | Original file | Final file |
|---|---|---|
| Filename | modeM0/AS1A12_018T01_9000005488_39539cztM0_level2.fits | modeM0/AS1A12_018T01_9000005488_39539cztM0_level2_quad_clean.evt |
| Size (bytes) | 416,528,640 | 92,439,360 |
| Size | 397.2 MB | 88.2 MB |
| Events in quadrant A | 3,823,660 | 608,510 |
| Events in quadrant B | 2,472,469 | 653,141 |
| Events in quadrant C | 5,401,682 | 554,600 |
| Events in quadrant D | 3,261,590 | 570,203 |
| Mode SS | |||
|---|---|---|---|
| Quadrant | BADHDUFLAG | Total packets | Discarded packets |
| A | 0 | 120 | 0 |
| B | 0 | 120 | 0 |
| C | 0 | 120 | 0 |
| D | 0 | 120 | 0 |
| Mode M0 | |||
|---|---|---|---|
| Quadrant | BADHDUFLAG | Total packets | Discarded packets |
| A | 0 | 15112 | 3 |
| B | 0 | 11841 | 2 |
| C | 0 | 20129 | 2 |
| D | 0 | 13929 | 2 |
| Mode M9 | |||
|---|---|---|---|
| Quadrant | BADHDUFLAG | Total packets | Discarded packets |
| A | 0 | 17 | 0 |
| B | 0 | 17 | 0 |
| C | 0 | 17 | 0 |
| D | 0 | 18 | 0 |
| Quadrant | Total seconds | Saturated seconds | Saturation percentage |
|---|---|---|---|
| A | 5902 | 266 | 4.506947% |
| B | 5902 | 8 | 0.135547% |
| C | 5902 | 679 | 11.504575% |
| D | 5902 | 53 | 0.898001% |
Noise dominated data is calculated using 1-second bins in cleaned event files. If a bin has >2000 counts, and if more than 50% of those come from <1% of pixels, then it is considered to be noise-dominated and hence unusable.
| Quadrant | # 1 sec bins | Bins with >0 counts | Bins with >2000 counts | High rate bins dominated by noise | Noise dominated (total time) | Noise dominated (detector-on time) | Marked lightcurve |
|---|---|---|---|---|---|---|---|
| A | 7215 | 5903 | 229 | 229 | 3.17% | 3.88% | 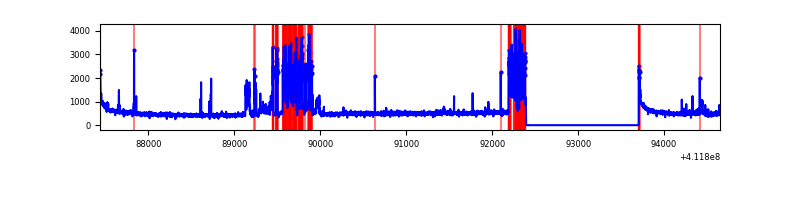 |
| B | 7215 | 5903 | 0 | 0 | 0.00% | 0.00% | 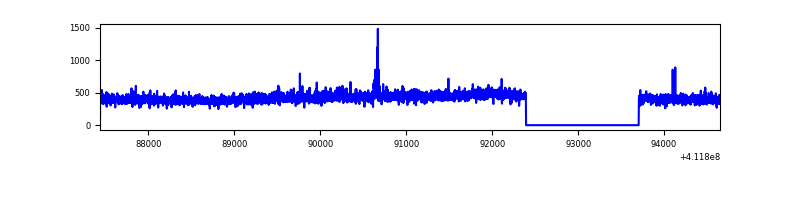 |
| C | 7215 | 5903 | 642 | 642 | 8.90% | 10.88% | 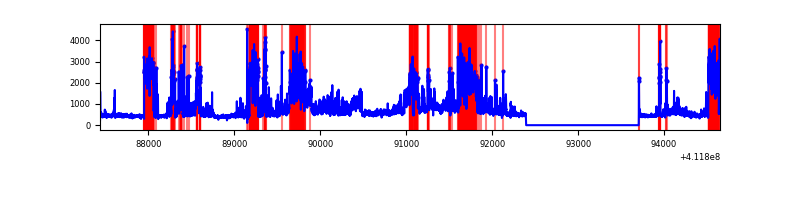 |
| D | 7215 | 5903 | 52 | 52 | 0.72% | 0.88% | 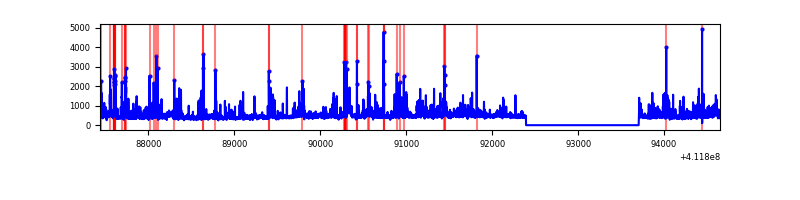 |
Top three noisy pixels from each quadrant. If the there are fewer than three noisy pixels in the level2.evt file, extra rows are filled as -1
| Pixel properties | Quadrant properties | ||||||
|---|---|---|---|---|---|---|---|
| Quadrant | DetID | PixID | Counts | Sigma | Mean | Median | Sigma |
| A | 6 | 10 | 965250 | 7759.48 | 612 | 599 | 124.3 |
| A | 10 | 83 | 447293 | 3593.12 | 612 | 599 | 124.3 |
| A | 15 | 222 | 33174 | 262.03 | 612 | 599 | 124.3 |
| B | 0 | 197 | 18934 | 153.68 | 619 | 602 | 119.3 |
| B | 12 | 111 | 15481 | 124.73 | 619 | 602 | 119.3 |
| B | 11 | 111 | 14157 | 113.63 | 619 | 602 | 119.3 |
| C | 9 | 187 | 2313098 | 16977.59 | 584 | 586 | 136.2 |
| C | 15 | 208 | 553892 | 4062.16 | 584 | 586 | 136.2 |
| C | 15 | 214 | 239239 | 1752.1 | 584 | 586 | 136.2 |
| D | 12 | 227 | 731308 | 4891.37 | 606 | 587 | 149.4 |
| D | 13 | 249 | 77867 | 517.3 | 606 | 587 | 149.4 |
| D | 13 | 174 | 43923 | 290.09 | 606 | 587 | 149.4 |
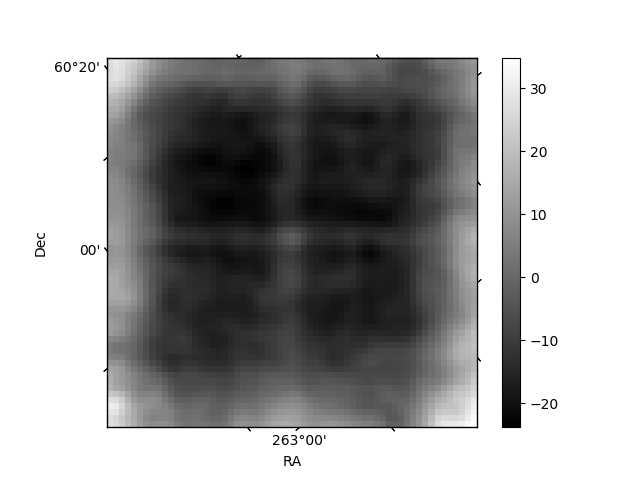
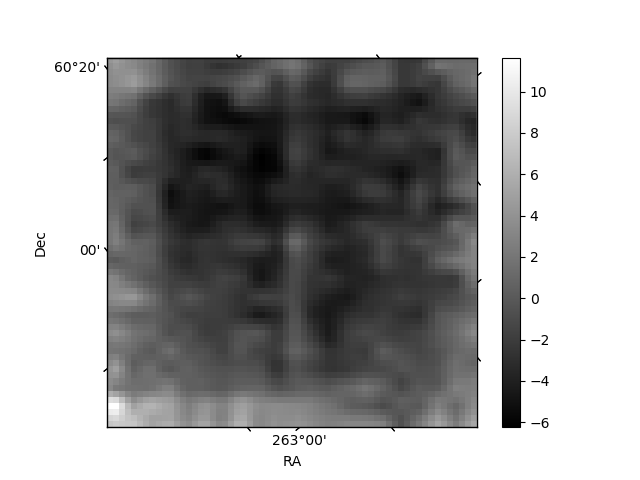
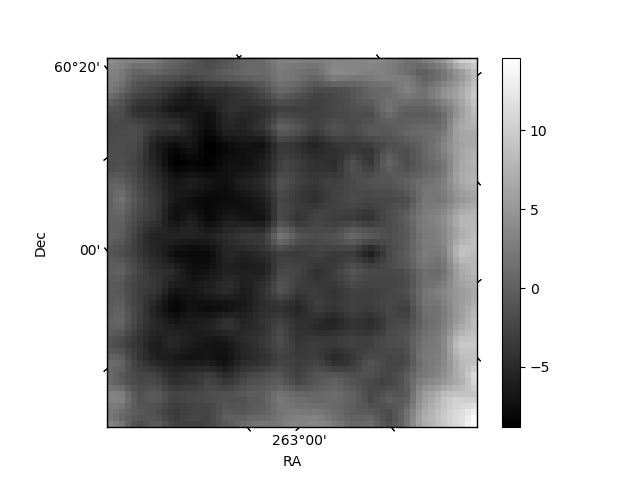
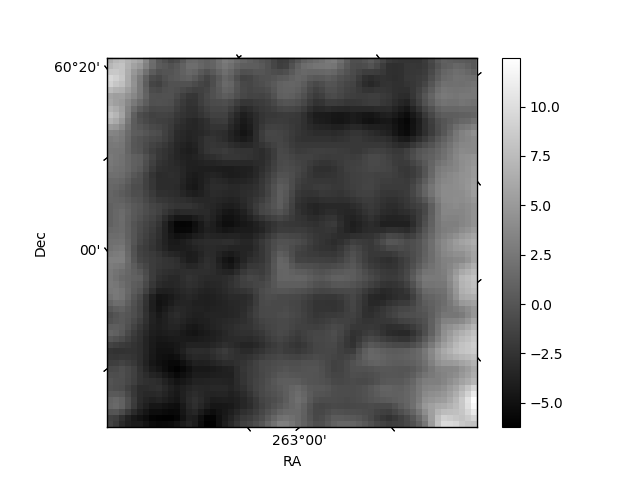
Histogram calculated using DETX and DETY for each event in the final _common_clean file
| Quadrant A | 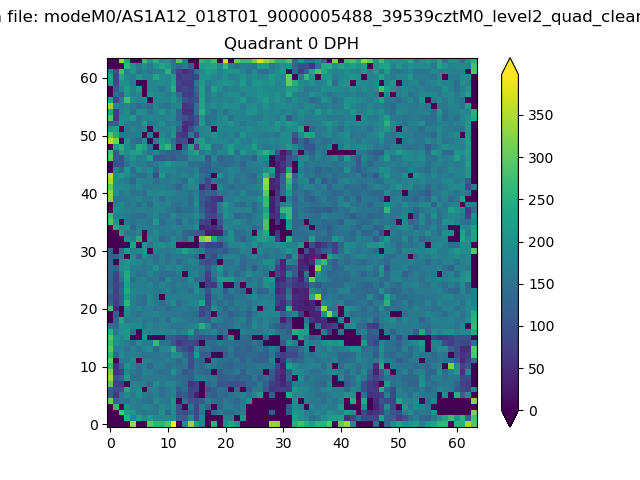 |
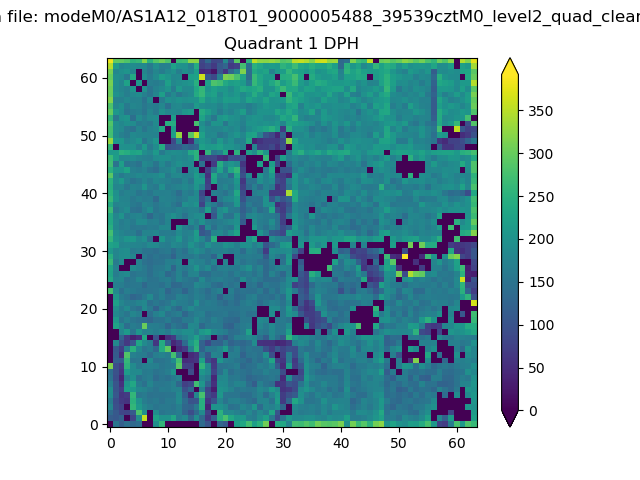 |
Quadrant B |
|---|---|---|---|
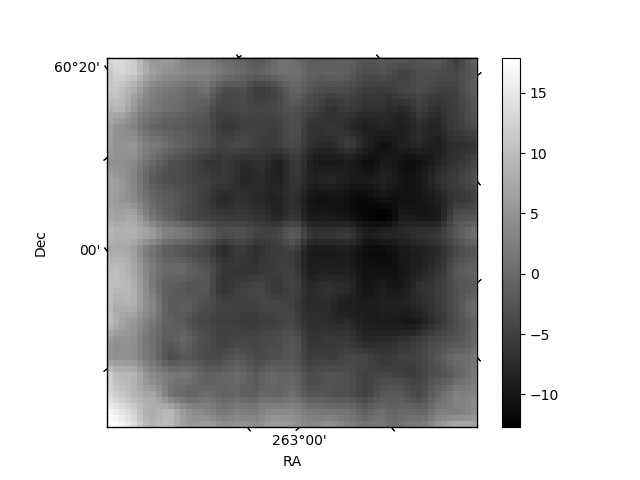
| Quadrant D | 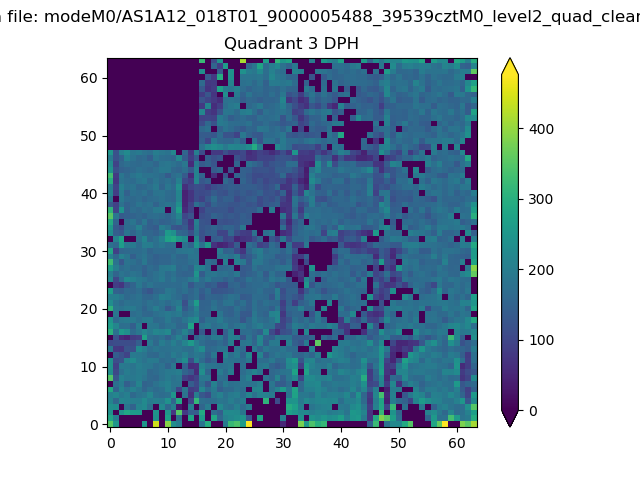 |
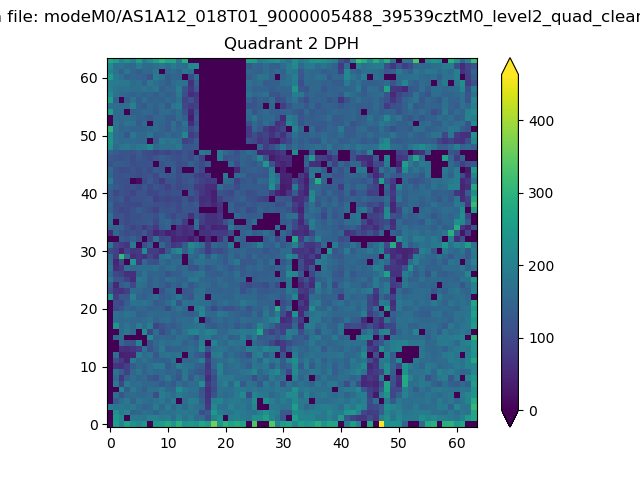 |
Quadrant C |
| Plot type | Count rate plots | Images |
|---|---|---|
| Comparison with Poisson distribution Blue bars denote a histogram of data divided into 1 sec bins. Red curve is a Poisson curve with rate = median count rate of data. |
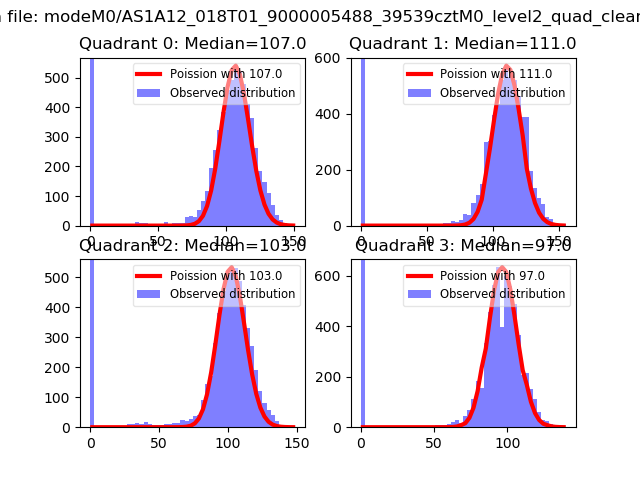 |
 |
| Quadrant-wise count rates Data is divided into 100 sec bins |
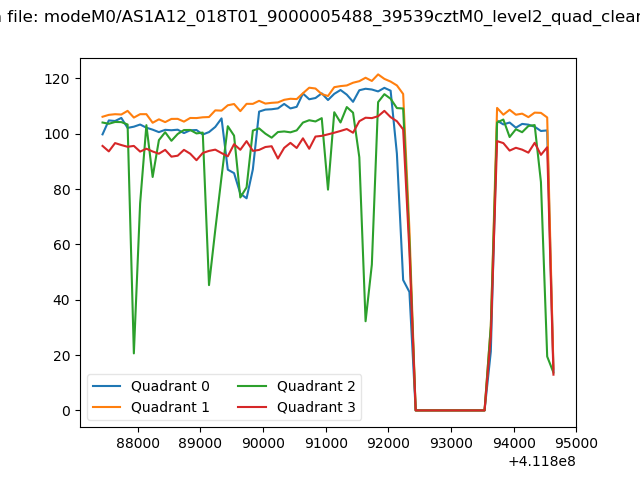 |
|
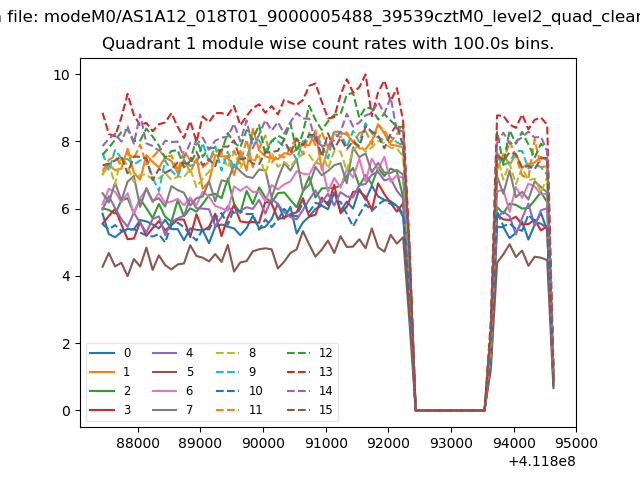
| Module-wise count rates for Quadrant A Data is divided into 100 sec bins |
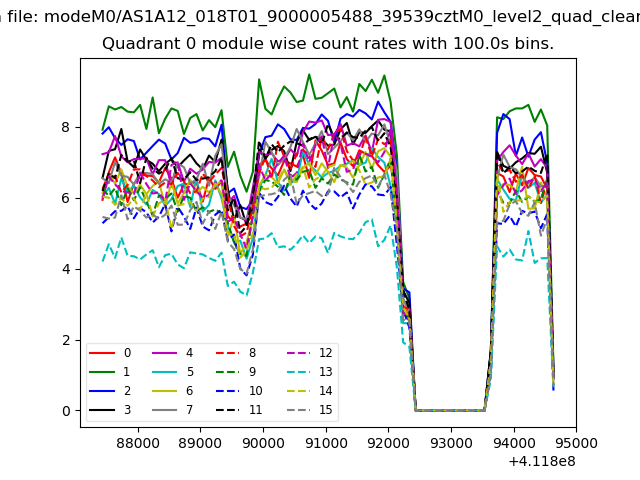 |
 |
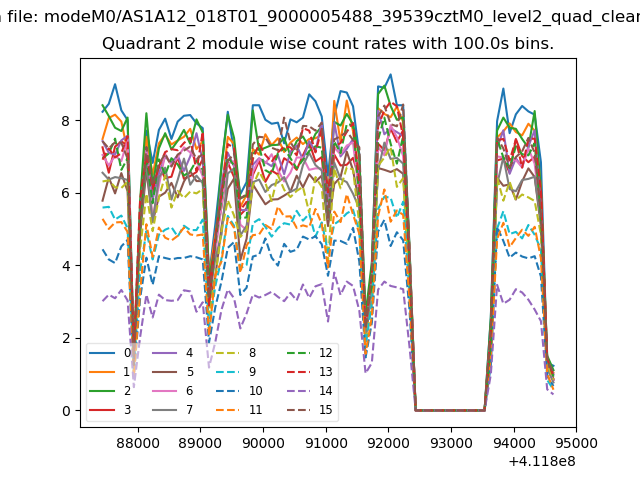
| Module-wise count rates for Quadrant B Data is divided into 100 sec bins |
 |
 |
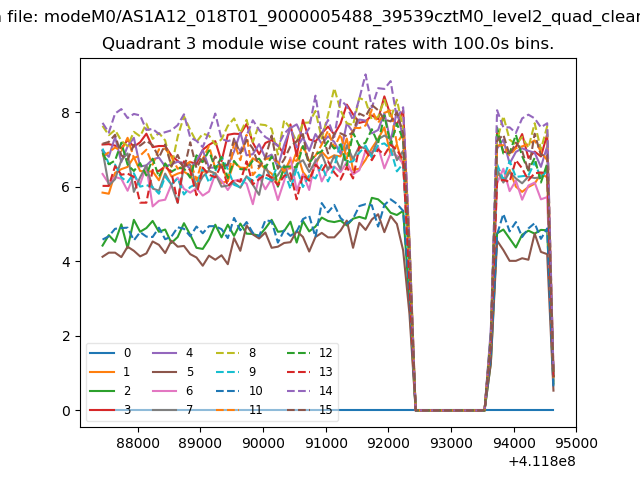
| Module-wise count rates for Quadrant C Data is divided into 100 sec bins |
 |
 |
| Module-wise count rates for Quadrant D Data is divided into 100 sec bins |
 |
 |
| Parameter | Plot |
|---|---|
| CZT HV Monitor | 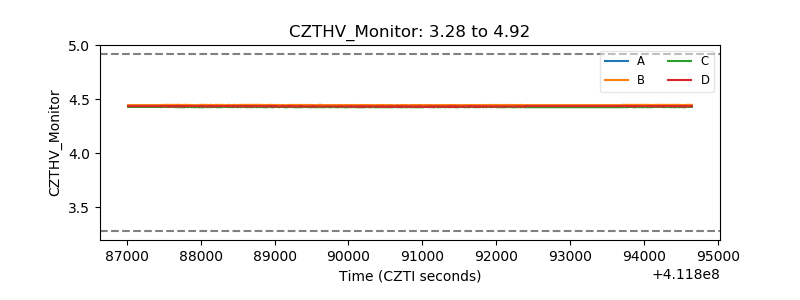 |
| D_VDD | 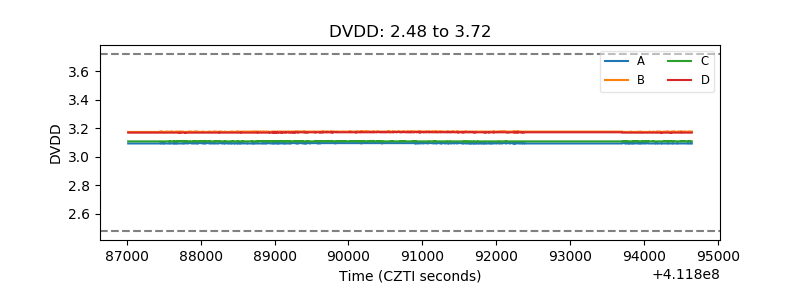 |
| Temperature 1 | 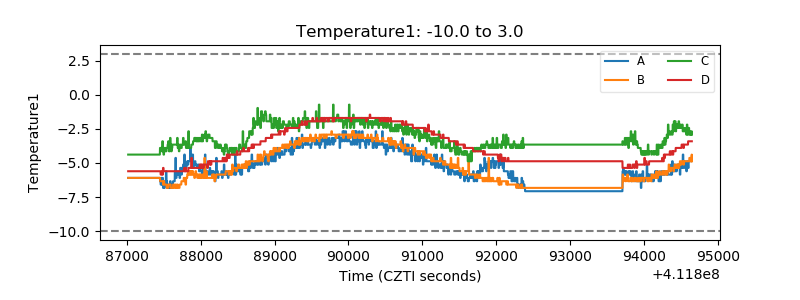 |
| Veto HV Monitor | 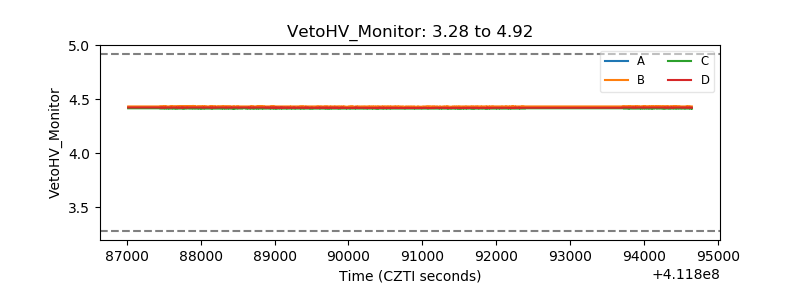 |
| Veto LLD | 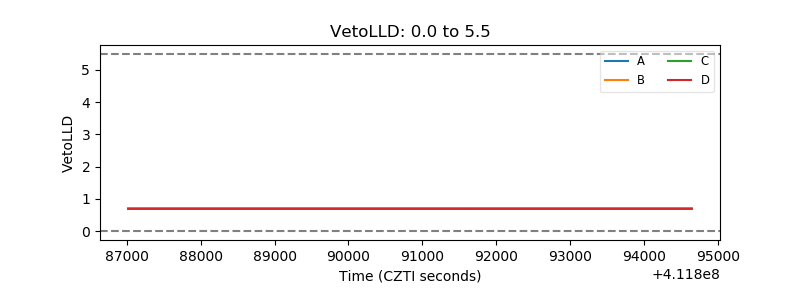 |
| Alpha Counter | 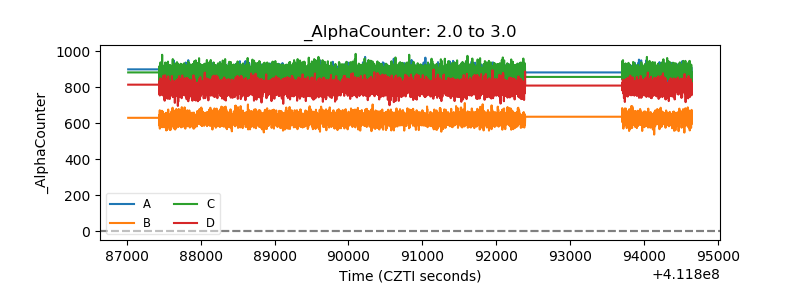 |
| _CPM_Rate | 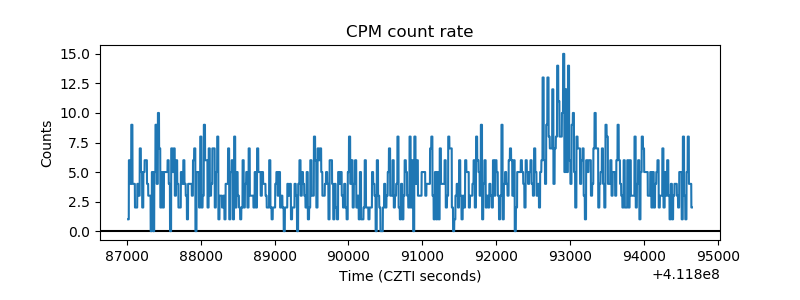 |
| CZT Counter | 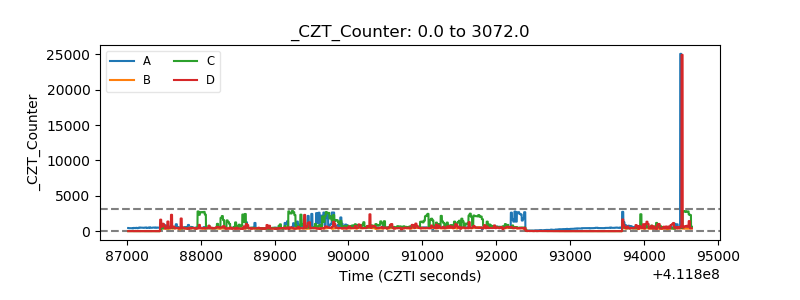 |
| +2.5 Volts monitor |  |
| +5 Volts monitor | 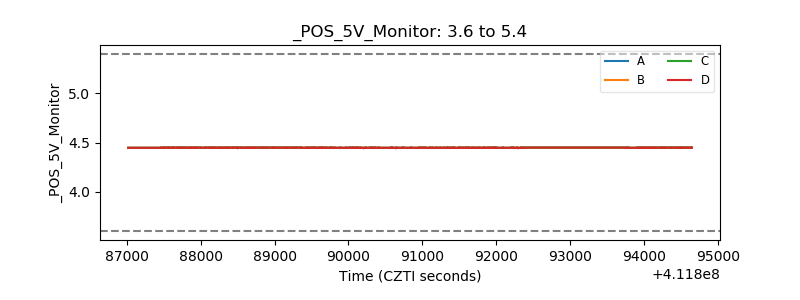 |
| _ROLL_ROT | 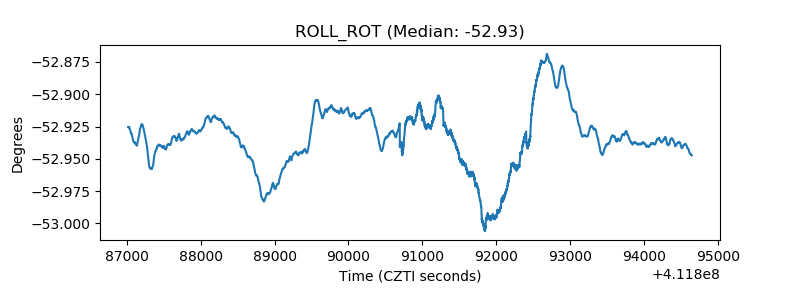 |
| _Roll_DEC | 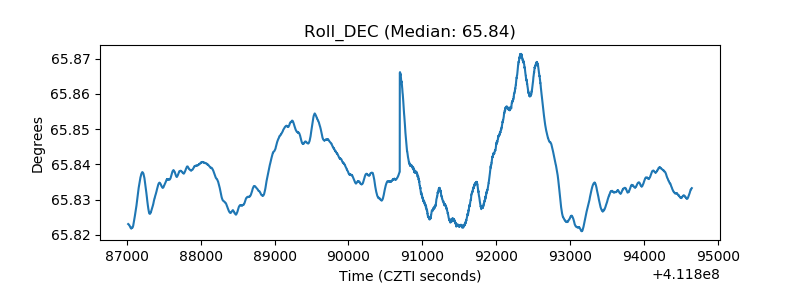 |
| _Roll_RA | 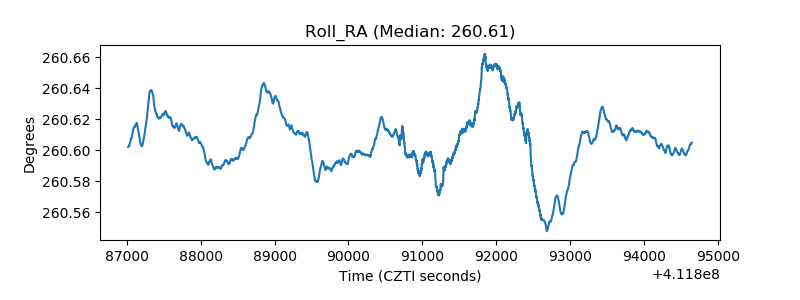 |
| Veto Counter |  |