| Param | Original file | Final file |
|---|---|---|
| Filename | modeM0/AS1A12_018T01_9000005488_39542cztM0_level2.fits | modeM0/AS1A12_018T01_9000005488_39542cztM0_level2_quad_clean.evt |
| Size (bytes) | 1,136,165,760 | 242,251,200 |
| Size | 1.1 GB | 231.0 MB |
| Events in quadrant A | 8,870,631 | 1,674,620 |
| Events in quadrant B | 6,986,109 | 1,699,634 |
| Events in quadrant C | 11,886,865 | 1,553,573 |
| Events in quadrant D | 13,106,053 | 1,330,146 |
| Mode SS | |||
|---|---|---|---|
| Quadrant | BADHDUFLAG | Total packets | Discarded packets |
| A | 0 | 318 | 0 |
| B | 0 | 318 | 0 |
| C | 0 | 318 | 0 |
| D | 0 | 318 | 0 |
| Mode M0 | |||
|---|---|---|---|
| Quadrant | BADHDUFLAG | Total packets | Discarded packets |
| A | 0 | 36052 | 5 |
| B | 0 | 32405 | 4 |
| C | 0 | 45377 | 4 |
| D | 0 | 49941 | 4 |
| Mode M9 | |||
|---|---|---|---|
| Quadrant | BADHDUFLAG | Total packets | Discarded packets |
| A | 0 | 43 | 0 |
| B | 0 | 43 | 0 |
| C | 0 | 43 | 0 |
| D | 0 | 43 | 0 |
| Quadrant | Total seconds | Saturated seconds | Saturation percentage |
|---|---|---|---|
| A | 15602 | 47 | 0.301243% |
| B | 15602 | 211 | 1.352391% |
| C | 15602 | 870 | 5.576208% |
| D | 15602 | 1876 | 12.024099% |
Noise dominated data is calculated using 1-second bins in cleaned event files. If a bin has >2000 counts, and if more than 50% of those come from <1% of pixels, then it is considered to be noise-dominated and hence unusable.
| Quadrant | # 1 sec bins | Bins with >0 counts | Bins with >2000 counts | High rate bins dominated by noise | Noise dominated (total time) | Noise dominated (detector-on time) | Marked lightcurve |
|---|---|---|---|---|---|---|---|
| A | 19840 | 15605 | 33 | 33 | 0.17% | 0.21% | 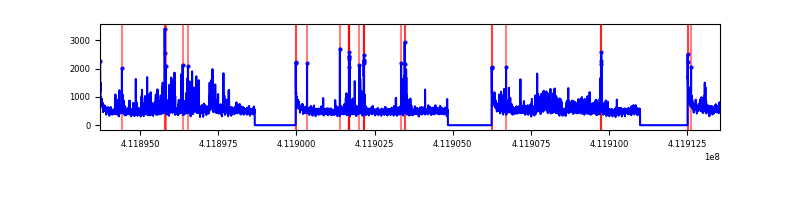 |
| B | 19840 | 15605 | 86 | 86 | 0.43% | 0.55% | 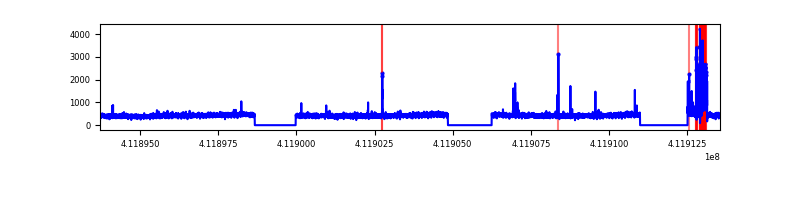 |
| C | 19840 | 15605 | 840 | 840 | 4.23% | 5.38% | 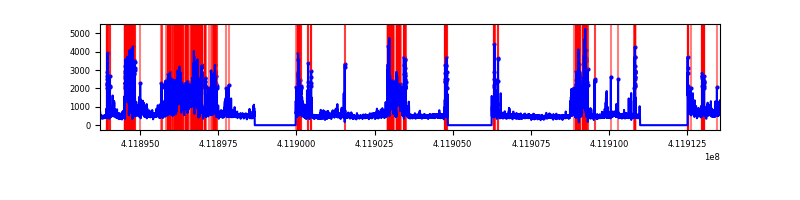 |
| D | 19840 | 15605 | 1421 | 1421 | 7.16% | 9.11% | 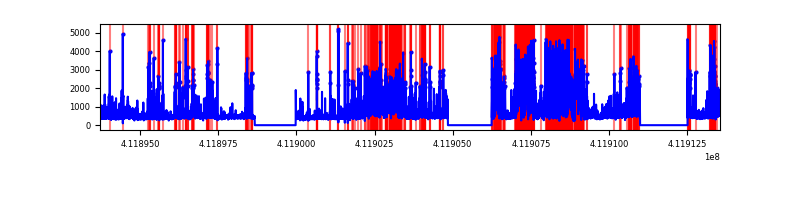 |
Top three noisy pixels from each quadrant. If the there are fewer than three noisy pixels in the level2.evt file, extra rows are filled as -1
| Pixel properties | Quadrant properties | ||||||
|---|---|---|---|---|---|---|---|
| Quadrant | DetID | PixID | Counts | Sigma | Mean | Median | Sigma |
| A | 10 | 83 | 1109828 | 3261.14 | 1676 | 1641 | 339.8 |
| A | 15 | 222 | 719918 | 2113.72 | 1676 | 1641 | 339.8 |
| A | 6 | 10 | 439046 | 1287.18 | 1676 | 1641 | 339.8 |
| B | 5 | 255 | 461477 | 1454.84 | 1648 | 1599 | 316.1 |
| B | 12 | 111 | 40345 | 122.57 | 1648 | 1599 | 316.1 |
| B | 11 | 111 | 37288 | 112.9 | 1648 | 1599 | 316.1 |
| C | 9 | 187 | 4225488 | 11354.98 | 1604 | 1612 | 372.0 |
| C | 15 | 208 | 717584 | 1924.74 | 1604 | 1612 | 372.0 |
| C | 15 | 214 | 638240 | 1711.44 | 1604 | 1612 | 372.0 |
| D | 12 | 0 | 3081072 | 8224.27 | 1531 | 1487 | 374.5 |
| D | 12 | 227 | 1605382 | 4283.33 | 1531 | 1487 | 374.5 |
| D | 13 | 174 | 1272596 | 3394.59 | 1531 | 1487 | 374.5 |
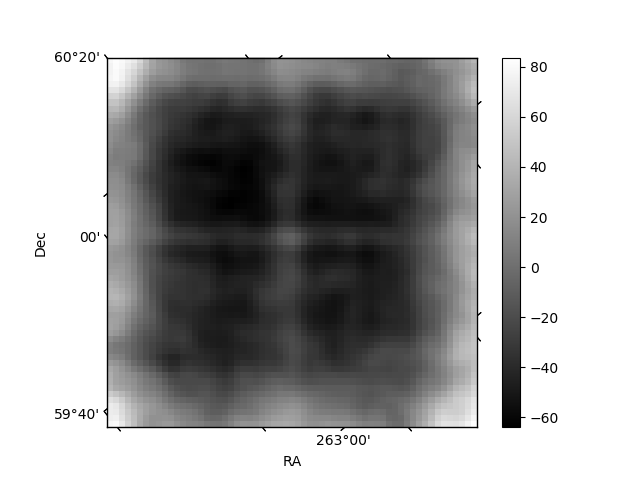
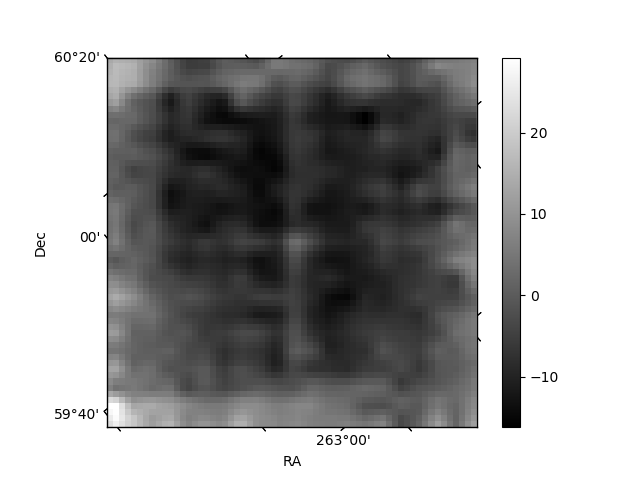
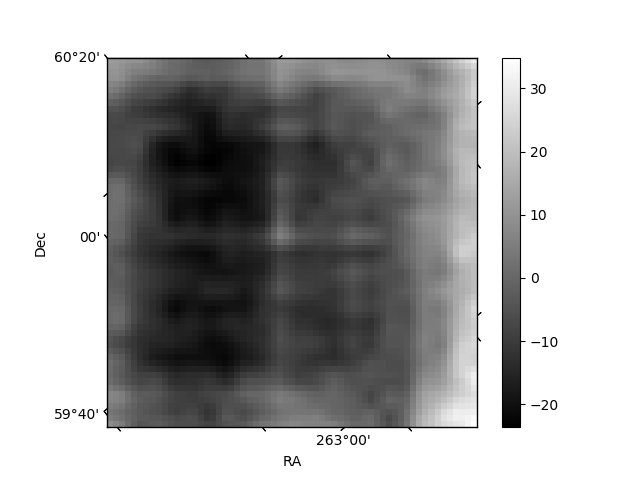
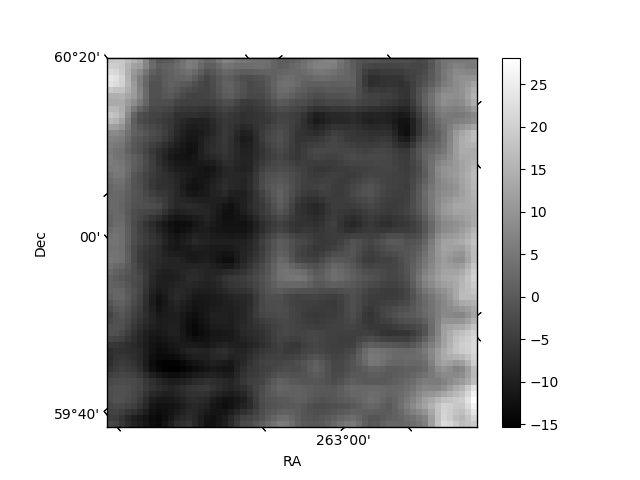
Histogram calculated using DETX and DETY for each event in the final _common_clean file
| Quadrant A | 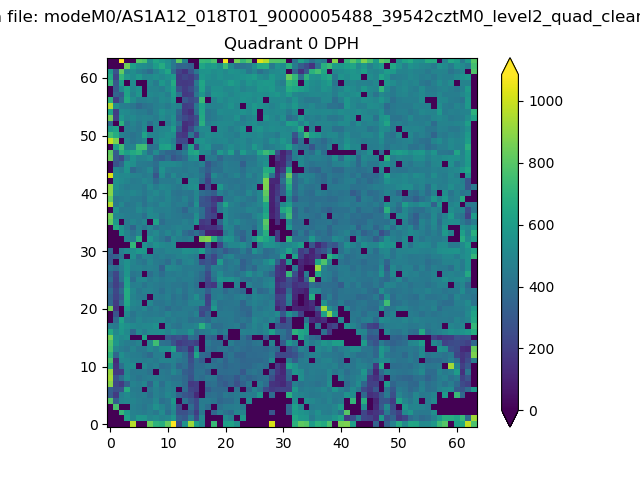 |
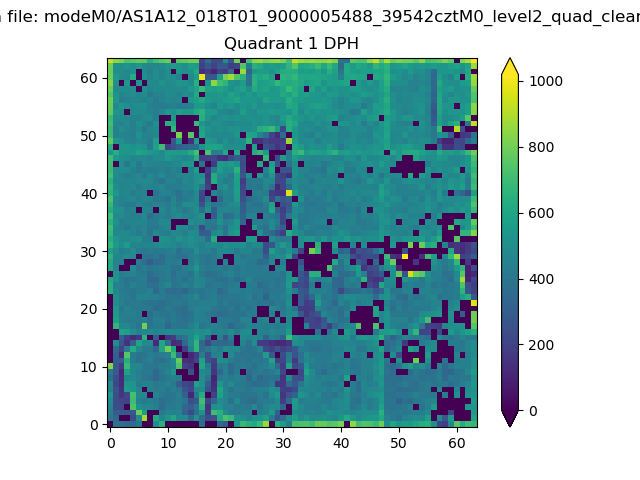 |
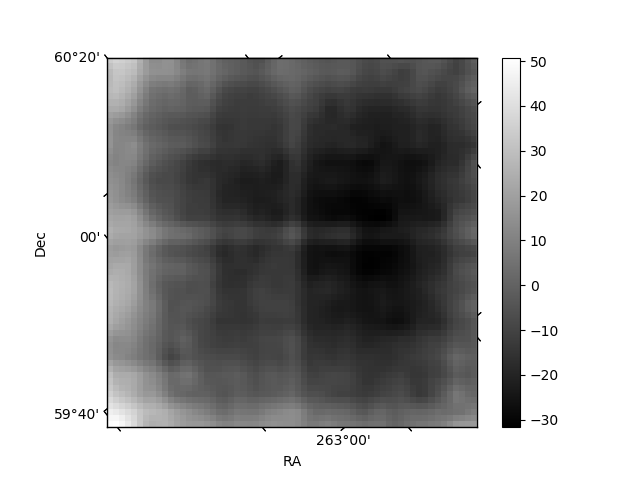
Quadrant B |
|---|---|---|---|
| Quadrant D | 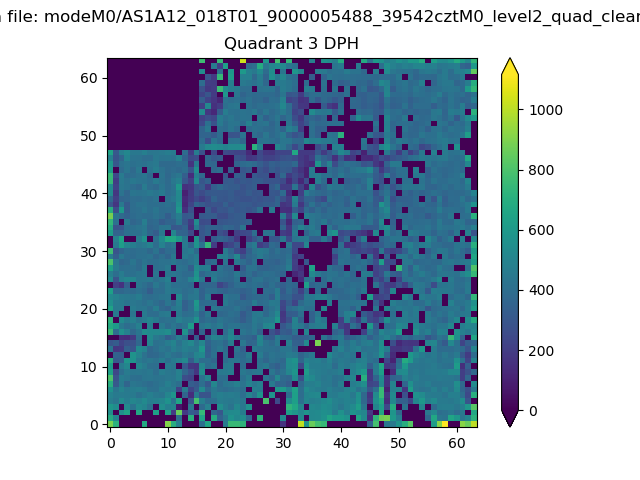 |
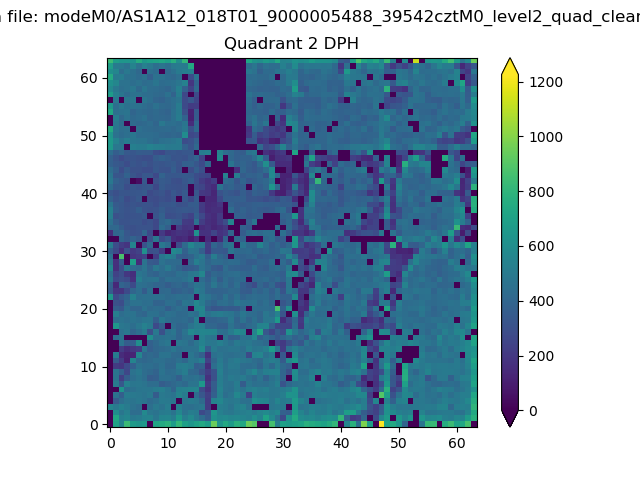 |
Quadrant C |
| Plot type | Count rate plots | Images |
|---|---|---|
| Comparison with Poisson distribution Blue bars denote a histogram of data divided into 1 sec bins. Red curve is a Poisson curve with rate = median count rate of data. |
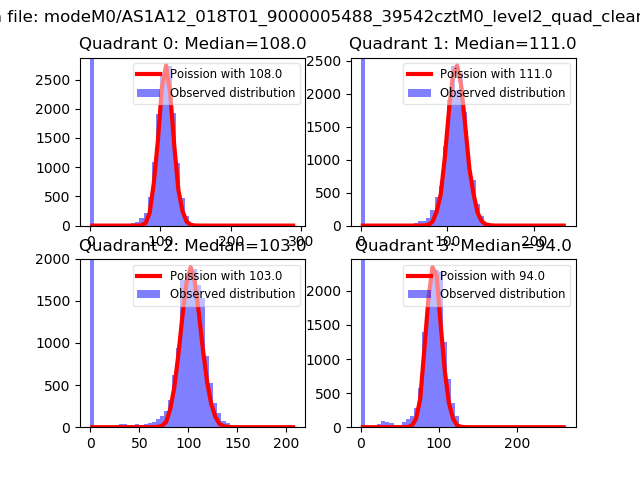 |
 |
| Quadrant-wise count rates Data is divided into 100 sec bins |
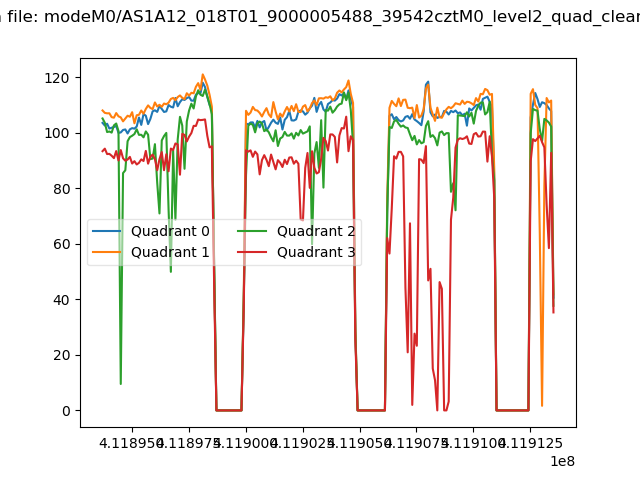 |
|
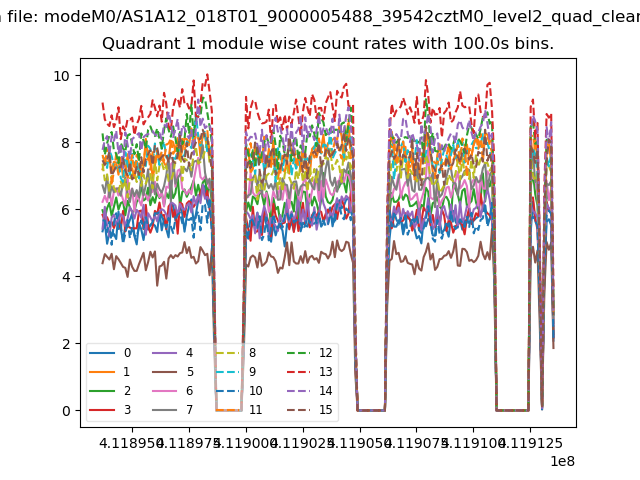
| Module-wise count rates for Quadrant A Data is divided into 100 sec bins |
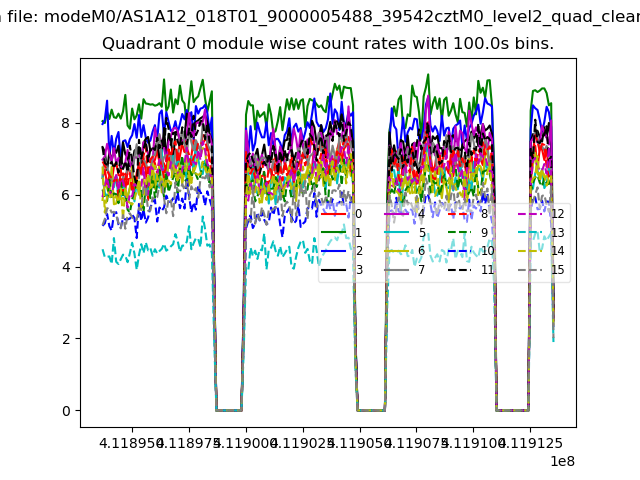 |
 |
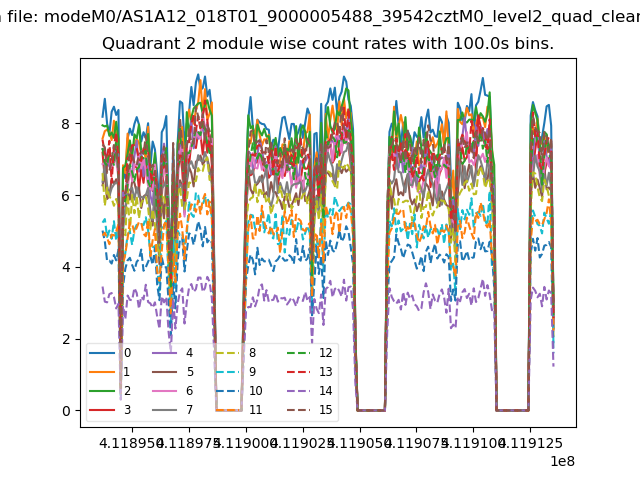
| Module-wise count rates for Quadrant B Data is divided into 100 sec bins |
 |
 |
| Module-wise count rates for Quadrant C Data is divided into 100 sec bins |
 |
 |
| Module-wise count rates for Quadrant D Data is divided into 100 sec bins |
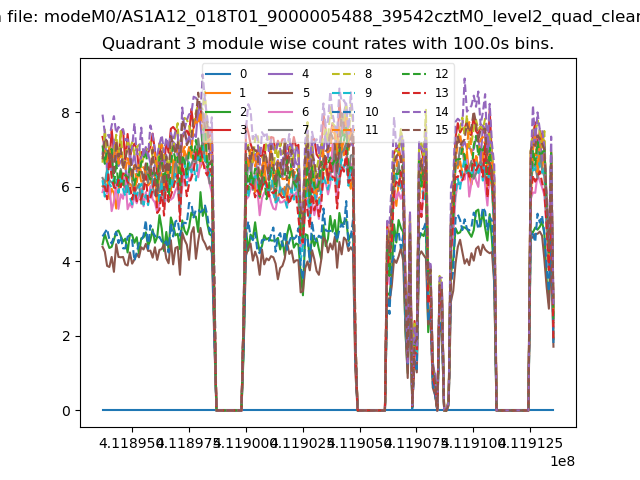 |
 |
| Parameter | Plot |
|---|---|
| CZT HV Monitor | 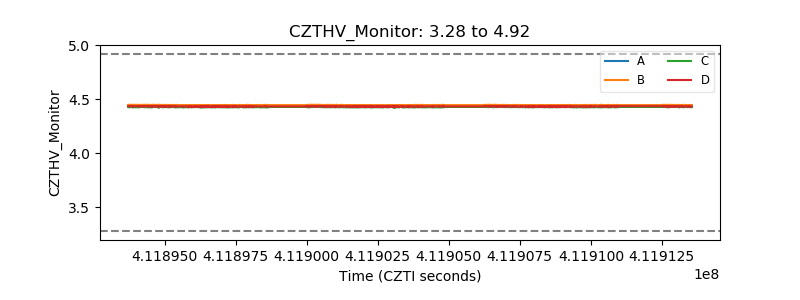 |
| D_VDD | 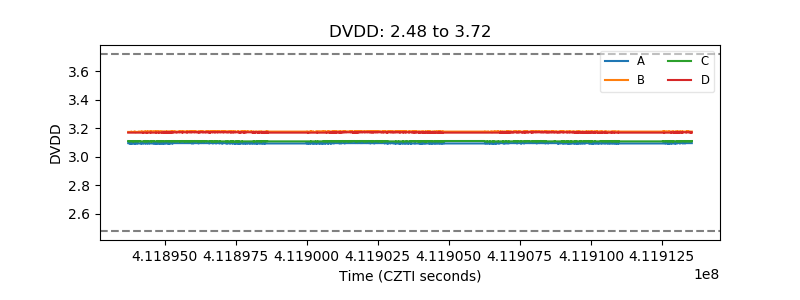 |
| Temperature 1 | 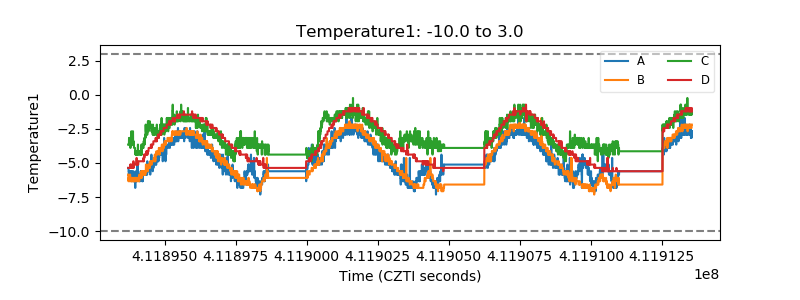 |
| Veto HV Monitor | 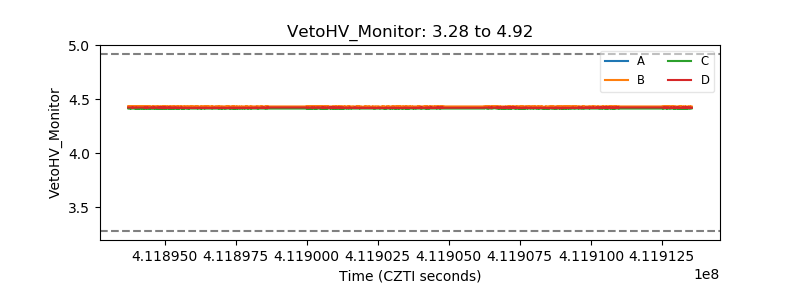 |
| Veto LLD | 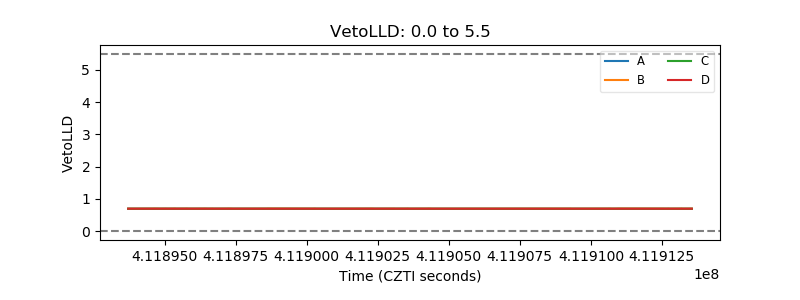 |
| Alpha Counter | 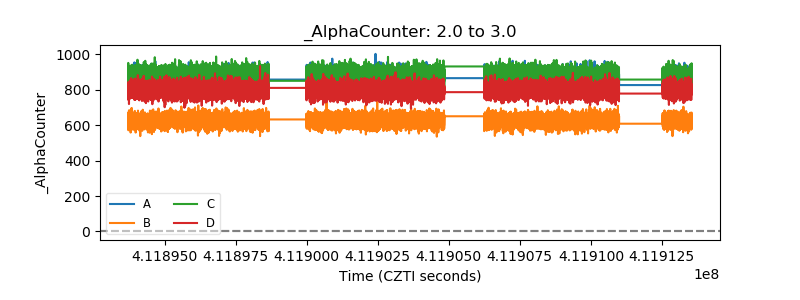 |
| _CPM_Rate | 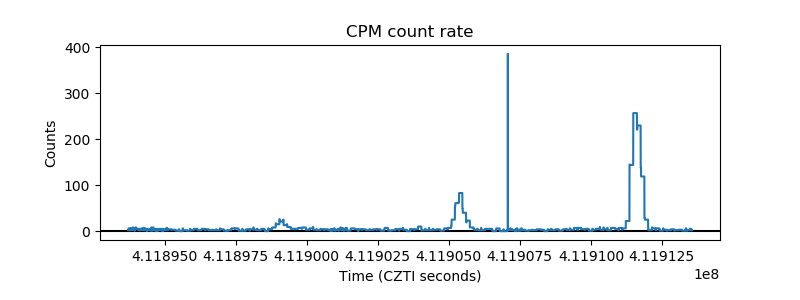 |
| CZT Counter | 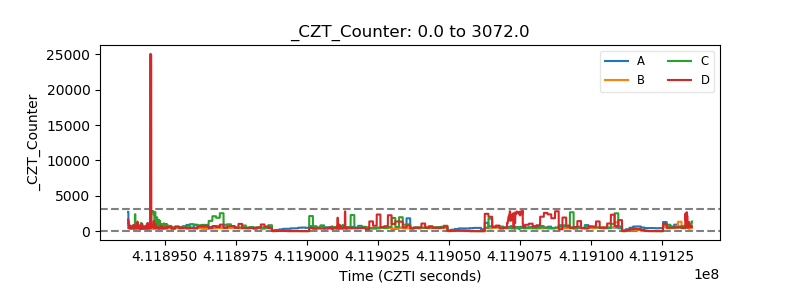 |
| +2.5 Volts monitor | 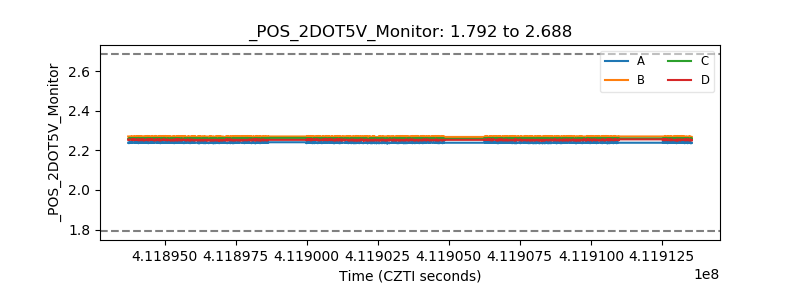 |
| +5 Volts monitor | 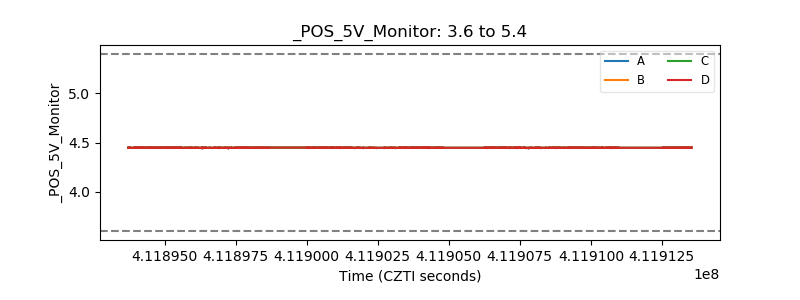 |
| _ROLL_ROT | 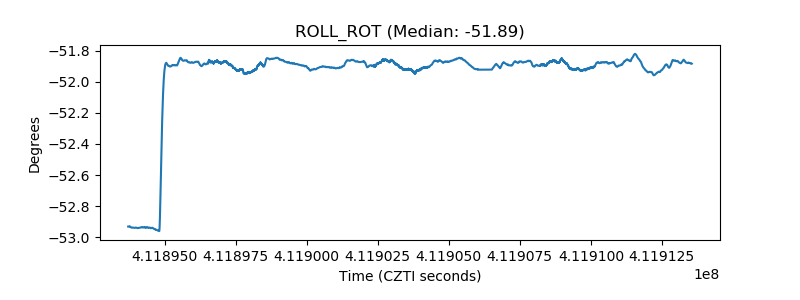 |
| _Roll_DEC | 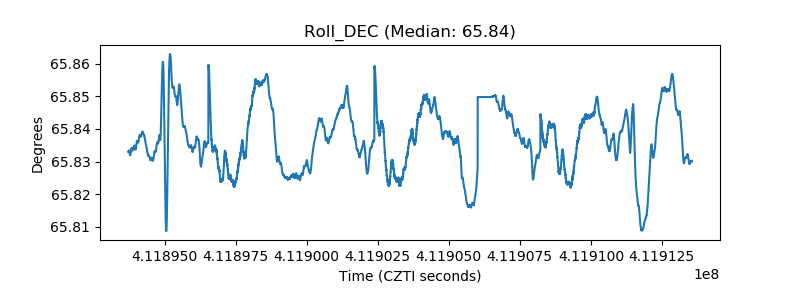 |
| _Roll_RA | 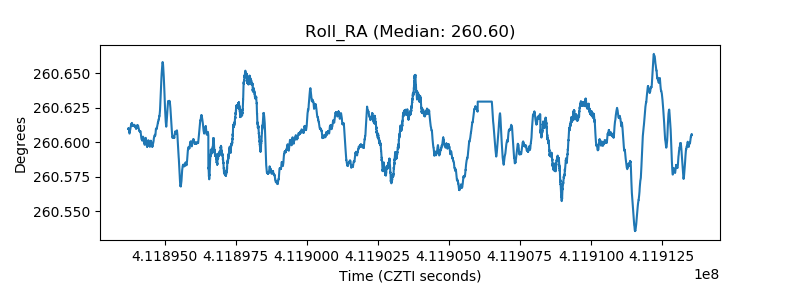 |
| Veto Counter | 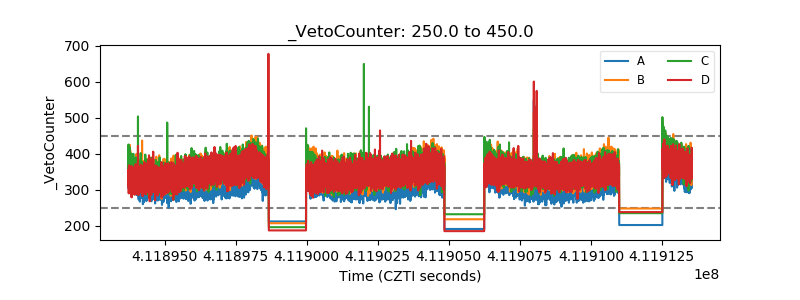 |