| Param | Original file | Final file |
|---|---|---|
| Filename | modeM0/AS1A12_018T01_9000005488_39543cztM0_level2.fits | modeM0/AS1A12_018T01_9000005488_39543cztM0_level2_quad_clean.evt |
| Size (bytes) | 401,382,720 | 84,634,560 |
| Size | 382.8 MB | 80.7 MB |
| Events in quadrant A | 3,109,124 | 590,310 |
| Events in quadrant B | 2,592,943 | 580,873 |
| Events in quadrant C | 4,004,692 | 554,471 |
| Events in quadrant D | 4,738,799 | 466,001 |
| Mode SS | |||
|---|---|---|---|
| Quadrant | BADHDUFLAG | Total packets | Discarded packets |
| A | 0 | 108 | 0 |
| B | 0 | 108 | 0 |
| C | 0 | 108 | 0 |
| D | 0 | 108 | 0 |
| Mode M0 | |||
|---|---|---|---|
| Quadrant | BADHDUFLAG | Total packets | Discarded packets |
| A | 0 | 12669 | 2 |
| B | 0 | 11529 | 1 |
| C | 0 | 15353 | 1 |
| D | 0 | 17716 | 1 |
| Mode M9 | |||
|---|---|---|---|
| Quadrant | BADHDUFLAG | Total packets | Discarded packets |
| A | 0 | 16 | 0 |
| B | 0 | 16 | 0 |
| C | 0 | 16 | 0 |
| D | 0 | 16 | 0 |
| Quadrant | Total seconds | Saturated seconds | Saturation percentage |
|---|---|---|---|
| A | 5298 | 18 | 0.339751% |
| B | 5298 | 194 | 3.661759% |
| C | 5298 | 166 | 3.133258% |
| D | 5298 | 741 | 13.986410% |
Noise dominated data is calculated using 1-second bins in cleaned event files. If a bin has >2000 counts, and if more than 50% of those come from <1% of pixels, then it is considered to be noise-dominated and hence unusable.
| Quadrant | # 1 sec bins | Bins with >0 counts | Bins with >2000 counts | High rate bins dominated by noise | Noise dominated (total time) | Noise dominated (detector-on time) | Marked lightcurve |
|---|---|---|---|---|---|---|---|
| A | 6941 | 5299 | 7 | 7 | 0.10% | 0.13% | 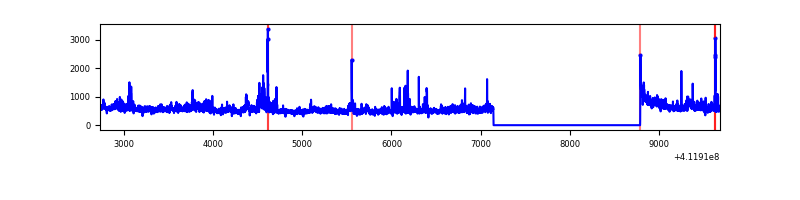 |
| B | 6941 | 5299 | 82 | 82 | 1.18% | 1.55% | 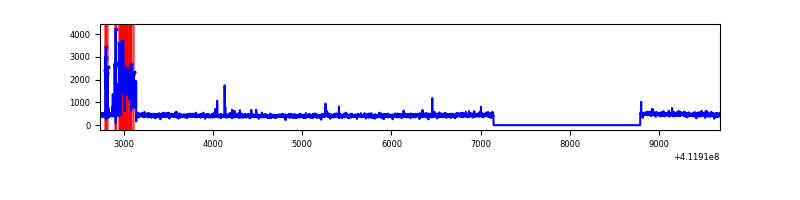 |
| C | 6941 | 5299 | 174 | 174 | 2.51% | 3.28% | 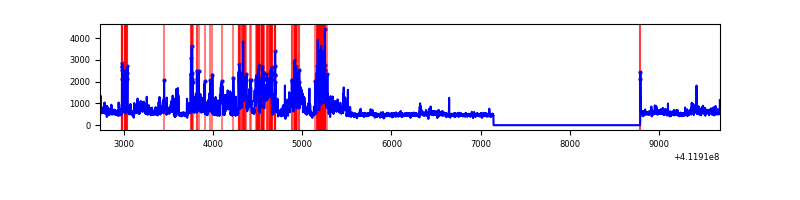 |
| D | 6941 | 5299 | 611 | 611 | 8.80% | 11.53% | 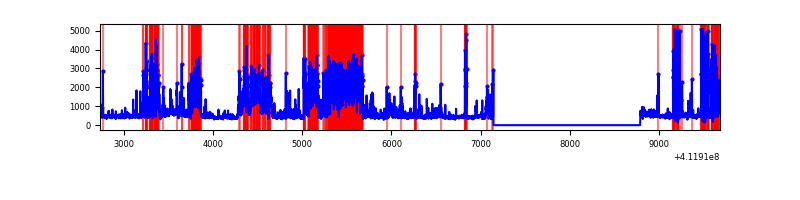 |
Top three noisy pixels from each quadrant. If the there are fewer than three noisy pixels in the level2.evt file, extra rows are filled as -1
| Pixel properties | Quadrant properties | ||||||
|---|---|---|---|---|---|---|---|
| Quadrant | DetID | PixID | Counts | Sigma | Mean | Median | Sigma |
| A | 15 | 222 | 434993 | 3718.25 | 574 | 562 | 116.8 |
| A | 10 | 83 | 379545 | 3243.68 | 574 | 562 | 116.8 |
| A | 2 | 79 | 45055 | 380.81 | 574 | 562 | 116.8 |
| B | 5 | 255 | 376066 | 3483.58 | 552 | 535 | 107.8 |
| B | 0 | 230 | 16720 | 150.14 | 552 | 535 | 107.8 |
| B | 0 | 213 | 15113 | 135.23 | 552 | 535 | 107.8 |
| C | 9 | 187 | 1413667 | 10854.17 | 556 | 559 | 130.2 |
| C | 15 | 214 | 218050 | 1670.56 | 556 | 559 | 130.2 |
| C | 15 | 208 | 182678 | 1398.87 | 556 | 559 | 130.2 |
| D | 12 | 0 | 1484517 | 11503.07 | 527 | 511 | 129.0 |
| D | 12 | 227 | 602219 | 4664.06 | 527 | 511 | 129.0 |
| D | 2 | 249 | 212300 | 1641.65 | 527 | 511 | 129.0 |
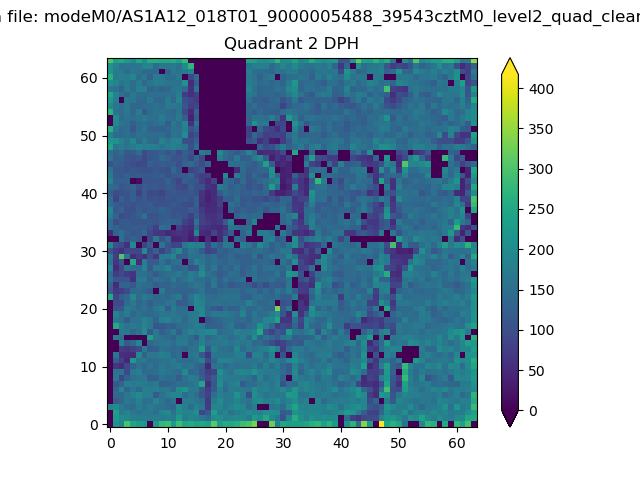
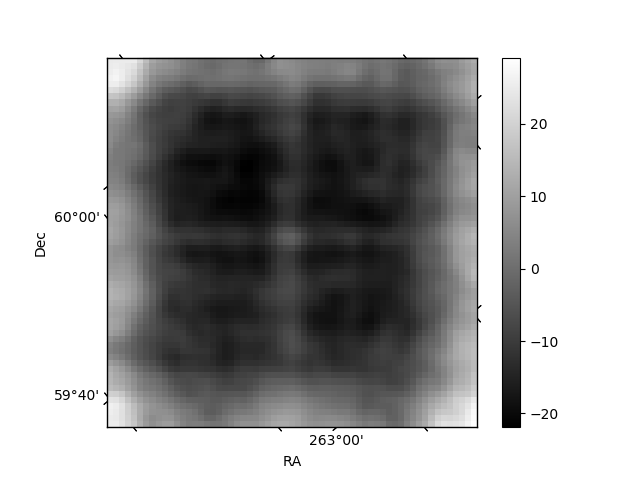
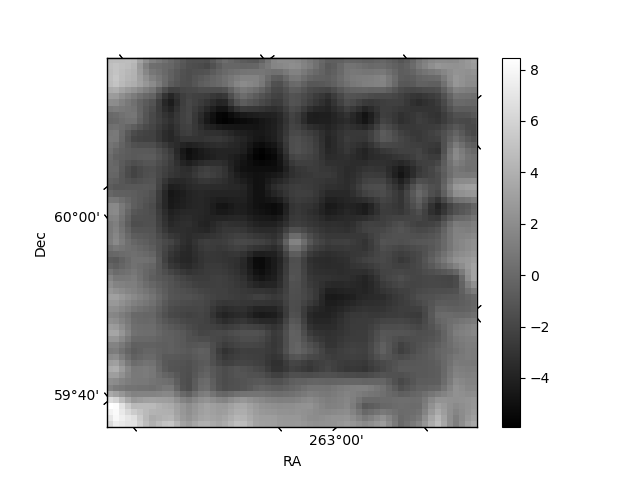
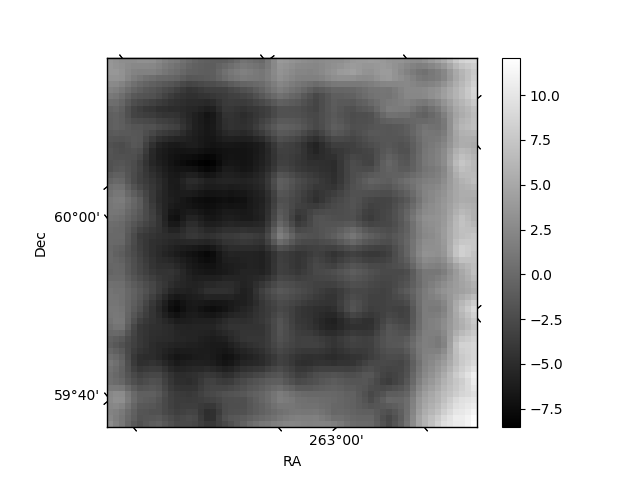
Histogram calculated using DETX and DETY for each event in the final _common_clean file
| Quadrant A | 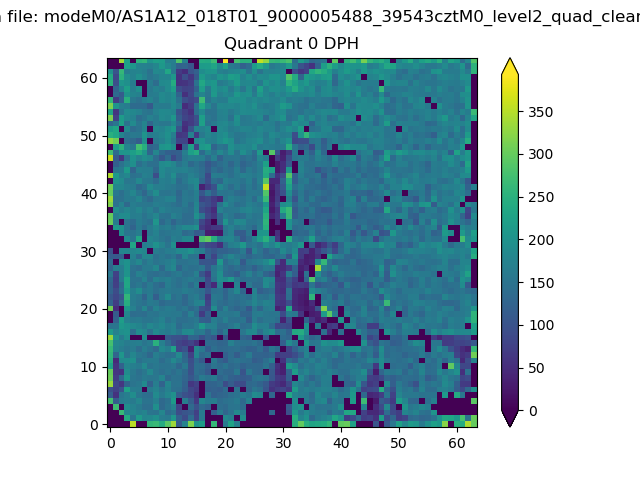 |
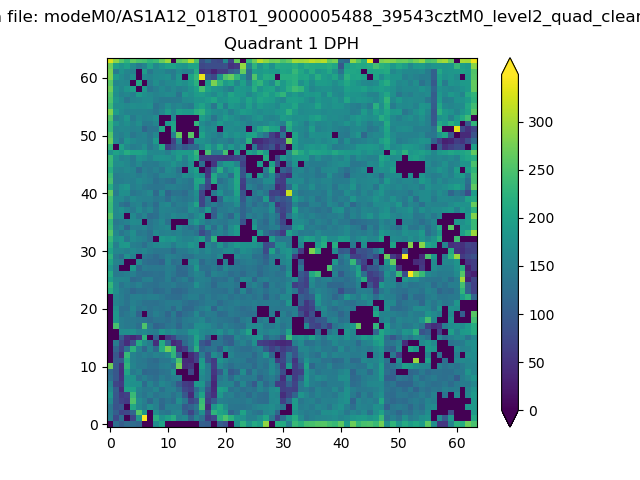 |
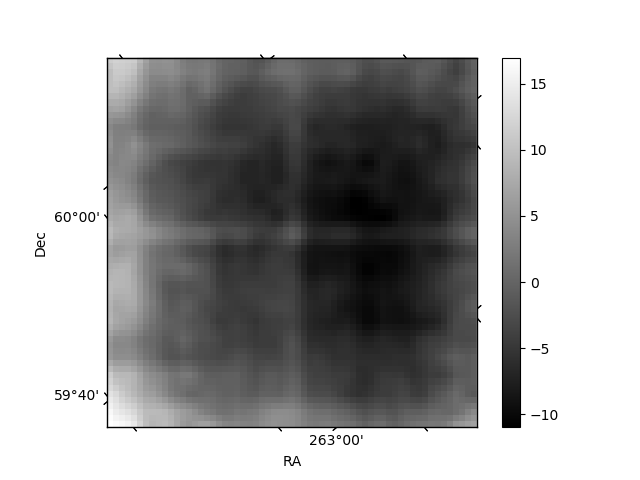
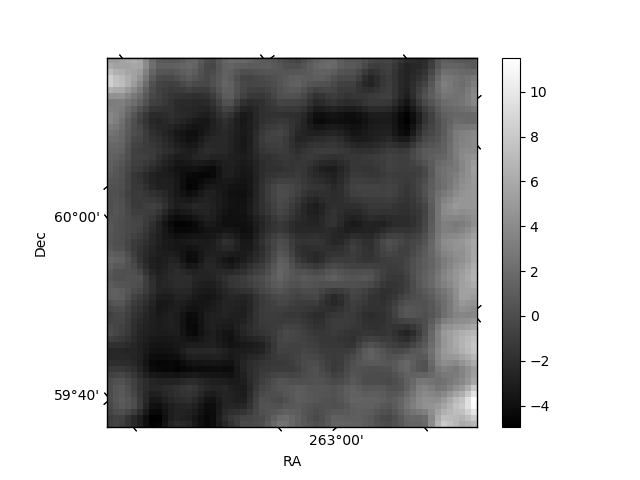
Quadrant B |
|---|---|---|---|
| Quadrant D | 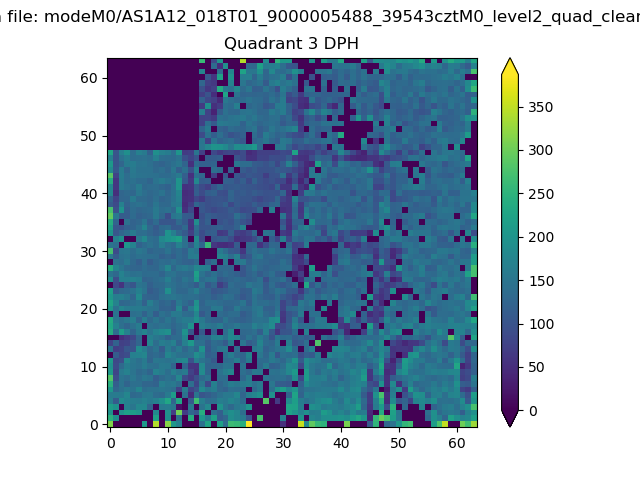 |
 |
Quadrant C |
| Plot type | Count rate plots | Images |
|---|---|---|
| Comparison with Poisson distribution Blue bars denote a histogram of data divided into 1 sec bins. Red curve is a Poisson curve with rate = median count rate of data. |
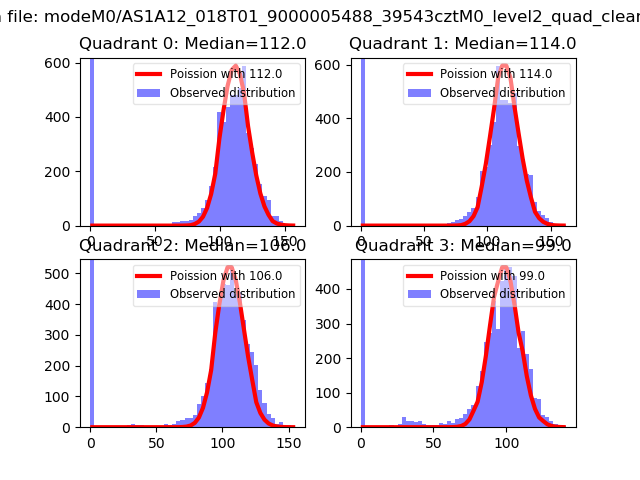 |
 |
| Quadrant-wise count rates Data is divided into 100 sec bins |
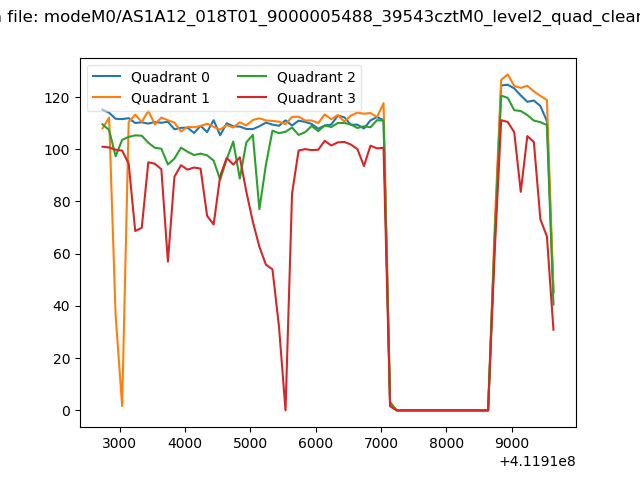 |
|
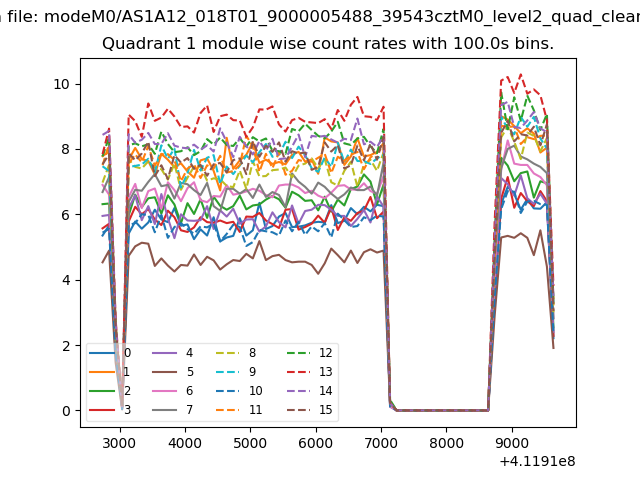
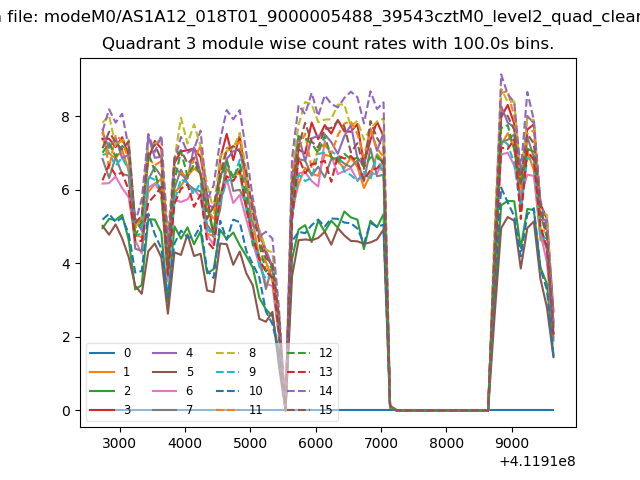
| Module-wise count rates for Quadrant A Data is divided into 100 sec bins |
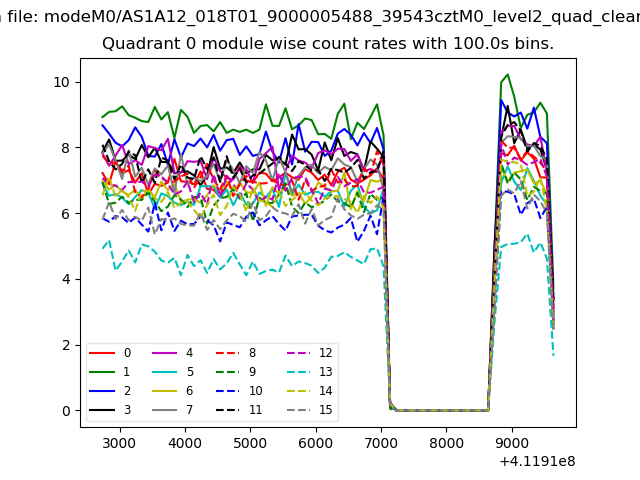 |
 |
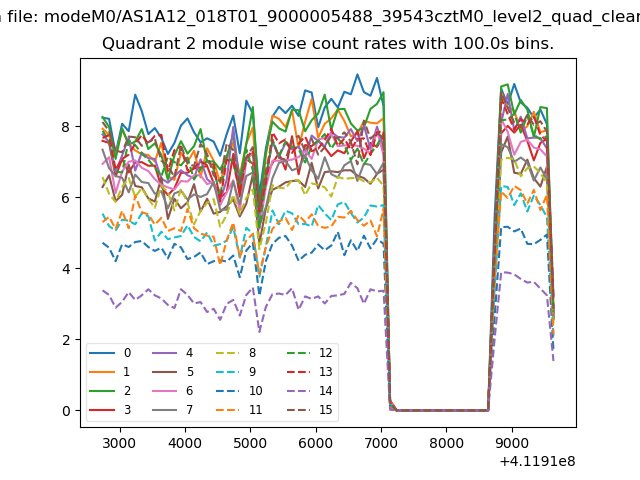
| Module-wise count rates for Quadrant B Data is divided into 100 sec bins |
 |
 |
| Module-wise count rates for Quadrant C Data is divided into 100 sec bins |
 |
 |
| Module-wise count rates for Quadrant D Data is divided into 100 sec bins |
 |
 |
| Parameter | Plot |
|---|---|
| CZT HV Monitor |  |
| D_VDD | 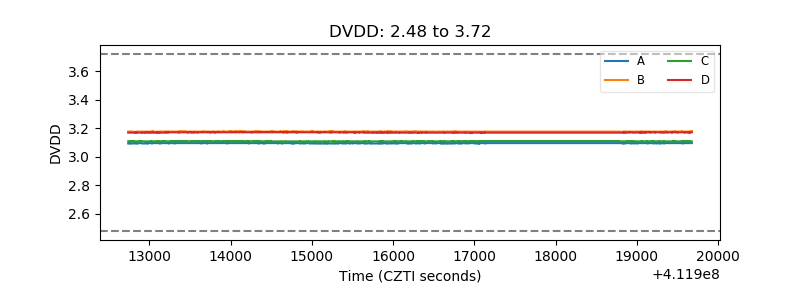 |
| Temperature 1 | 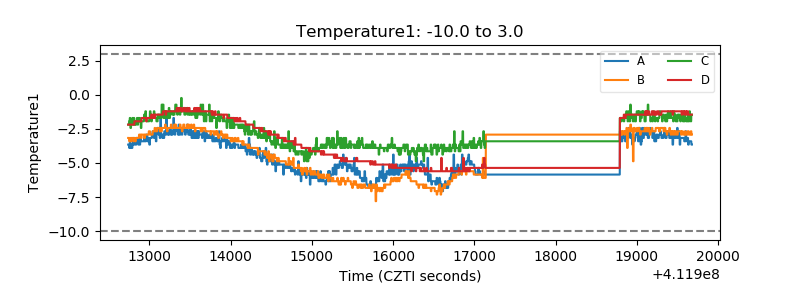 |
| Veto HV Monitor | 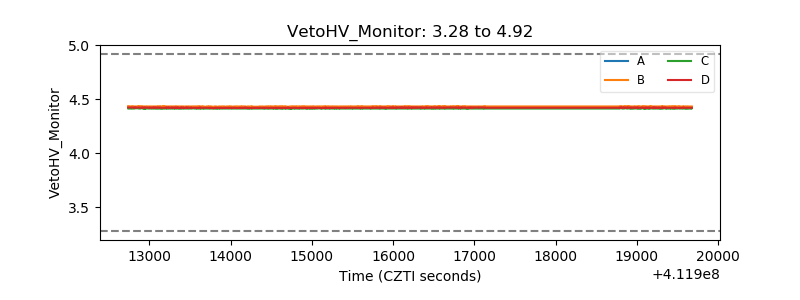 |
| Veto LLD | 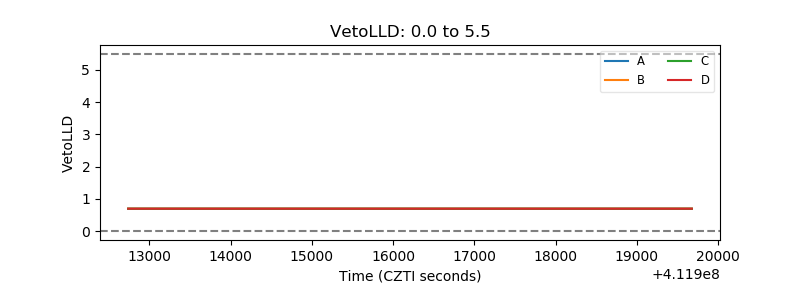 |
| Alpha Counter | 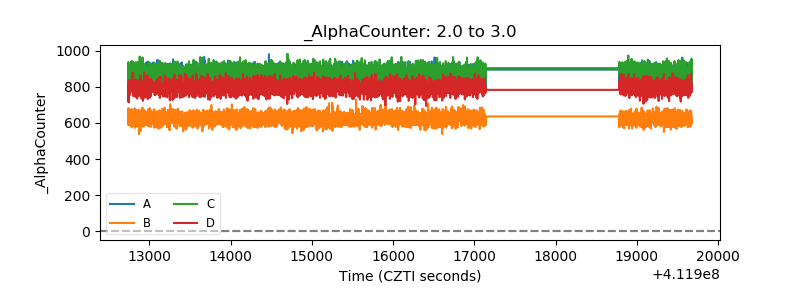 |
| _CPM_Rate | 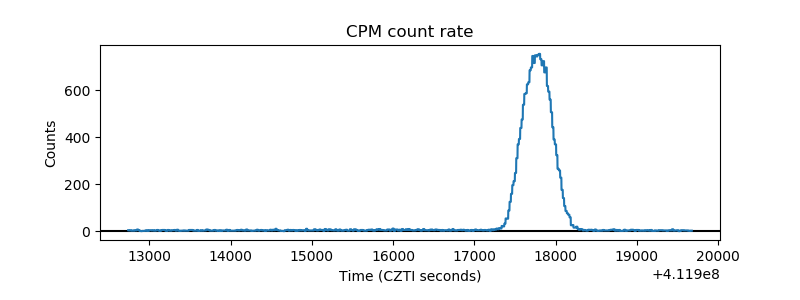 |
| CZT Counter | 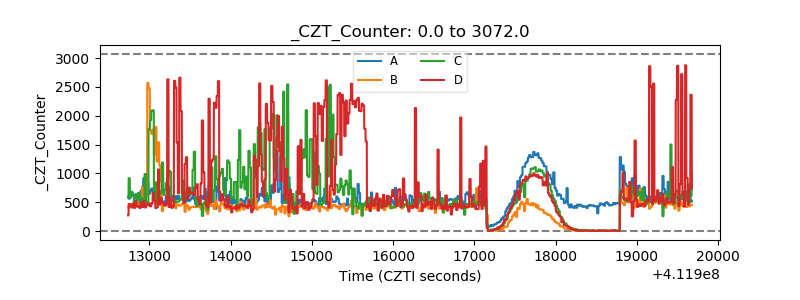 |
| +2.5 Volts monitor | 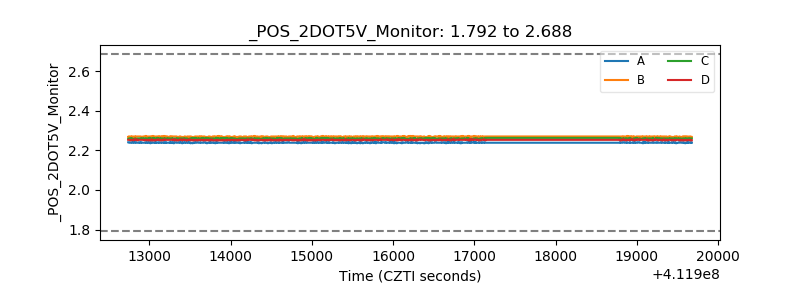 |
| +5 Volts monitor | 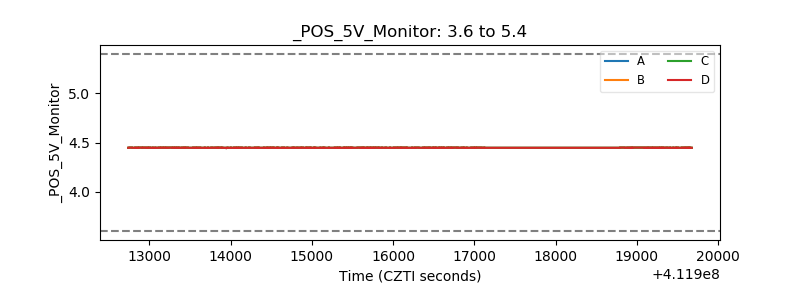 |
| _ROLL_ROT | 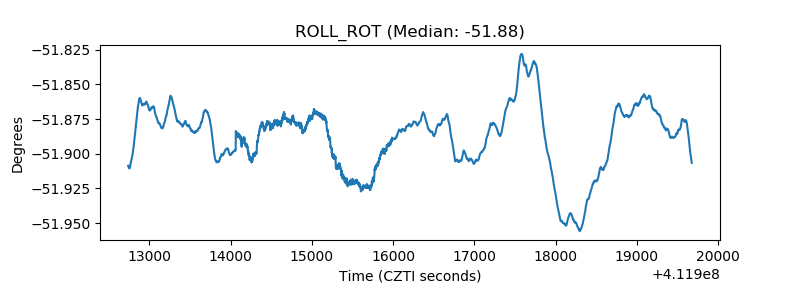 |
| _Roll_DEC | 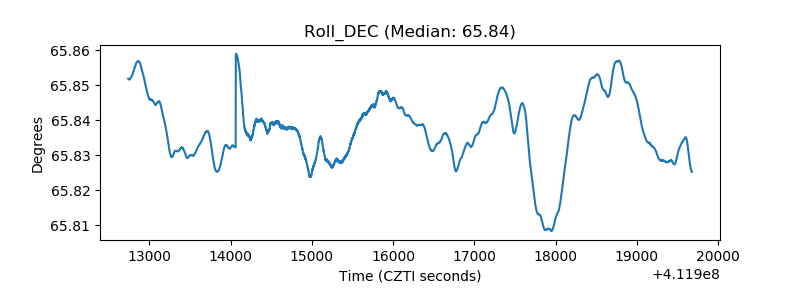 |
| _Roll_RA | 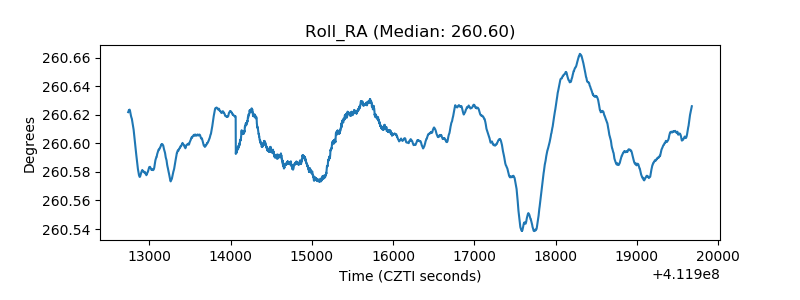 |
| Veto Counter | 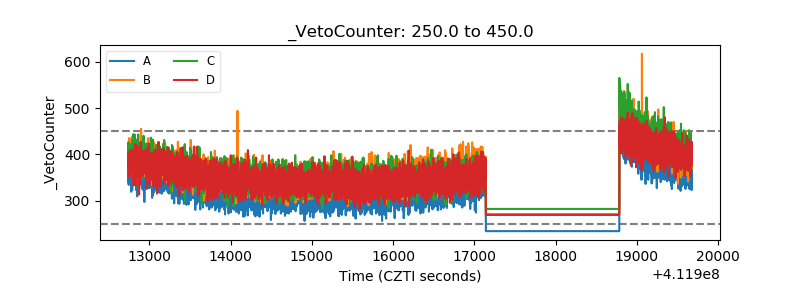 |