| Param | Original file | Final file |
|---|---|---|
| Filename | modeM0/AS1A12_018T01_9000005488_39545cztM0_level2.fits | modeM0/AS1A12_018T01_9000005488_39545cztM0_level2_quad_clean.evt |
| Size (bytes) | 398,252,160 | 93,372,480 |
| Size | 379.8 MB | 89.0 MB |
| Events in quadrant A | 3,189,084 | 642,555 |
| Events in quadrant B | 2,481,965 | 658,817 |
| Events in quadrant C | 4,280,139 | 603,345 |
| Events in quadrant D | 4,359,607 | 534,637 |
| Mode SS | |||
|---|---|---|---|
| Quadrant | BADHDUFLAG | Total packets | Discarded packets |
| A | 0 | 114 | 0 |
| B | 0 | 114 | 0 |
| C | 0 | 114 | 0 |
| D | 0 | 114 | 0 |
| Mode M0 | |||
|---|---|---|---|
| Quadrant | BADHDUFLAG | Total packets | Discarded packets |
| A | 0 | 13180 | 3 |
| B | 0 | 11254 | 2 |
| C | 0 | 16425 | 2 |
| D | 0 | 16779 | 2 |
| Mode M9 | |||
|---|---|---|---|
| Quadrant | BADHDUFLAG | Total packets | Discarded packets |
| A | 0 | 21 | 0 |
| B | 0 | 21 | 0 |
| C | 0 | 21 | 0 |
| D | 0 | 22 | 0 |
| Quadrant | Total seconds | Saturated seconds | Saturation percentage |
|---|---|---|---|
| A | 5543 | 32 | 0.577305% |
| B | 5543 | 4 | 0.072163% |
| C | 5543 | 233 | 4.203500% |
| D | 5543 | 516 | 9.309038% |
Noise dominated data is calculated using 1-second bins in cleaned event files. If a bin has >2000 counts, and if more than 50% of those come from <1% of pixels, then it is considered to be noise-dominated and hence unusable.
| Quadrant | # 1 sec bins | Bins with >0 counts | Bins with >2000 counts | High rate bins dominated by noise | Noise dominated (total time) | Noise dominated (detector-on time) | Marked lightcurve |
|---|---|---|---|---|---|---|---|
| A | 7334 | 5544 | 18 | 18 | 0.25% | 0.32% | 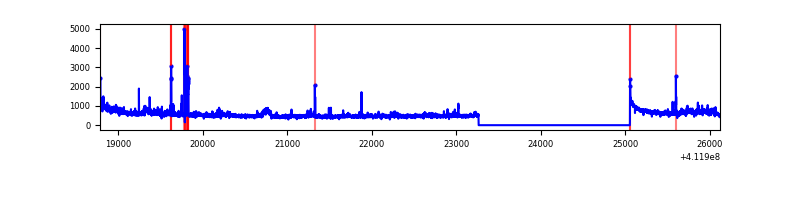 |
| B | 7334 | 5544 | 0 | 0 | 0.00% | 0.00% | 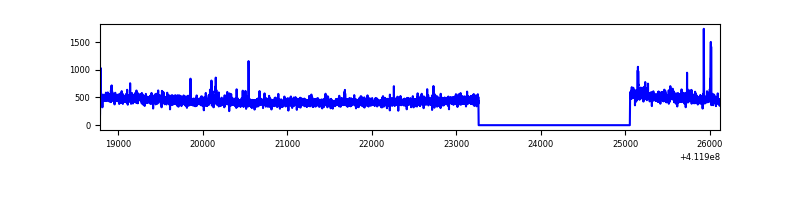 |
| C | 7334 | 5544 | 275 | 275 | 3.75% | 4.96% | 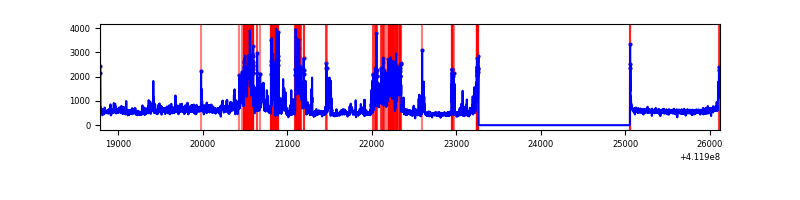 |
| D | 7334 | 5544 | 447 | 447 | 6.09% | 8.06% | 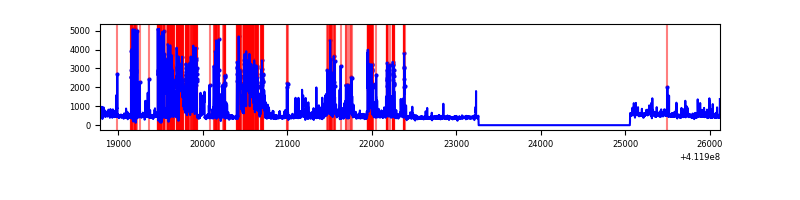 |
Top three noisy pixels from each quadrant. If the there are fewer than three noisy pixels in the level2.evt file, extra rows are filled as -1
| Pixel properties | Quadrant properties | ||||||
|---|---|---|---|---|---|---|---|
| Quadrant | DetID | PixID | Counts | Sigma | Mean | Median | Sigma |
| A | 10 | 83 | 455560 | 3648.07 | 613 | 600 | 124.7 |
| A | 15 | 222 | 307694 | 2462.41 | 613 | 600 | 124.7 |
| A | 2 | 79 | 35775 | 282.05 | 613 | 600 | 124.7 |
| B | 0 | 230 | 25463 | 210.84 | 611 | 594 | 118.0 |
| B | 5 | 255 | 23114 | 190.92 | 611 | 594 | 118.0 |
| B | 0 | 213 | 20178 | 166.03 | 611 | 594 | 118.0 |
| C | 9 | 187 | 1561666 | 11311.26 | 595 | 598 | 138.0 |
| C | 15 | 214 | 230975 | 1669.28 | 595 | 598 | 138.0 |
| C | 15 | 208 | 142603 | 1028.95 | 595 | 598 | 138.0 |
| D | 12 | 227 | 1060821 | 7489.1 | 580 | 563 | 141.6 |
| D | 12 | 0 | 727011 | 5131.24 | 580 | 563 | 141.6 |
| D | 13 | 249 | 266554 | 1878.82 | 580 | 563 | 141.6 |
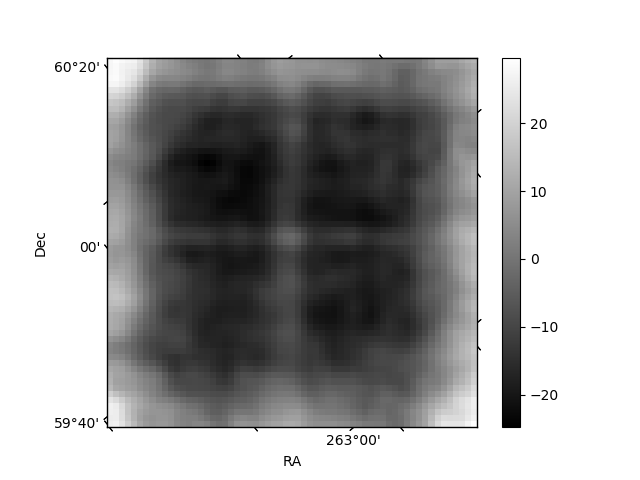
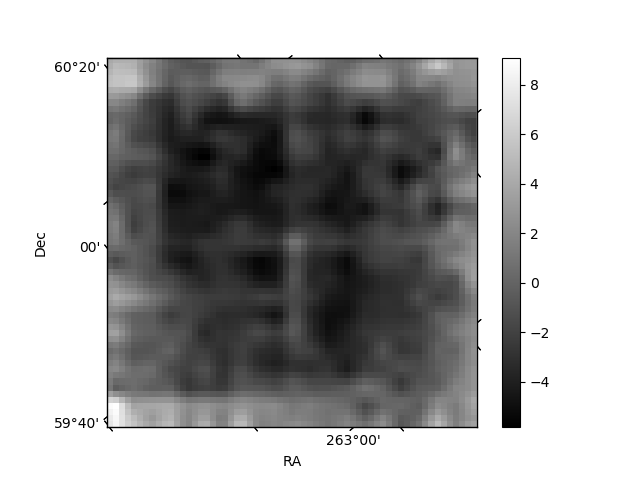
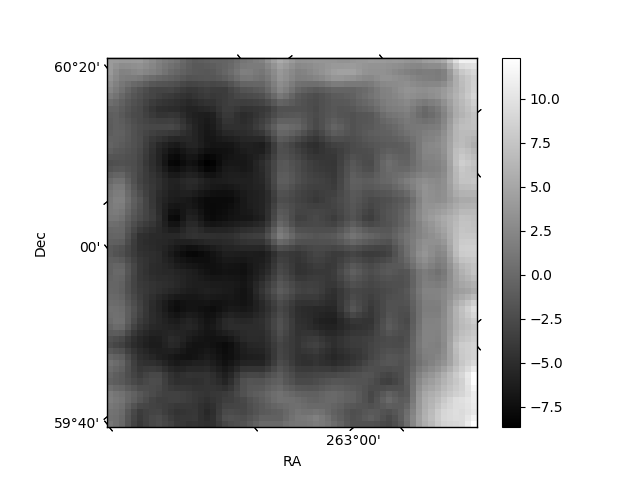
Histogram calculated using DETX and DETY for each event in the final _common_clean file
| Quadrant A | 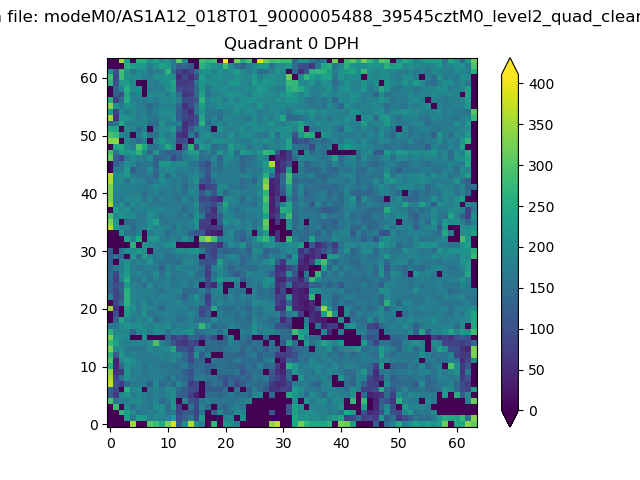 |
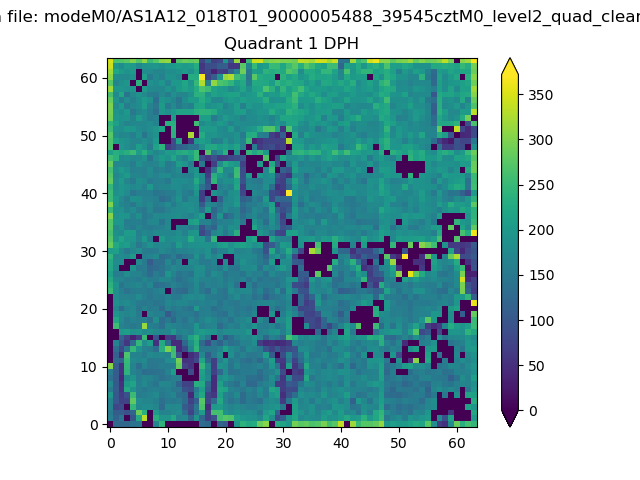 |
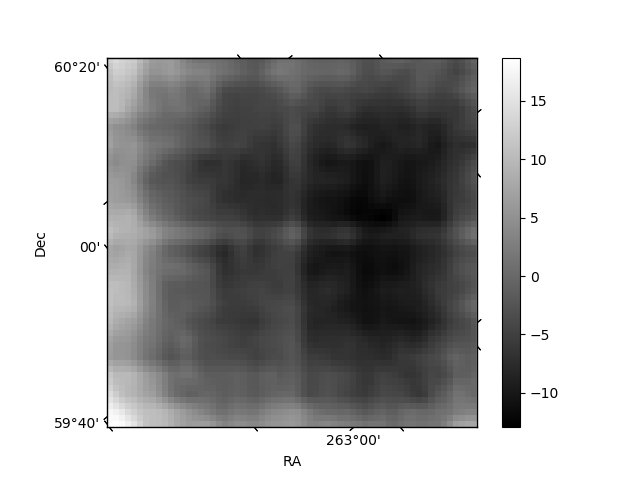
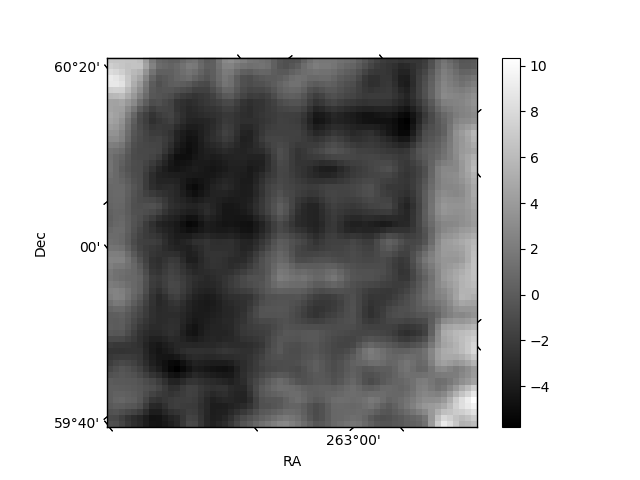
Quadrant B |
|---|---|---|---|
| Quadrant D | 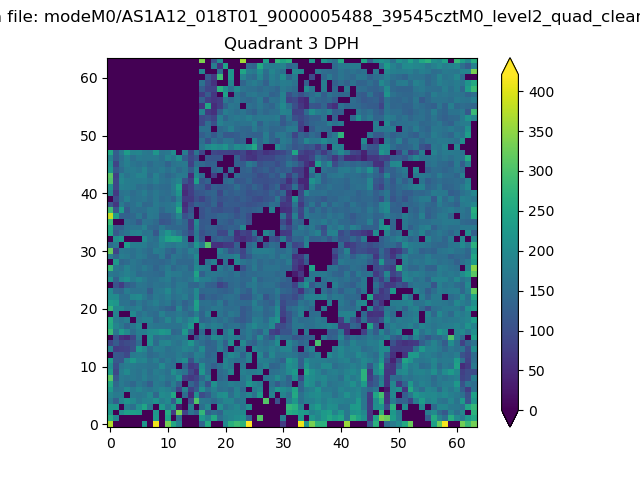 |
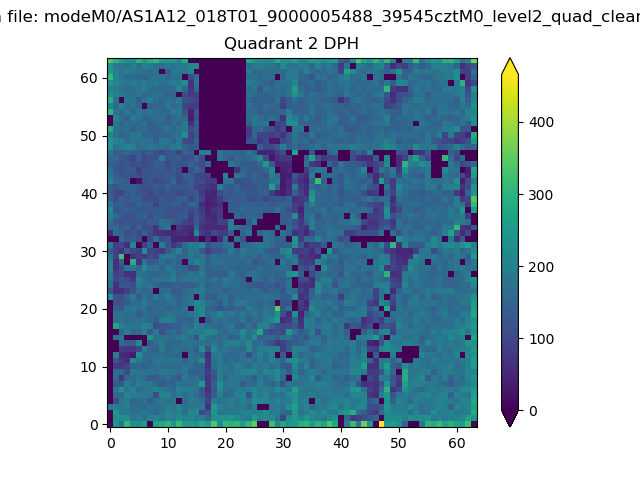 |
Quadrant C |
| Plot type | Count rate plots | Images |
|---|---|---|
| Comparison with Poisson distribution Blue bars denote a histogram of data divided into 1 sec bins. Red curve is a Poisson curve with rate = median count rate of data. |
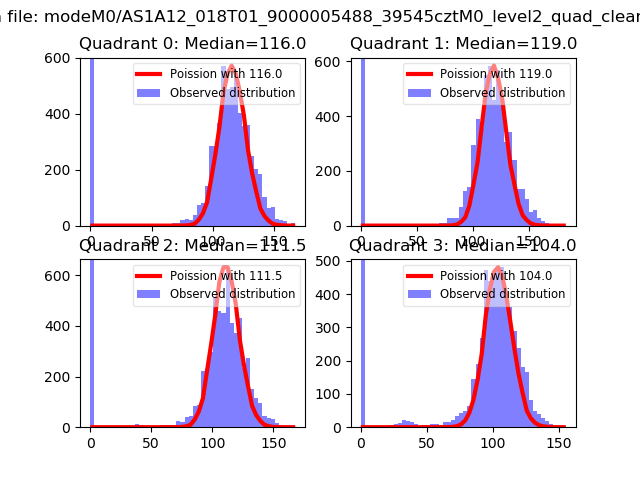 |
 |
| Quadrant-wise count rates Data is divided into 100 sec bins |
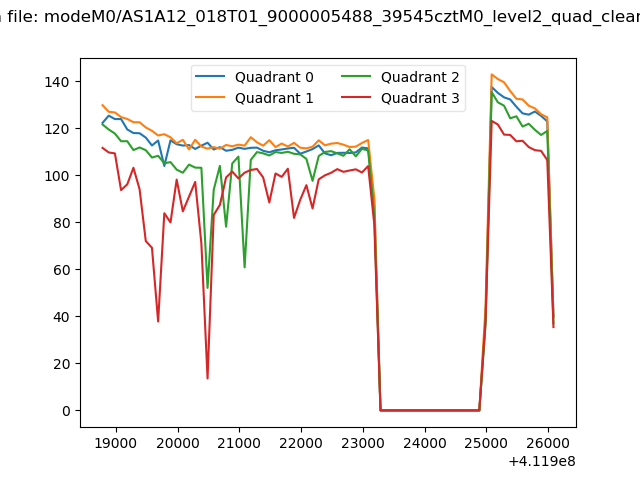 |
|
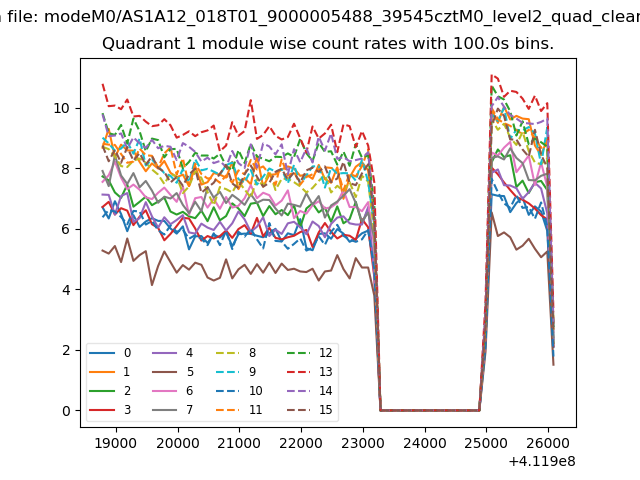
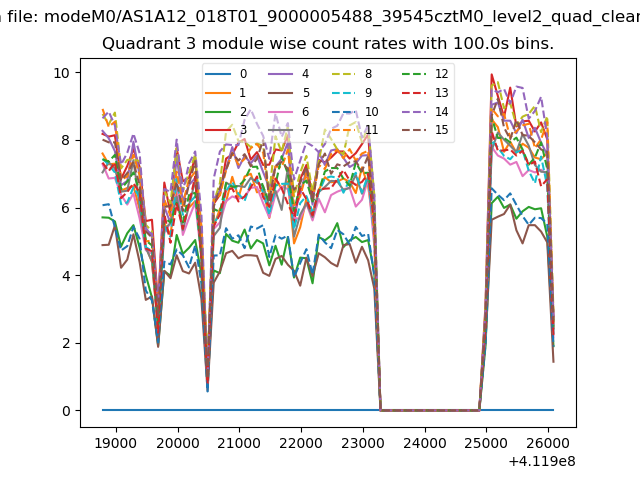
| Module-wise count rates for Quadrant A Data is divided into 100 sec bins |
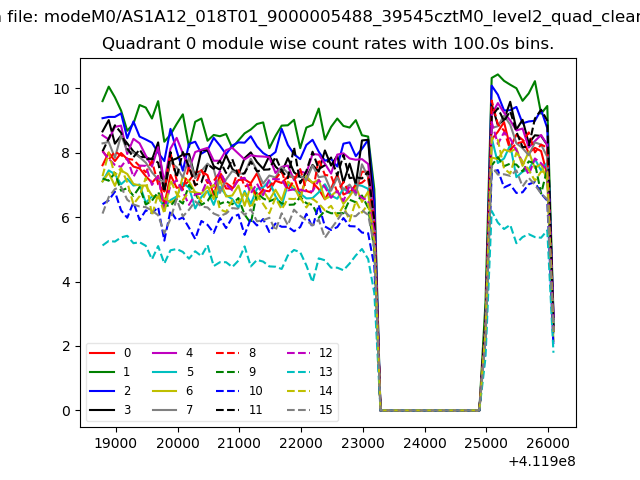 |
 |
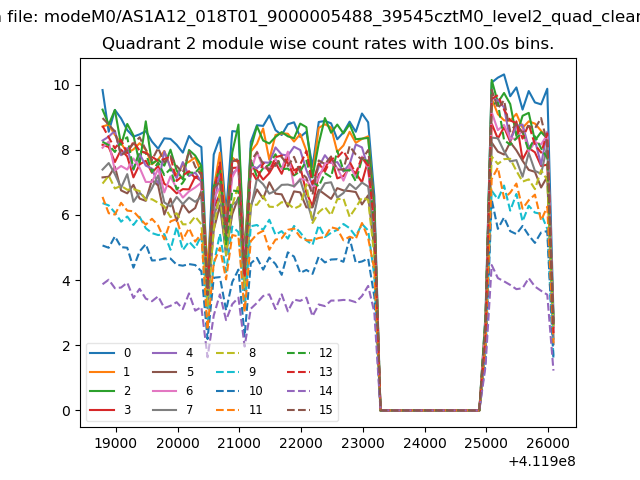
| Module-wise count rates for Quadrant B Data is divided into 100 sec bins |
 |
 |
| Module-wise count rates for Quadrant C Data is divided into 100 sec bins |
 |
 |
| Module-wise count rates for Quadrant D Data is divided into 100 sec bins |
 |
 |
| Parameter | Plot |
|---|---|
| CZT HV Monitor | 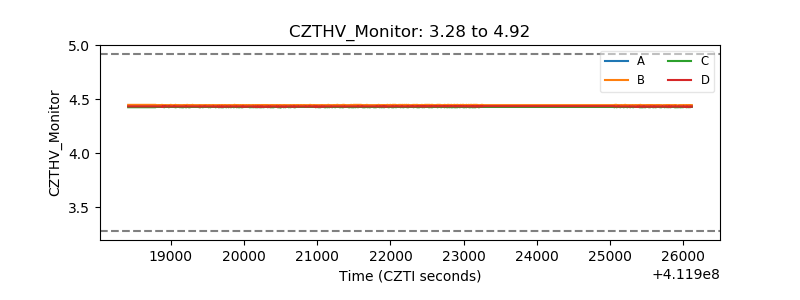 |
| D_VDD | 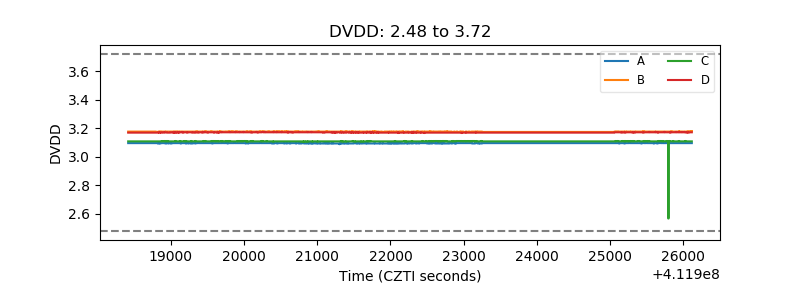 |
| Temperature 1 | 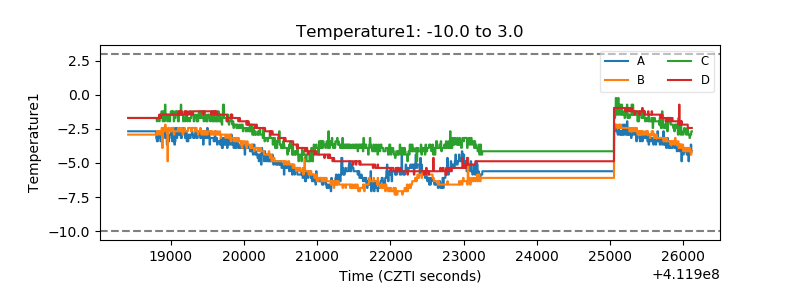 |
| Veto HV Monitor | 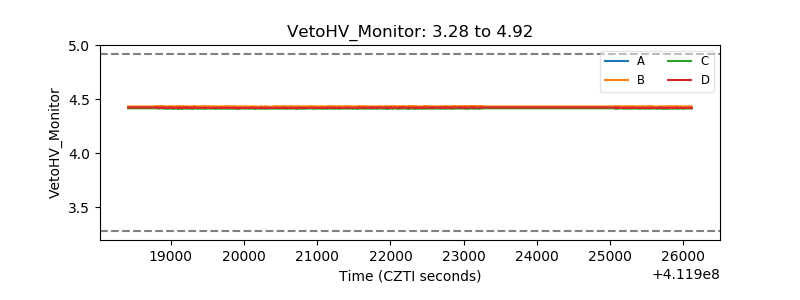 |
| Veto LLD | 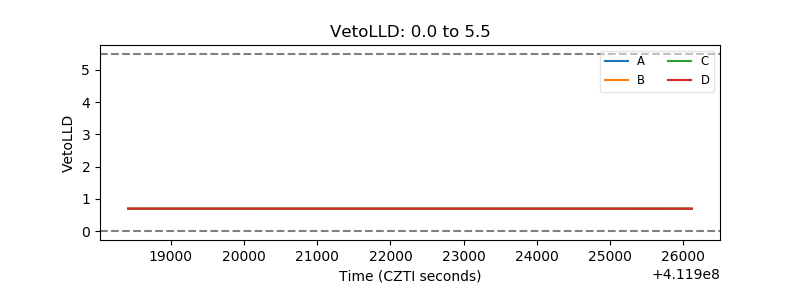 |
| Alpha Counter | 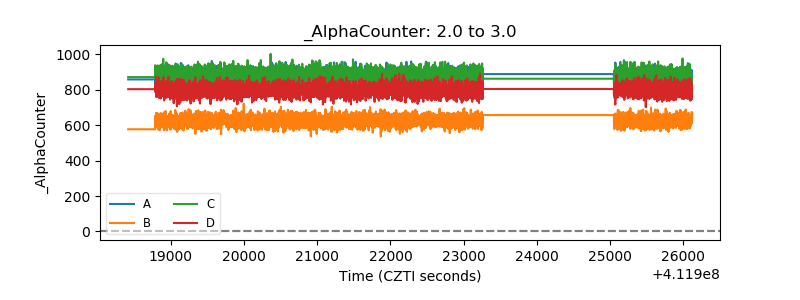 |
| _CPM_Rate | 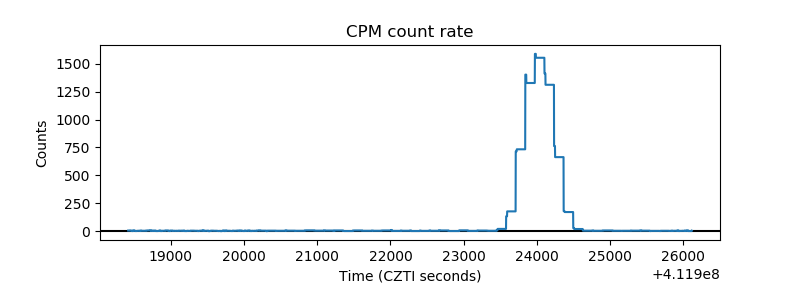 |
| CZT Counter | 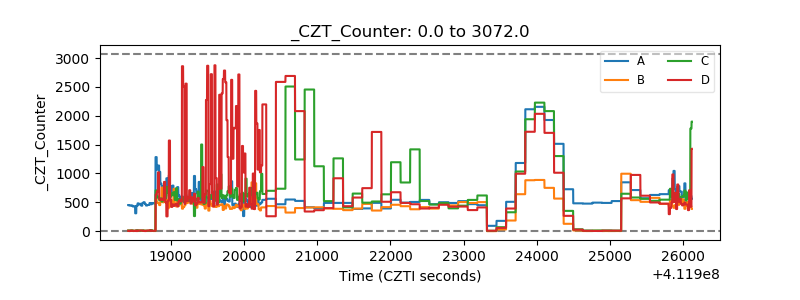 |
| +2.5 Volts monitor | 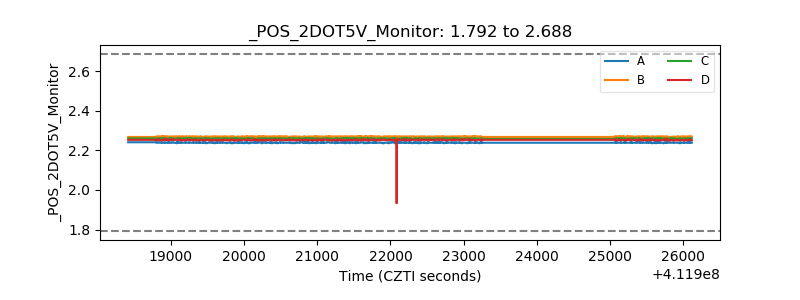 |
| +5 Volts monitor | 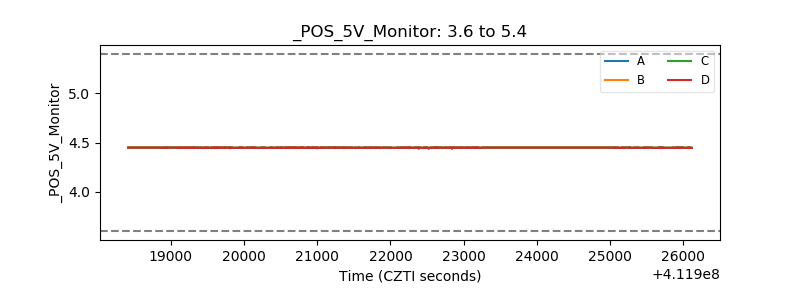 |
| _ROLL_ROT | 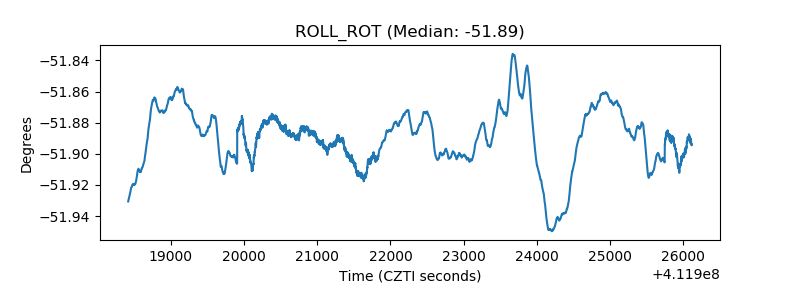 |
| _Roll_DEC | 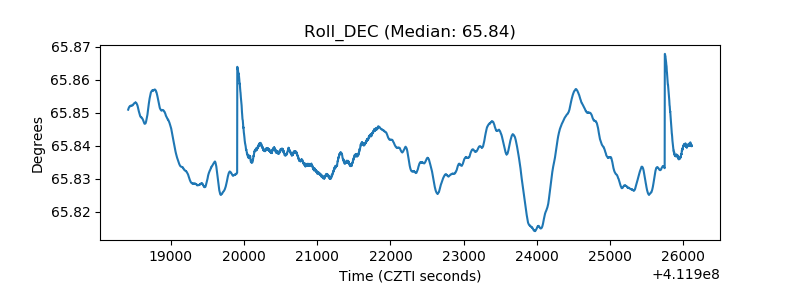 |
| _Roll_RA | 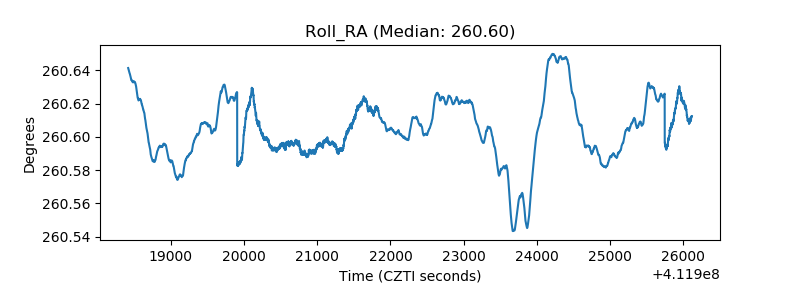 |
| Veto Counter | 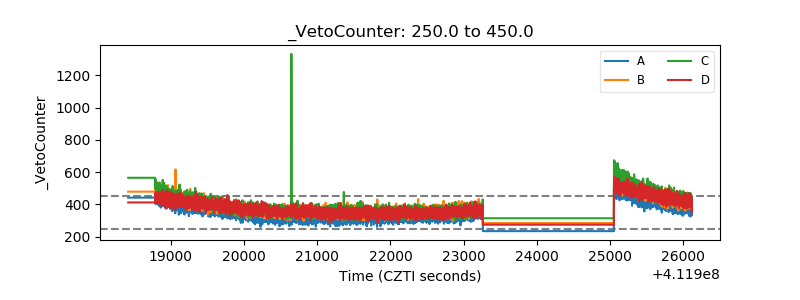 |