| Param | Original file | Final file |
|---|---|---|
| Filename | modeM0/AS1A12_018T01_9000005488_39546cztM0_level2.fits | modeM0/AS1A12_018T01_9000005488_39546cztM0_level2_quad_clean.evt |
| Size (bytes) | 673,079,040 | 160,424,640 |
| Size | 641.9 MB | 153.0 MB |
| Events in quadrant A | 5,300,751 | 1,104,049 |
| Events in quadrant B | 4,245,457 | 1,134,484 |
| Events in quadrant C | 7,804,690 | 1,020,878 |
| Events in quadrant D | 6,831,635 | 943,149 |
| Mode SS | |||
|---|---|---|---|
| Quadrant | BADHDUFLAG | Total packets | Discarded packets |
| A | 0 | 192 | 0 |
| B | 0 | 192 | 0 |
| C | 0 | 192 | 0 |
| D | 0 | 192 | 0 |
| Mode M0 | |||
|---|---|---|---|
| Quadrant | BADHDUFLAG | Total packets | Discarded packets |
| A | 0 | 21897 | 3 |
| B | 0 | 19256 | 2 |
| C | 0 | 29533 | 5 |
| D | 0 | 27061 | 2 |
| Mode M9 | |||
|---|---|---|---|
| Quadrant | BADHDUFLAG | Total packets | Discarded packets |
| A | 0 | 37 | 0 |
| B | 0 | 37 | 0 |
| C | 0 | 37 | 0 |
| D | 0 | 37 | 0 |
| Quadrant | Total seconds | Saturated seconds | Saturation percentage |
|---|---|---|---|
| A | 9452 | 37 | 0.391452% |
| B | 9452 | 10 | 0.105798% |
| C | 9451 | 645 | 6.824675% |
| D | 9452 | 662 | 7.003809% |
Noise dominated data is calculated using 1-second bins in cleaned event files. If a bin has >2000 counts, and if more than 50% of those come from <1% of pixels, then it is considered to be noise-dominated and hence unusable.
| Quadrant | # 1 sec bins | Bins with >0 counts | Bins with >2000 counts | High rate bins dominated by noise | Noise dominated (total time) | Noise dominated (detector-on time) | Marked lightcurve |
|---|---|---|---|---|---|---|---|
| A | 13126 | 9454 | 29 | 29 | 0.22% | 0.31% | 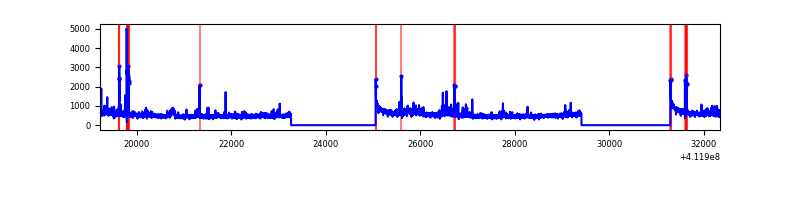 |
| B | 13126 | 9454 | 4 | 4 | 0.03% | 0.04% | 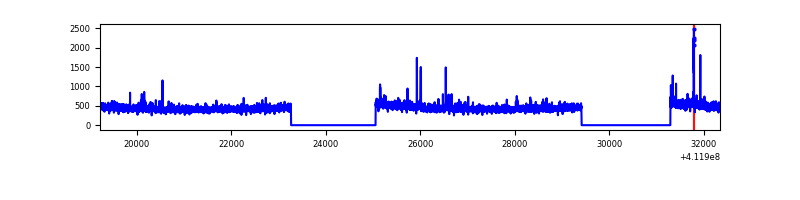 |
| C | 13126 | 9454 | 641 | 641 | 4.88% | 6.78% | 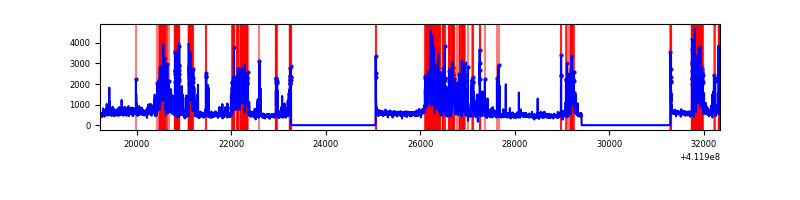 |
| D | 13125 | 9453 | 574 | 574 | 4.37% | 6.07% | 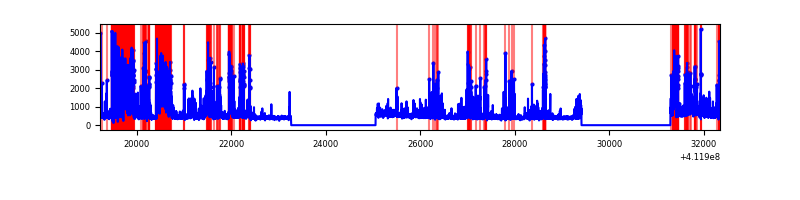 |
Top three noisy pixels from each quadrant. If the there are fewer than three noisy pixels in the level2.evt file, extra rows are filled as -1
| Pixel properties | Quadrant properties | ||||||
|---|---|---|---|---|---|---|---|
| Quadrant | DetID | PixID | Counts | Sigma | Mean | Median | Sigma |
| A | 10 | 83 | 663645 | 3168.18 | 1040 | 1019 | 209.2 |
| A | 15 | 222 | 492922 | 2351.91 | 1040 | 1019 | 209.2 |
| A | 2 | 79 | 41870 | 195.32 | 1040 | 1019 | 209.2 |
| B | 5 | 255 | 67280 | 335.09 | 1041 | 1011 | 197.8 |
| B | 0 | 213 | 42166 | 208.1 | 1041 | 1011 | 197.8 |
| B | 0 | 230 | 33976 | 166.69 | 1041 | 1011 | 197.8 |
| C | 9 | 187 | 3158863 | 13672.52 | 1004 | 1011 | 231.0 |
| C | 15 | 214 | 380343 | 1642.39 | 1004 | 1011 | 231.0 |
| C | 15 | 208 | 283323 | 1222.32 | 1004 | 1011 | 231.0 |
| D | 12 | 0 | 1055914 | 4399.46 | 995 | 970 | 239.8 |
| D | 12 | 227 | 1014299 | 4225.91 | 995 | 970 | 239.8 |
| D | 13 | 249 | 422219 | 1756.74 | 995 | 970 | 239.8 |
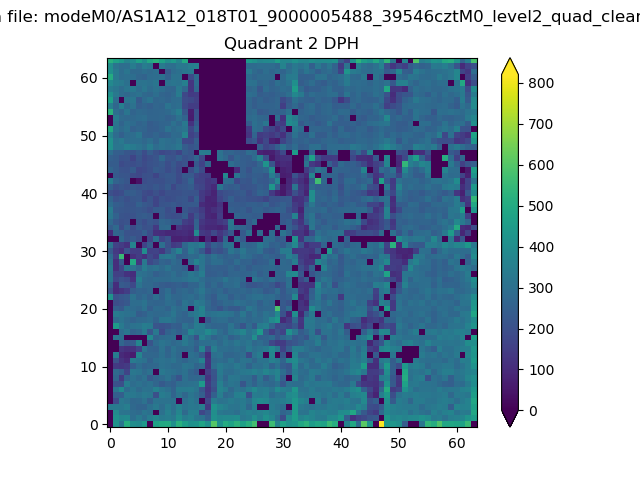
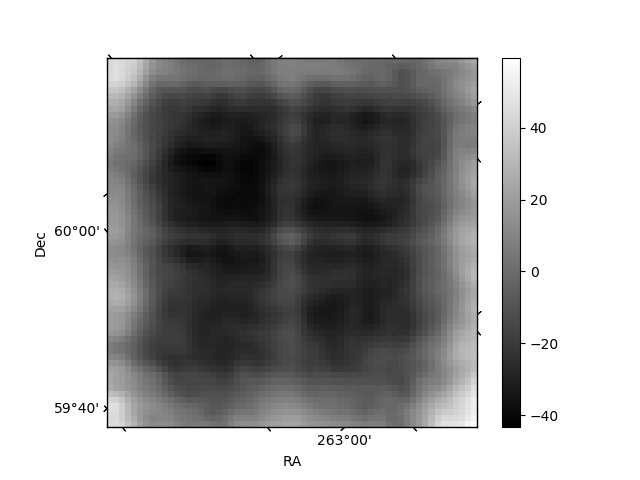
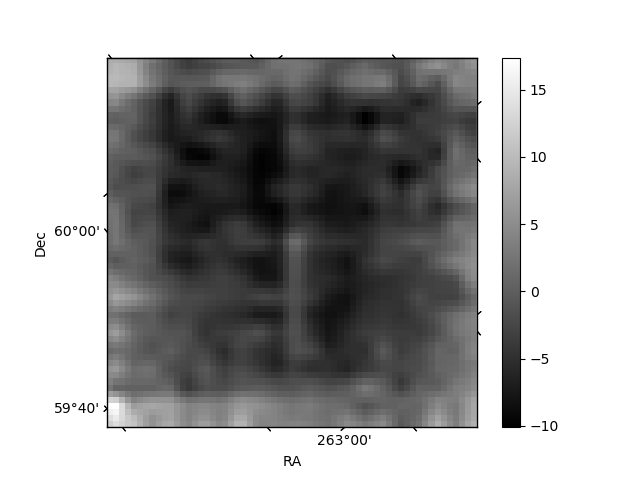
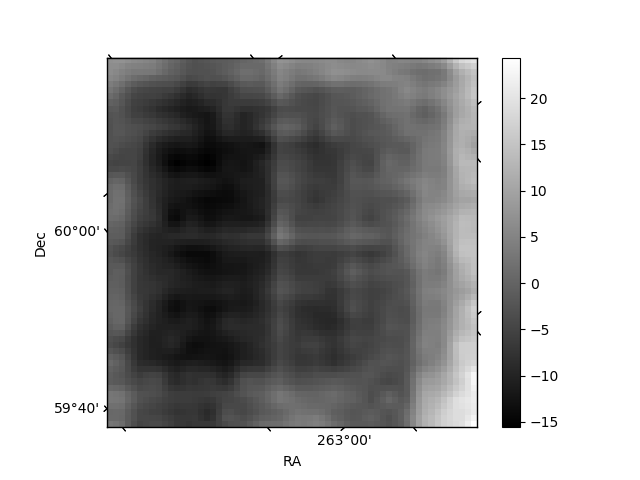
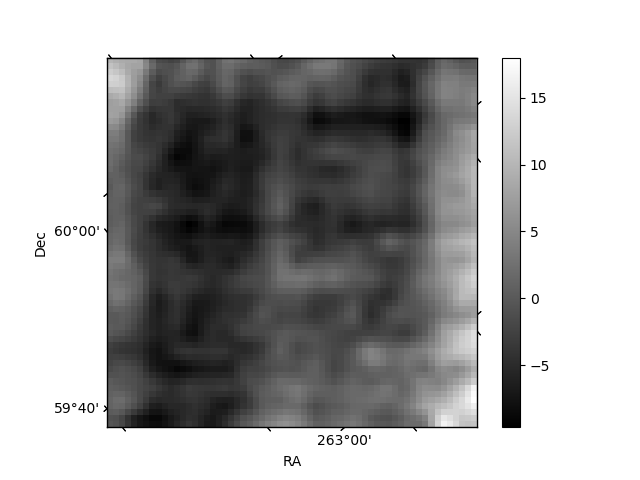
Histogram calculated using DETX and DETY for each event in the final _common_clean file
| Quadrant A | 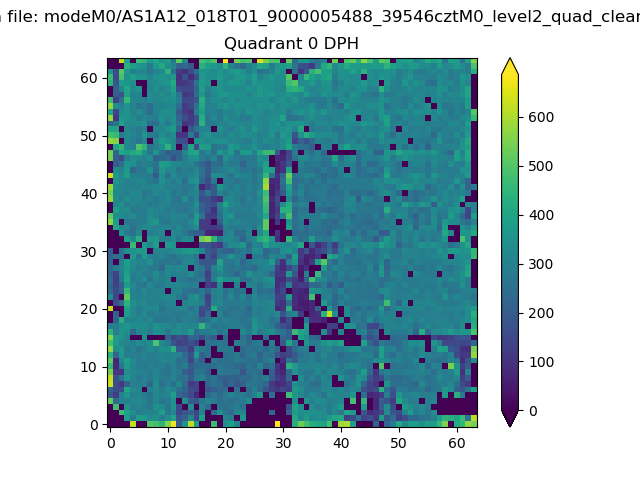 |
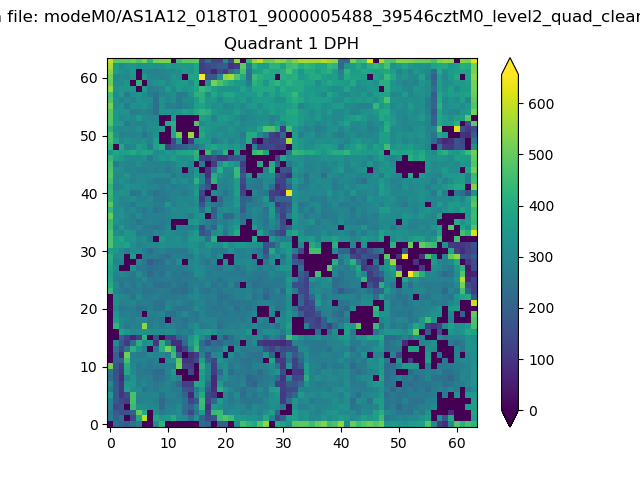 |
Quadrant B |
|---|---|---|---|
| Quadrant D | 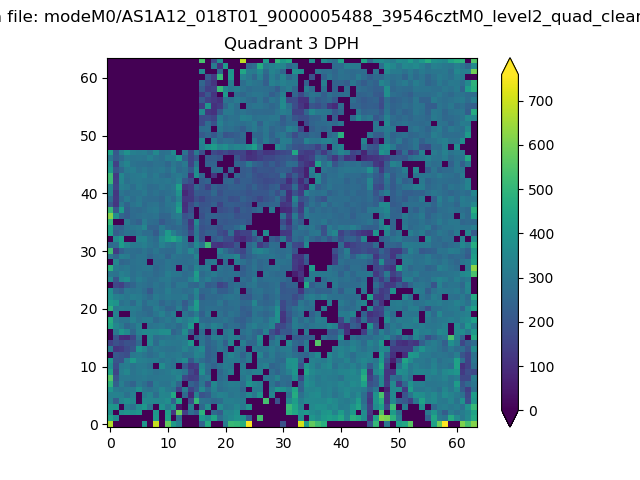 |
 |
Quadrant C |
| Plot type | Count rate plots | Images |
|---|---|---|
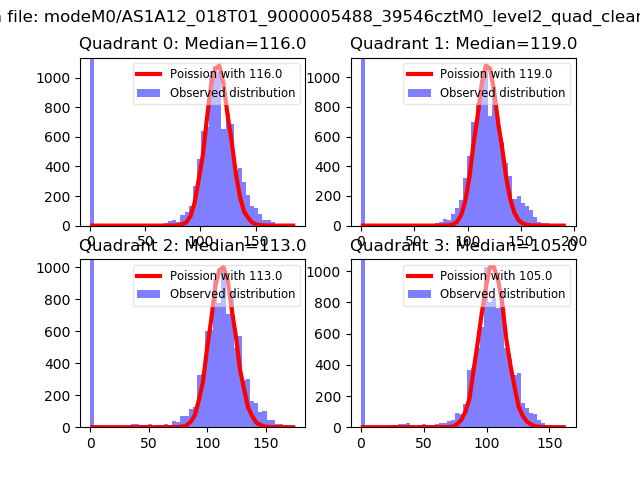
| Comparison with Poisson distribution Blue bars denote a histogram of data divided into 1 sec bins. Red curve is a Poisson curve with rate = median count rate of data. |
 |
 |
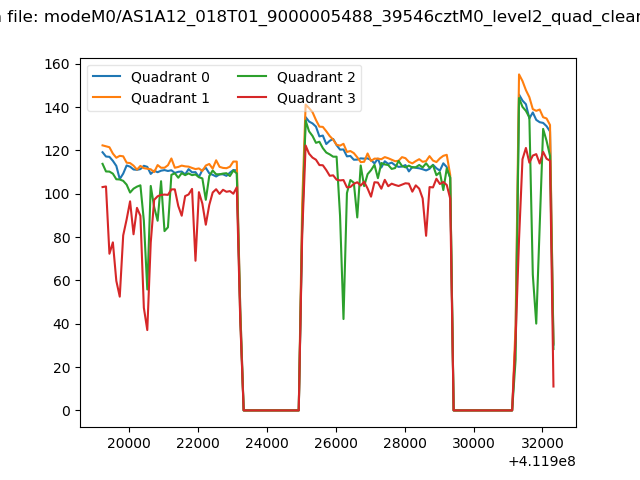
| Quadrant-wise count rates Data is divided into 100 sec bins |
 |
|
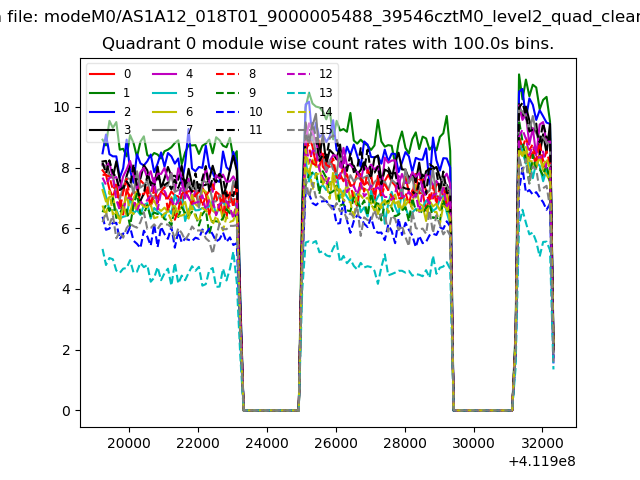
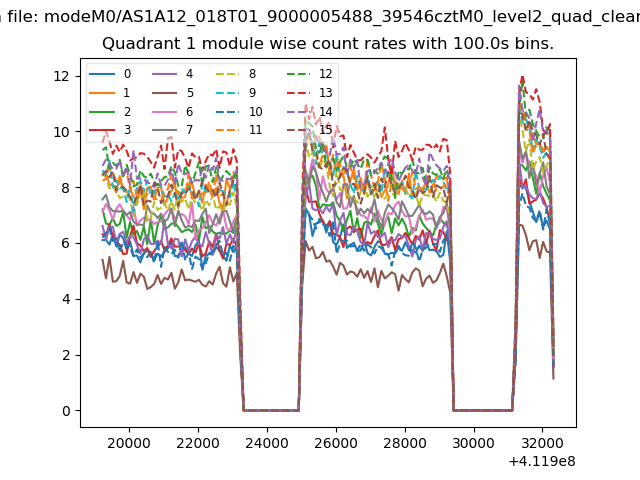
| Module-wise count rates for Quadrant A Data is divided into 100 sec bins |
 |
 |
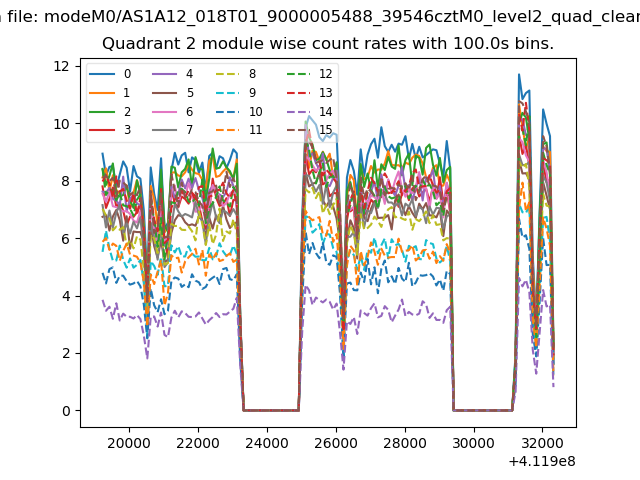
| Module-wise count rates for Quadrant B Data is divided into 100 sec bins |
 |
 |
| Module-wise count rates for Quadrant C Data is divided into 100 sec bins |
 |
 |
| Module-wise count rates for Quadrant D Data is divided into 100 sec bins |
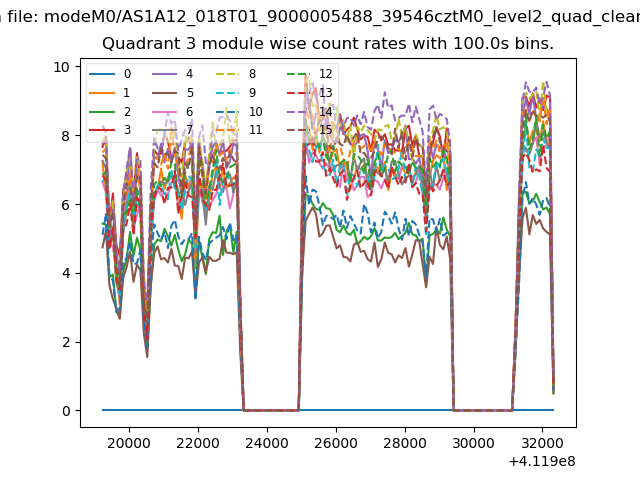 |
 |
| Parameter | Plot |
|---|---|
| CZT HV Monitor | 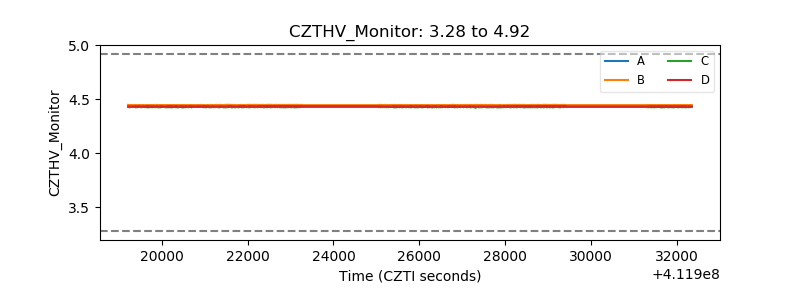 |
| D_VDD | 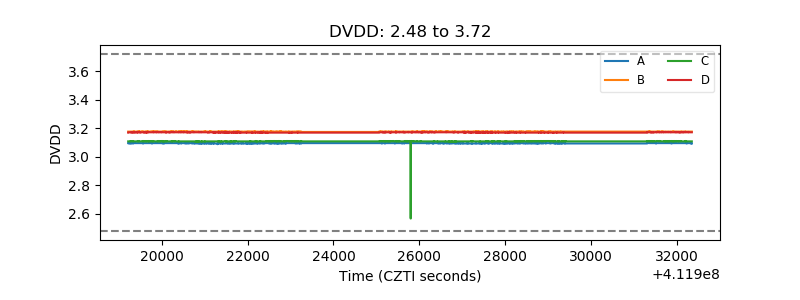 |
| Temperature 1 | 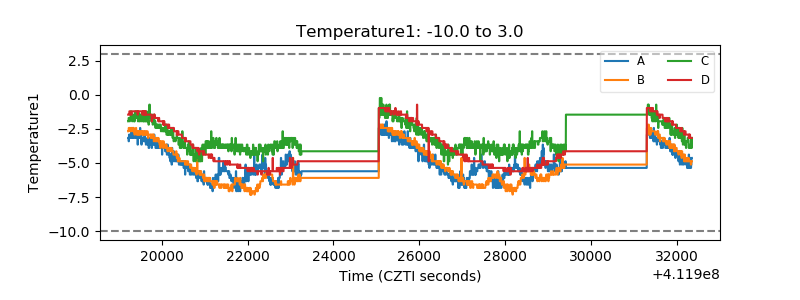 |
| Veto HV Monitor | 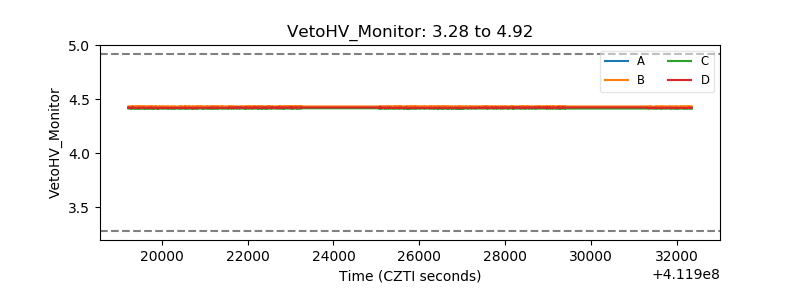 |
| Veto LLD | 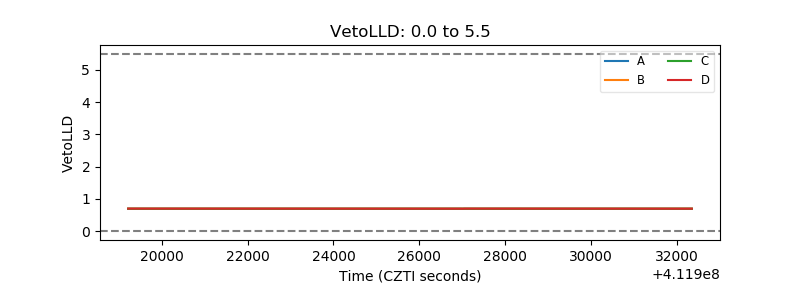 |
| Alpha Counter | 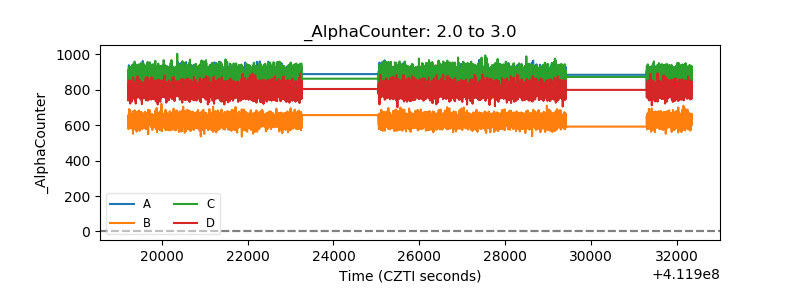 |
| _CPM_Rate | 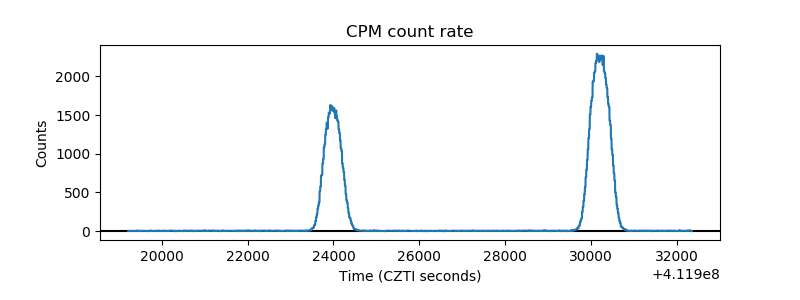 |
| CZT Counter | 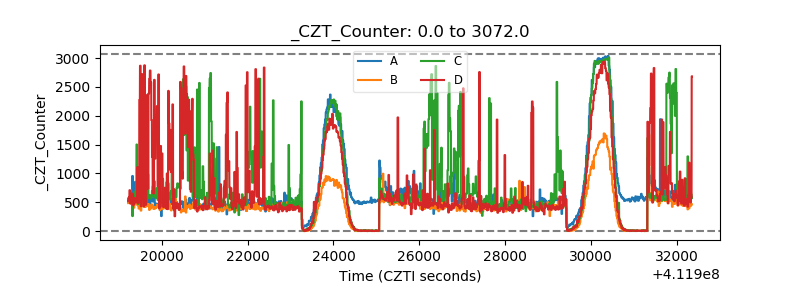 |
| +2.5 Volts monitor | 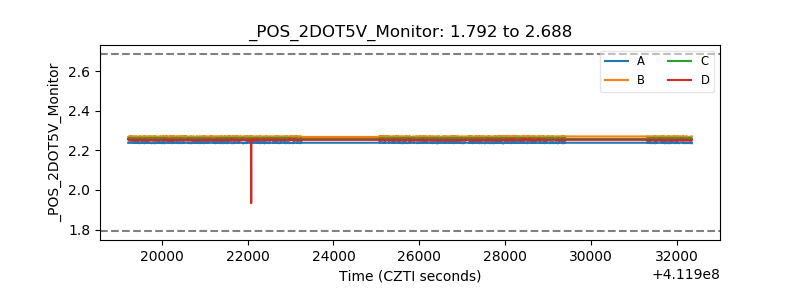 |
| +5 Volts monitor | 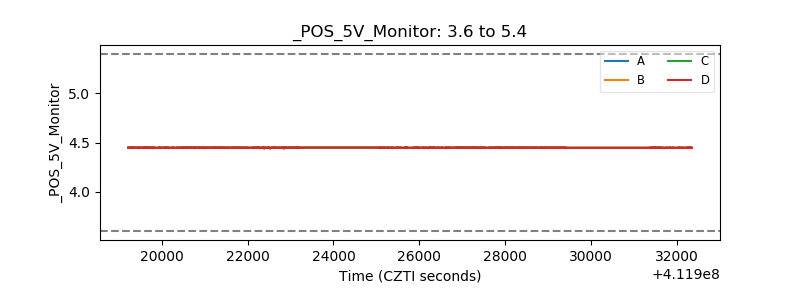 |
| _ROLL_ROT | 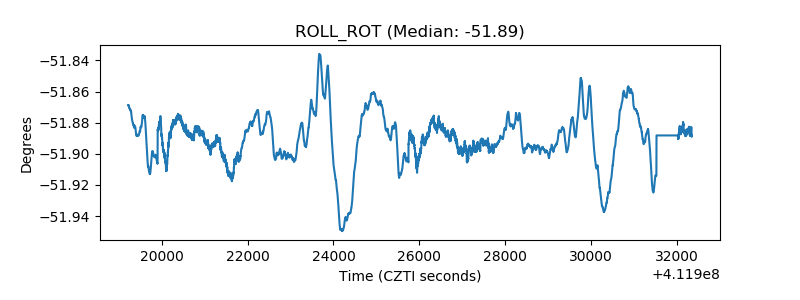 |
| _Roll_DEC | 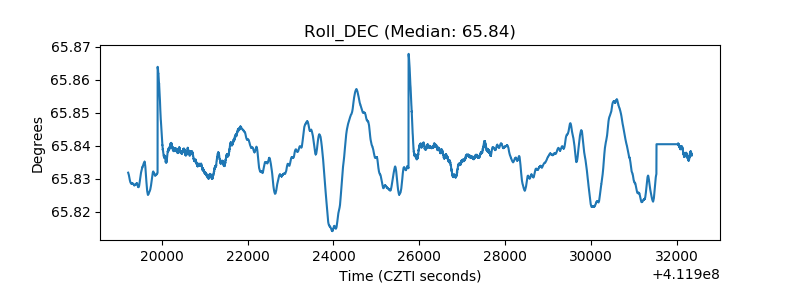 |
| _Roll_RA | 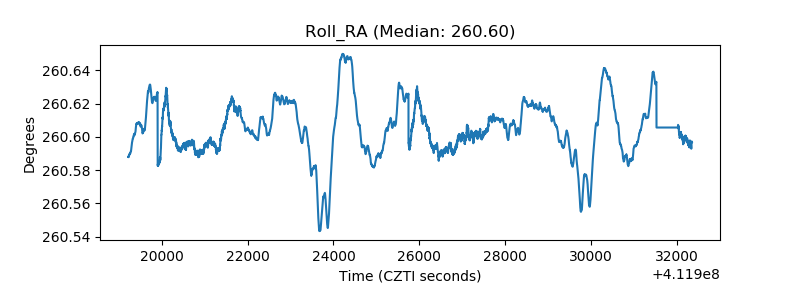 |
| Veto Counter | 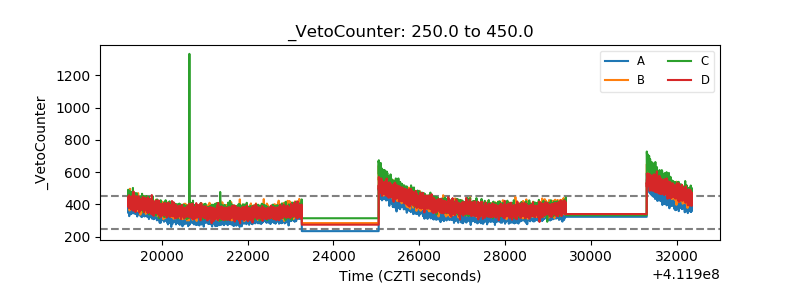 |