| Param | Original file | Final file |
|---|---|---|
| Filename | modeM0/AS1A12_018T01_9000005488_39547cztM0_level2.fits | modeM0/AS1A12_018T01_9000005488_39547cztM0_level2_quad_clean.evt |
| Size (bytes) | 379,897,920 | 91,716,480 |
| Size | 362.3 MB | 87.5 MB |
| Events in quadrant A | 3,426,035 | 628,000 |
| Events in quadrant B | 2,364,744 | 655,133 |
| Events in quadrant C | 4,447,863 | 581,483 |
| Events in quadrant D | 3,431,995 | 559,364 |
| Mode SS | |||
|---|---|---|---|
| Quadrant | BADHDUFLAG | Total packets | Discarded packets |
| A | 0 | 104 | 0 |
| B | 0 | 104 | 0 |
| C | 0 | 104 | 0 |
| D | 0 | 104 | 0 |
| Mode M0 | |||
|---|---|---|---|
| Quadrant | BADHDUFLAG | Total packets | Discarded packets |
| A | 0 | 13463 | 3 |
| B | 0 | 10373 | 2 |
| C | 0 | 16651 | 2 |
| D | 0 | 13698 | 2 |
| Mode M9 | |||
|---|---|---|---|
| Quadrant | BADHDUFLAG | Total packets | Discarded packets |
| A | 0 | 24 | 0 |
| B | 0 | 24 | 0 |
| C | 0 | 24 | 0 |
| D | 0 | 25 | 0 |
| Quadrant | Total seconds | Saturated seconds | Saturation percentage |
|---|---|---|---|
| A | 5040 | 89 | 1.765873% |
| B | 5040 | 14 | 0.277778% |
| C | 5040 | 474 | 9.404762% |
| D | 5040 | 221 | 4.384921% |
Noise dominated data is calculated using 1-second bins in cleaned event files. If a bin has >2000 counts, and if more than 50% of those come from <1% of pixels, then it is considered to be noise-dominated and hence unusable.
| Quadrant | # 1 sec bins | Bins with >0 counts | Bins with >2000 counts | High rate bins dominated by noise | Noise dominated (total time) | Noise dominated (detector-on time) | Marked lightcurve |
|---|---|---|---|---|---|---|---|
| A | 7043 | 5041 | 72 | 72 | 1.02% | 1.43% | 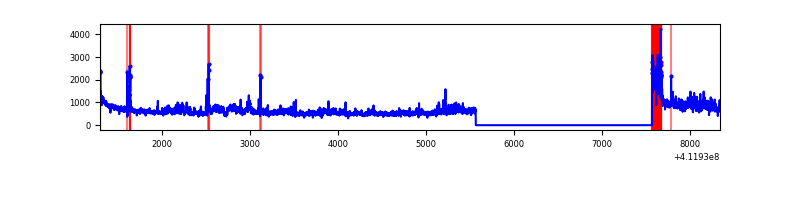 |
| B | 7043 | 5041 | 5 | 5 | 0.07% | 0.10% | 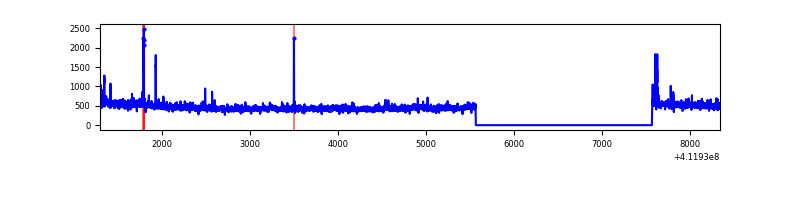 |
| C | 7043 | 5041 | 410 | 410 | 5.82% | 8.13% | 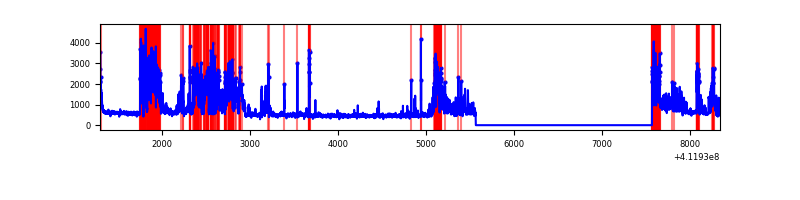 |
| D | 7043 | 5041 | 193 | 193 | 2.74% | 3.83% | 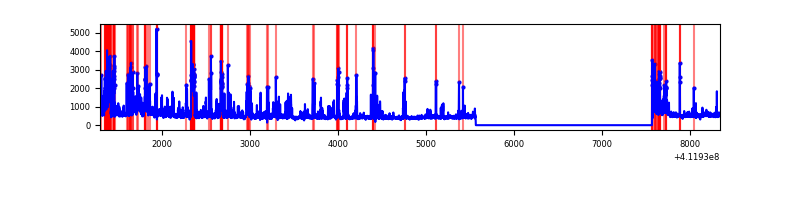 |
Top three noisy pixels from each quadrant. If the there are fewer than three noisy pixels in the level2.evt file, extra rows are filled as -1
| Pixel properties | Quadrant properties | ||||||
|---|---|---|---|---|---|---|---|
| Quadrant | DetID | PixID | Counts | Sigma | Mean | Median | Sigma |
| A | 15 | 222 | 706547 | 6073.71 | 576 | 564 | 116.2 |
| A | 10 | 83 | 425718 | 3657.68 | 576 | 564 | 116.2 |
| A | 2 | 79 | 21409 | 179.33 | 576 | 564 | 116.2 |
| B | 5 | 255 | 44961 | 405.1 | 580 | 565 | 109.6 |
| B | 0 | 230 | 21768 | 193.47 | 580 | 565 | 109.6 |
| B | 12 | 111 | 13167 | 114.99 | 580 | 565 | 109.6 |
| C | 9 | 187 | 1838921 | 14304.37 | 559 | 566 | 128.5 |
| C | 15 | 214 | 208471 | 1617.72 | 559 | 566 | 128.5 |
| C | 15 | 208 | 147977 | 1147.02 | 559 | 566 | 128.5 |
| D | 13 | 249 | 296138 | 2194.5 | 559 | 544 | 134.7 |
| D | 12 | 0 | 225448 | 1669.7 | 559 | 544 | 134.7 |
| D | 12 | 227 | 184316 | 1364.33 | 559 | 544 | 134.7 |
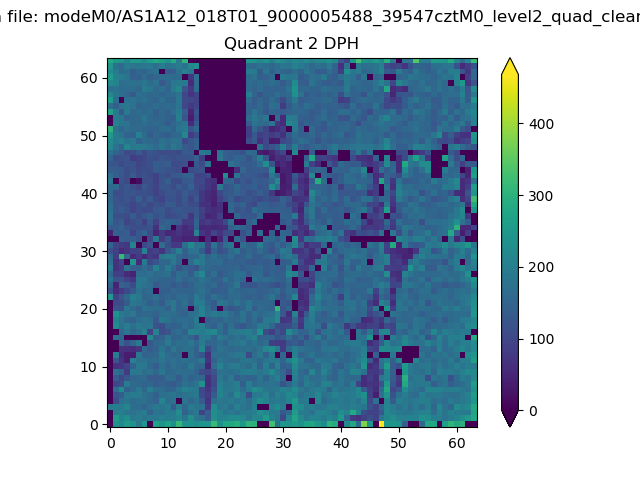
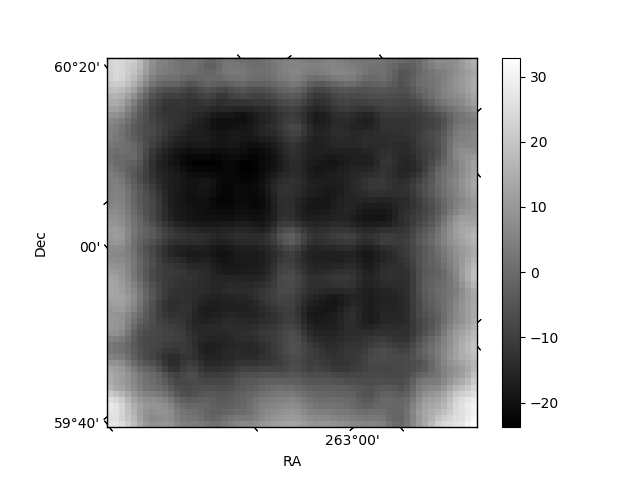
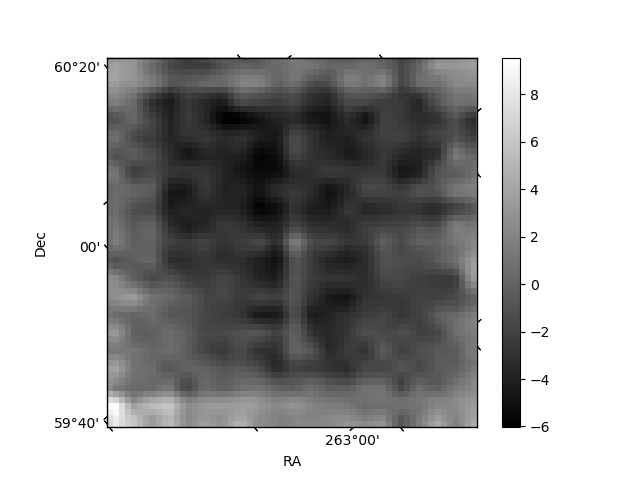
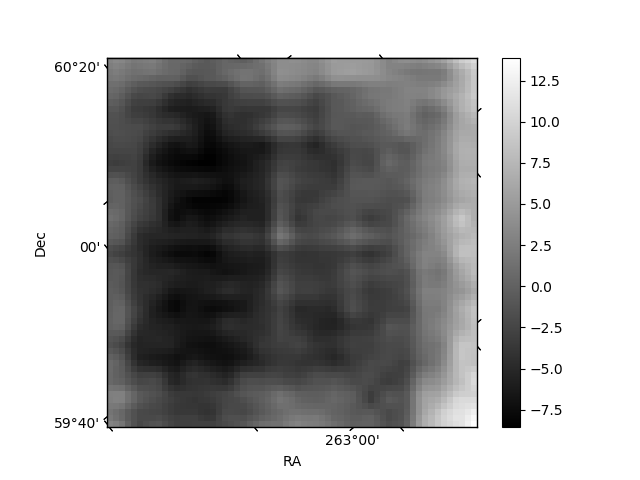
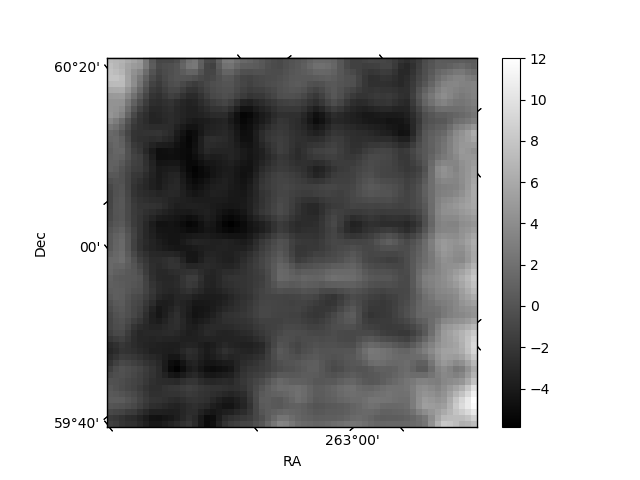
Histogram calculated using DETX and DETY for each event in the final _common_clean file
| Quadrant A | 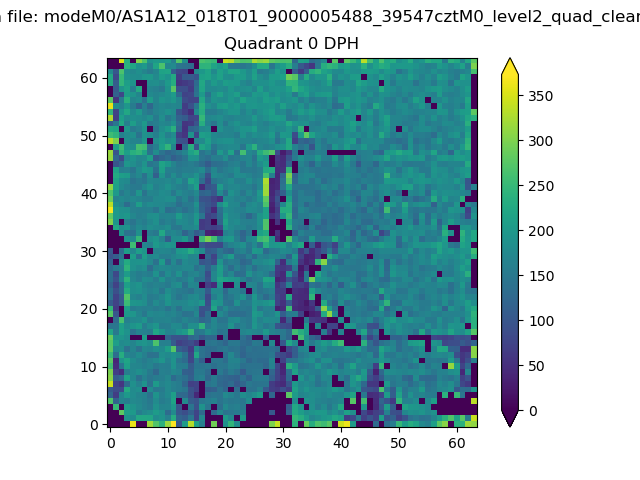 |
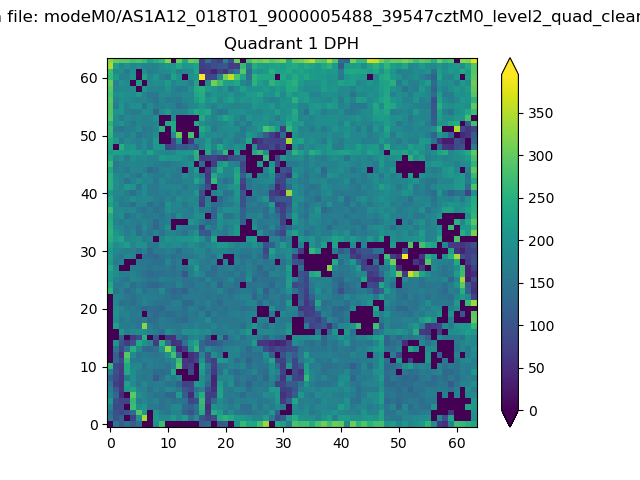 |
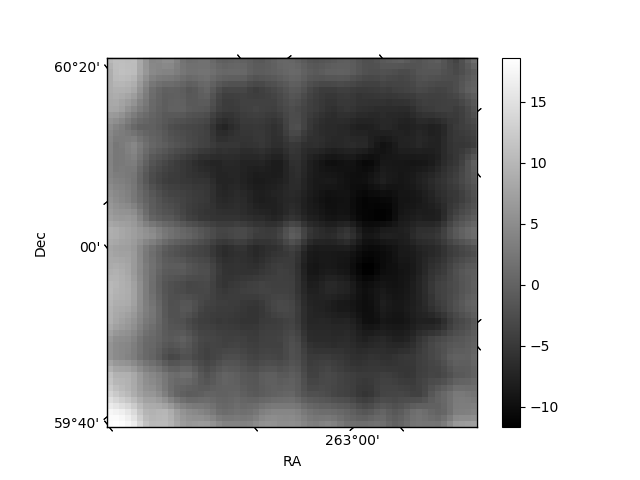
Quadrant B |
|---|---|---|---|
| Quadrant D | 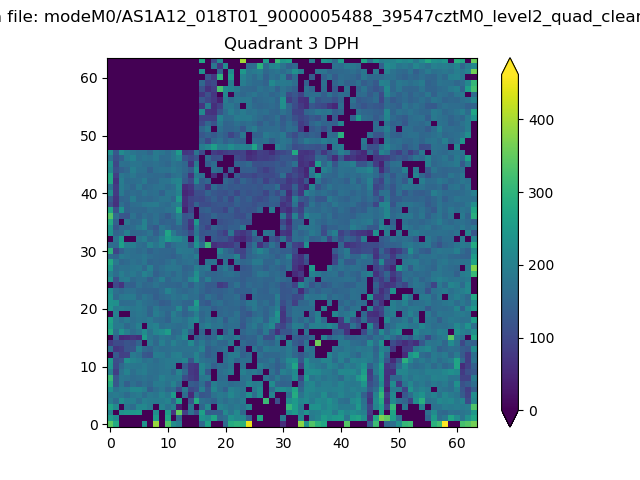 |
 |
Quadrant C |
| Plot type | Count rate plots | Images |
|---|---|---|
| Comparison with Poisson distribution Blue bars denote a histogram of data divided into 1 sec bins. Red curve is a Poisson curve with rate = median count rate of data. |
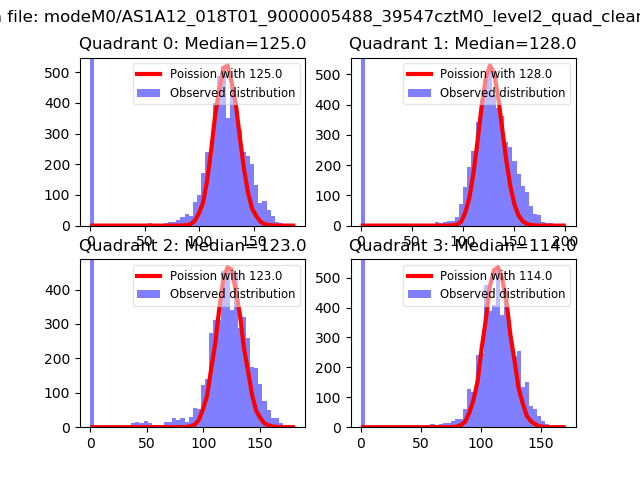 |
 |
| Quadrant-wise count rates Data is divided into 100 sec bins |
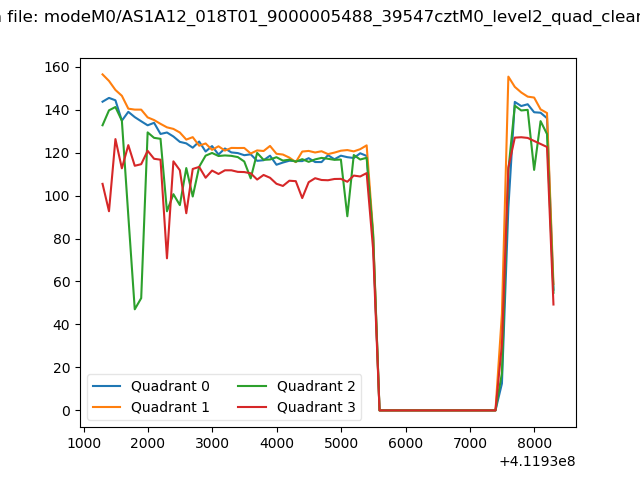 |
|
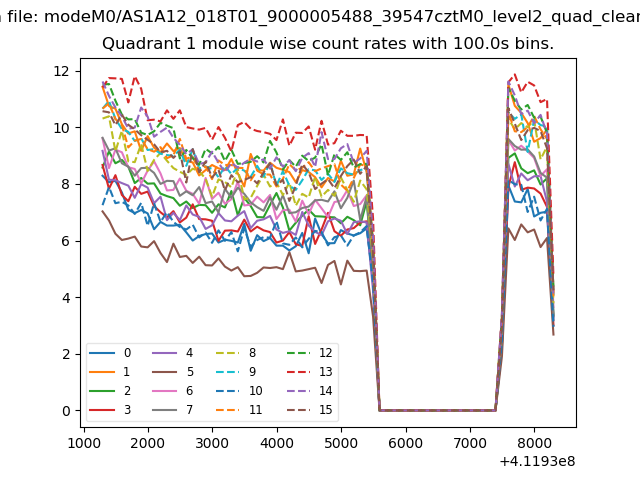
| Module-wise count rates for Quadrant A Data is divided into 100 sec bins |
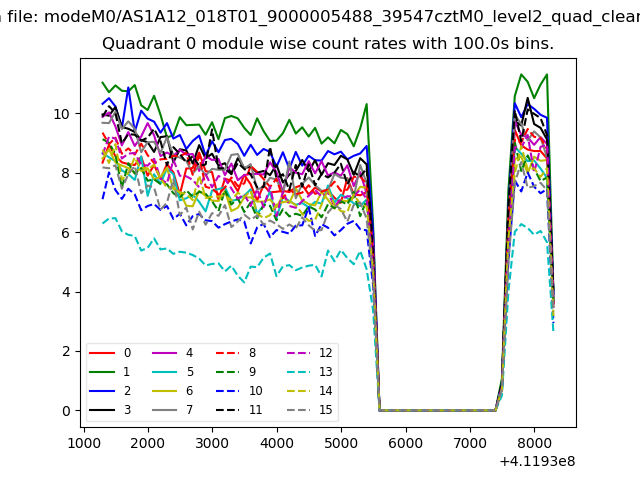 |
 |
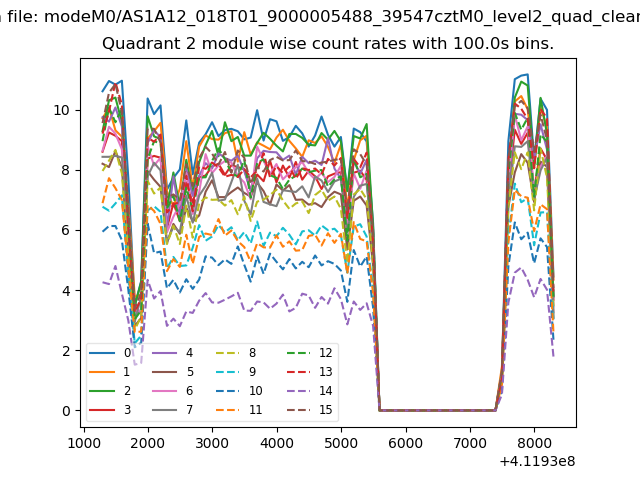
| Module-wise count rates for Quadrant B Data is divided into 100 sec bins |
 |
 |
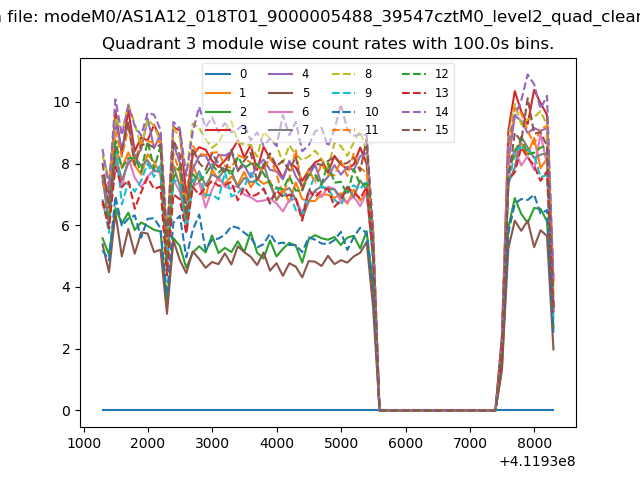
| Module-wise count rates for Quadrant C Data is divided into 100 sec bins |
 |
 |
| Module-wise count rates for Quadrant D Data is divided into 100 sec bins |
 |
 |
| Parameter | Plot |
|---|---|
| CZT HV Monitor | 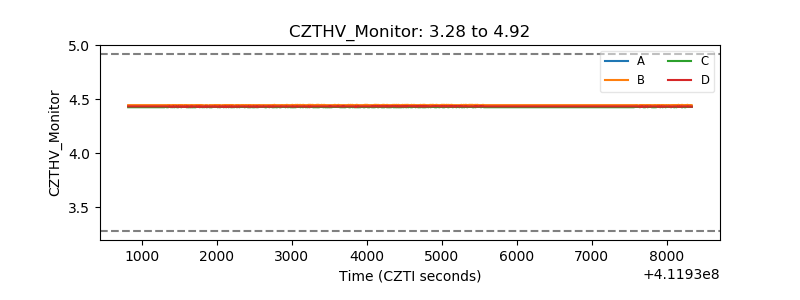 |
| D_VDD | 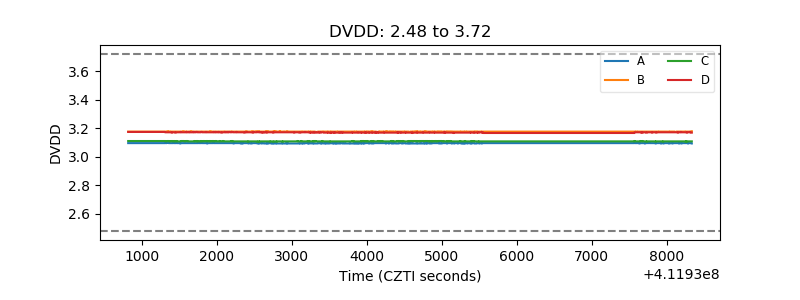 |
| Temperature 1 | 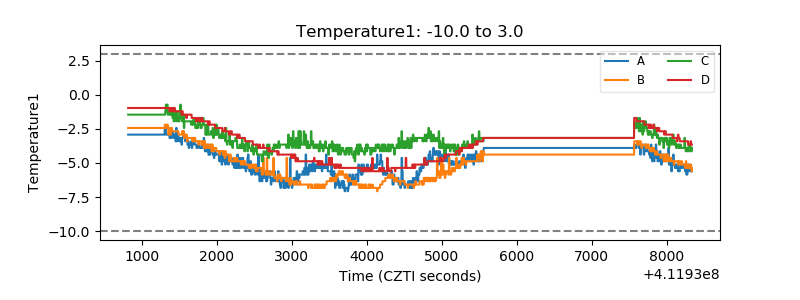 |
| Veto HV Monitor | 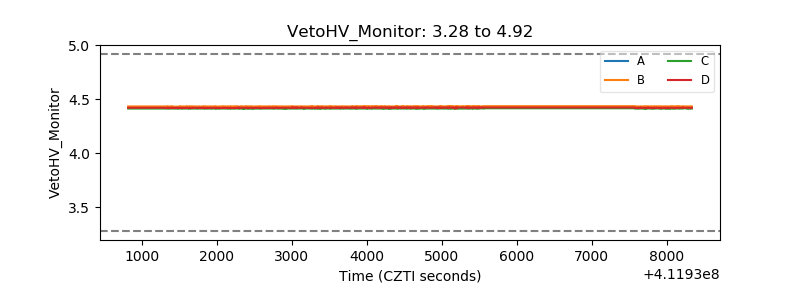 |
| Veto LLD | 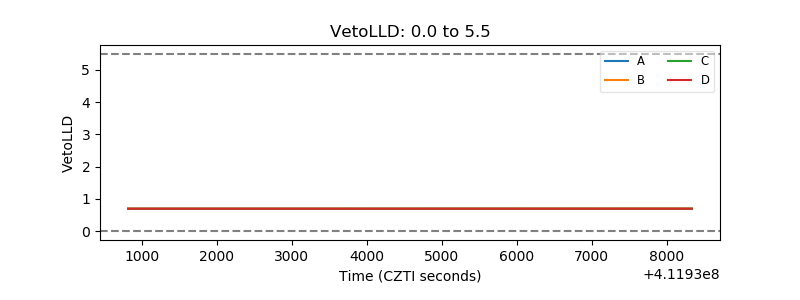 |
| Alpha Counter | 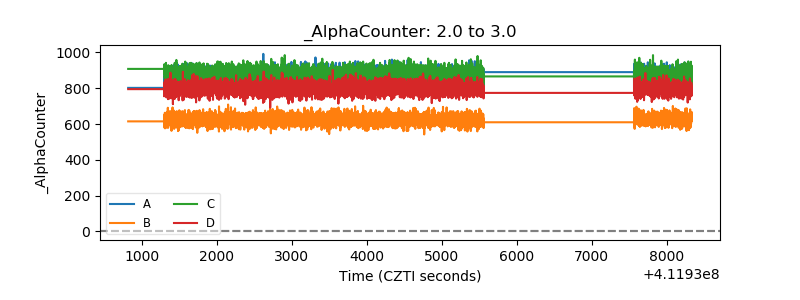 |
| _CPM_Rate | 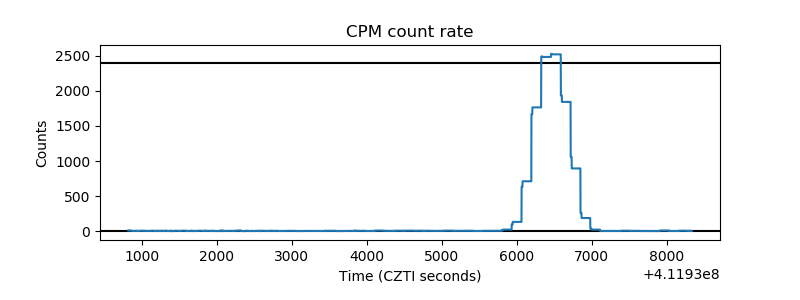 |
| CZT Counter | 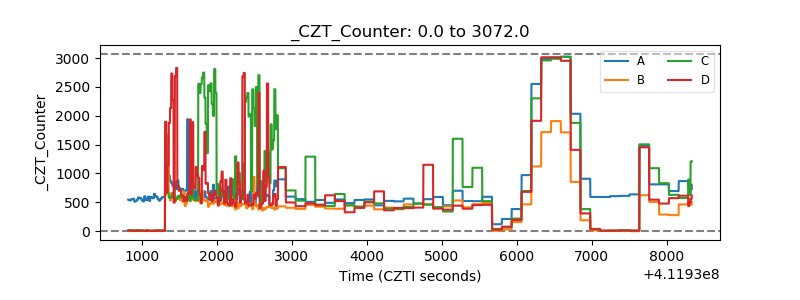 |
| +2.5 Volts monitor | 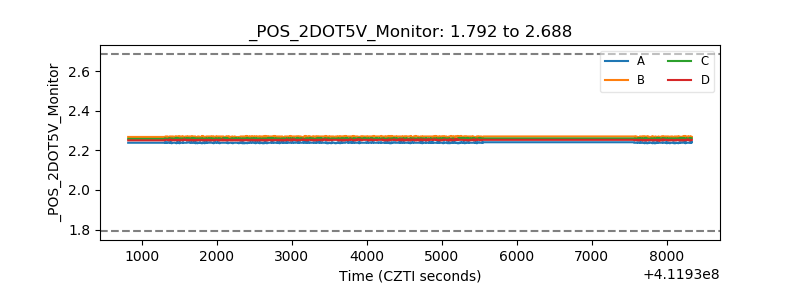 |
| +5 Volts monitor | 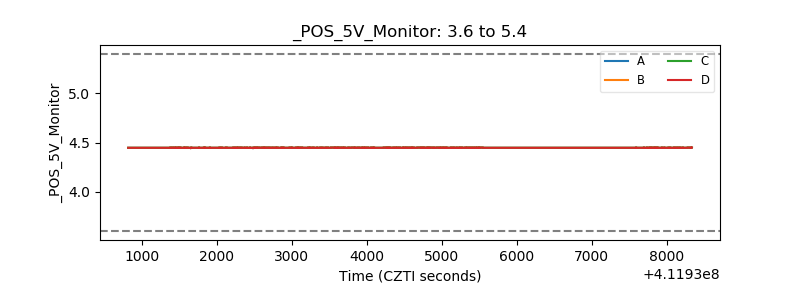 |
| _ROLL_ROT | 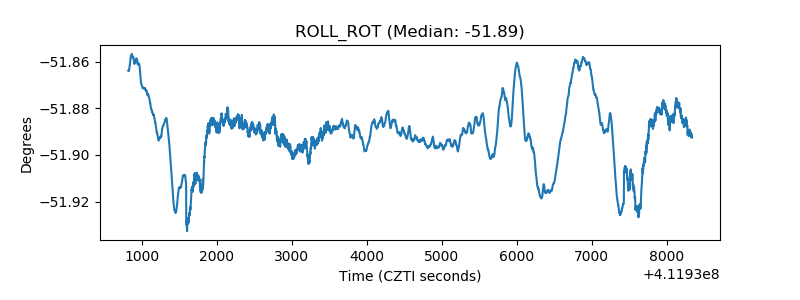 |
| _Roll_DEC | 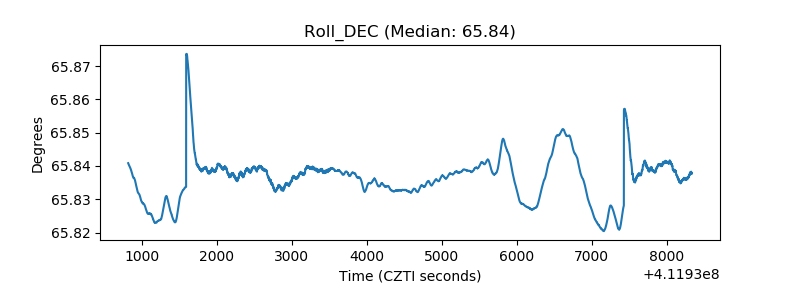 |
| _Roll_RA | 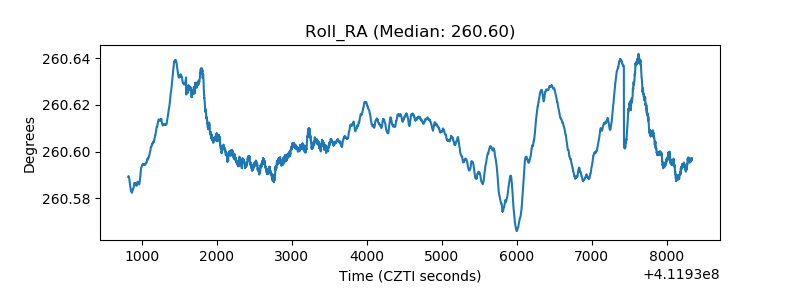 |
| Veto Counter | 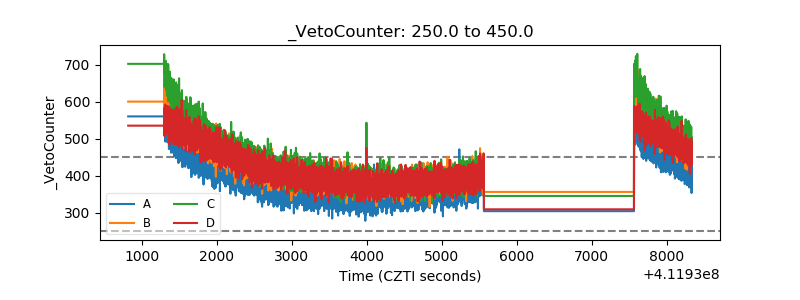 |