| Param | Original file | Final file |
|---|---|---|
| Filename | modeM0/AS1A12_018T01_9000005488_39548cztM0_level2.fits | modeM0/AS1A12_018T01_9000005488_39548cztM0_level2_quad_clean.evt |
| Size (bytes) | 361,558,080 | 89,991,360 |
| Size | 344.8 MB | 85.8 MB |
| Events in quadrant A | 3,158,001 | 607,313 |
| Events in quadrant B | 2,295,165 | 637,891 |
| Events in quadrant C | 4,198,106 | 585,340 |
| Events in quadrant D | 3,350,715 | 550,480 |
| Mode SS | |||
|---|---|---|---|
| Quadrant | BADHDUFLAG | Total packets | Discarded packets |
| A | 0 | 100 | 0 |
| B | 0 | 100 | 0 |
| C | 0 | 100 | 0 |
| D | 0 | 100 | 0 |
| Mode M0 | |||
|---|---|---|---|
| Quadrant | BADHDUFLAG | Total packets | Discarded packets |
| A | 0 | 12543 | 3 |
| B | 0 | 10078 | 2 |
| C | 0 | 15793 | 2 |
| D | 0 | 13359 | 2 |
| Mode M9 | |||
|---|---|---|---|
| Quadrant | BADHDUFLAG | Total packets | Discarded packets |
| A | 0 | 31 | 0 |
| B | 0 | 31 | 0 |
| C | 0 | 31 | 0 |
| D | 0 | 32 | 0 |
| Quadrant | Total seconds | Saturated seconds | Saturation percentage |
|---|---|---|---|
| A | 4905 | 87 | 1.773700% |
| B | 4905 | 17 | 0.346585% |
| C | 4905 | 349 | 7.115189% |
| D | 4905 | 204 | 4.159021% |
Noise dominated data is calculated using 1-second bins in cleaned event files. If a bin has >2000 counts, and if more than 50% of those come from <1% of pixels, then it is considered to be noise-dominated and hence unusable.
| Quadrant | # 1 sec bins | Bins with >0 counts | Bins with >2000 counts | High rate bins dominated by noise | Noise dominated (total time) | Noise dominated (detector-on time) | Marked lightcurve |
|---|---|---|---|---|---|---|---|
| A | 6999 | 4906 | 70 | 70 | 1.00% | 1.43% | 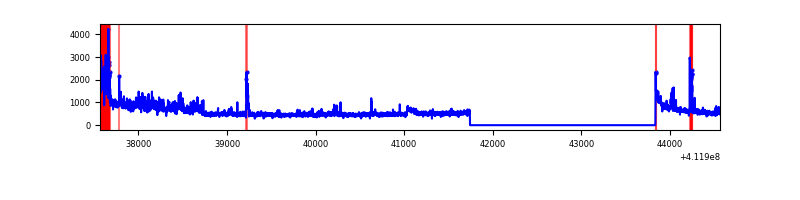 |
| B | 6999 | 4906 | 9 | 9 | 0.13% | 0.18% | 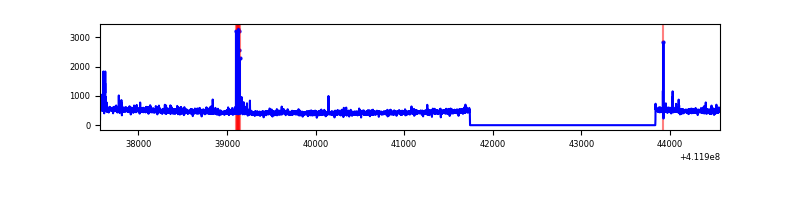 |
| C | 6999 | 4906 | 339 | 339 | 4.84% | 6.91% | 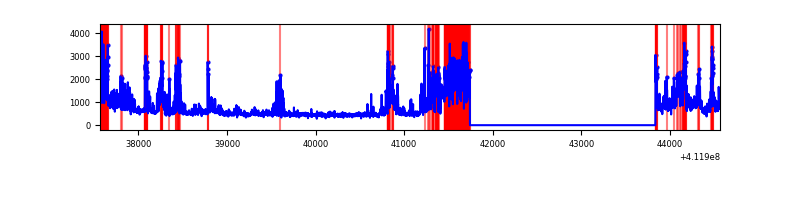 |
| D | 6999 | 4906 | 175 | 175 | 2.50% | 3.57% | 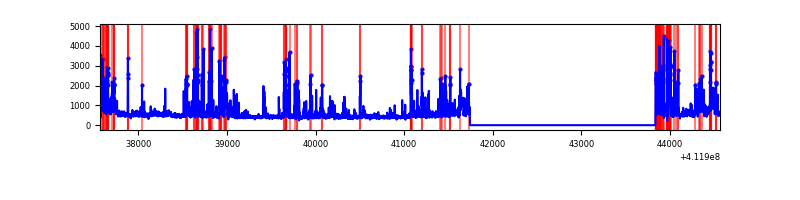 |
Top three noisy pixels from each quadrant. If the there are fewer than three noisy pixels in the level2.evt file, extra rows are filled as -1
| Pixel properties | Quadrant properties | ||||||
|---|---|---|---|---|---|---|---|
| Quadrant | DetID | PixID | Counts | Sigma | Mean | Median | Sigma |
| A | 15 | 222 | 512174 | 4548.2 | 555 | 544 | 112.5 |
| A | 10 | 83 | 407180 | 3614.84 | 555 | 544 | 112.5 |
| A | 13 | 248 | 38040 | 333.33 | 555 | 544 | 112.5 |
| B | 5 | 255 | 70916 | 663.2 | 561 | 546 | 106.1 |
| B | 12 | 111 | 12785 | 115.35 | 561 | 546 | 106.1 |
| B | 11 | 111 | 11587 | 104.06 | 561 | 546 | 106.1 |
| C | 9 | 187 | 1695348 | 13488.62 | 547 | 553 | 125.6 |
| C | 15 | 214 | 204759 | 1625.25 | 547 | 553 | 125.6 |
| C | 15 | 208 | 116220 | 920.58 | 547 | 553 | 125.6 |
| D | 12 | 227 | 587047 | 4478.33 | 542 | 527 | 131.0 |
| D | 12 | 0 | 251960 | 1919.8 | 542 | 527 | 131.0 |
| D | 7 | 38 | 131998 | 1003.84 | 542 | 527 | 131.0 |
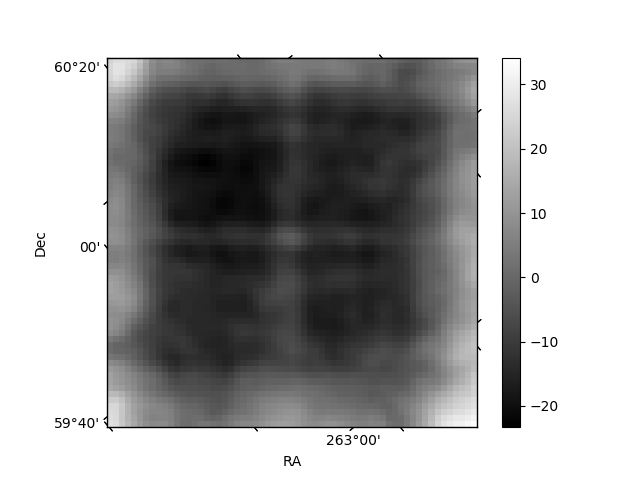
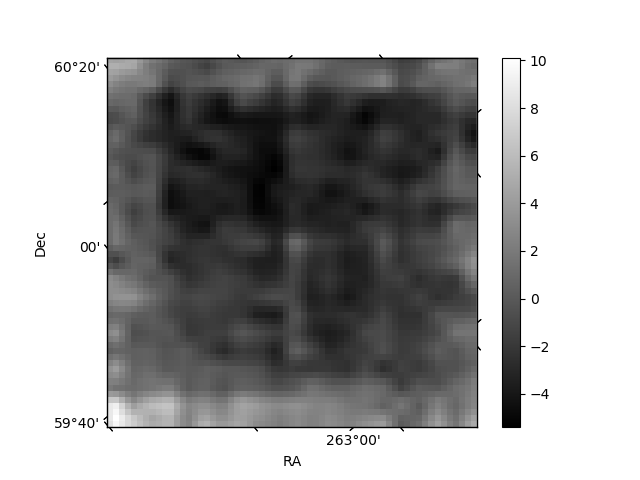
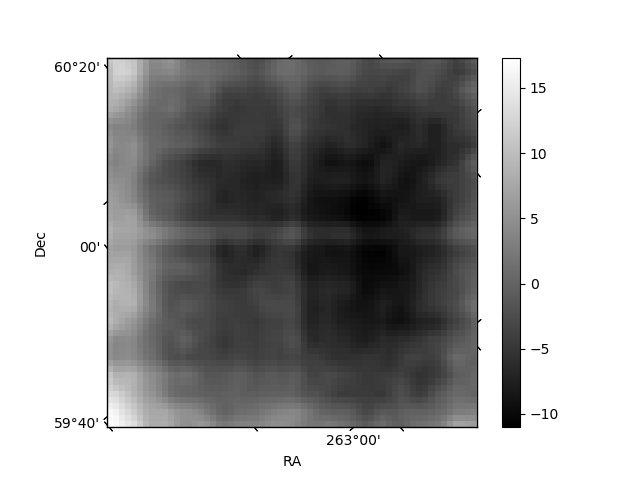
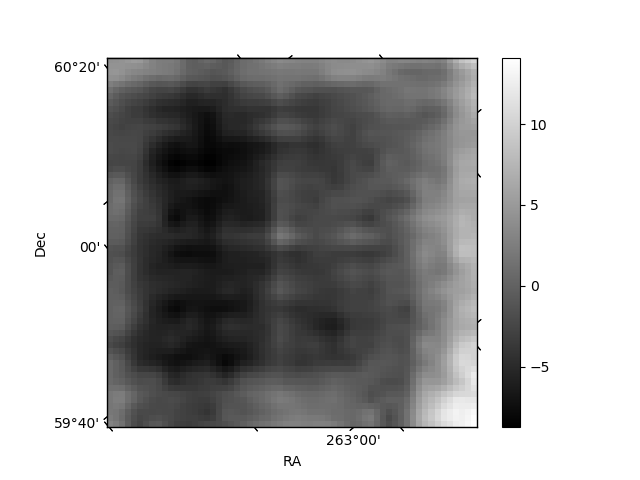
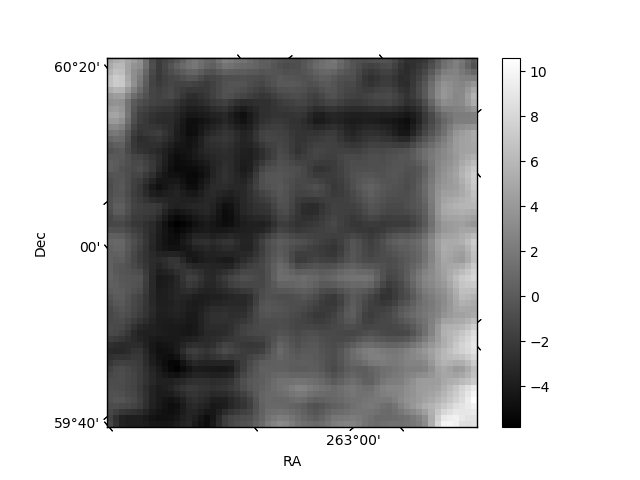
Histogram calculated using DETX and DETY for each event in the final _common_clean file
| Quadrant A | 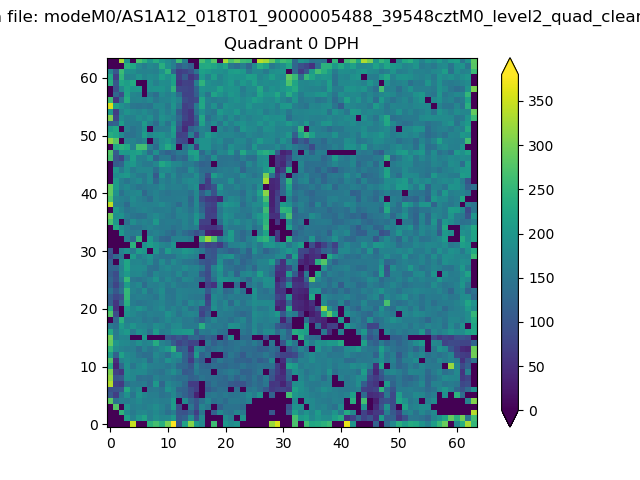 |
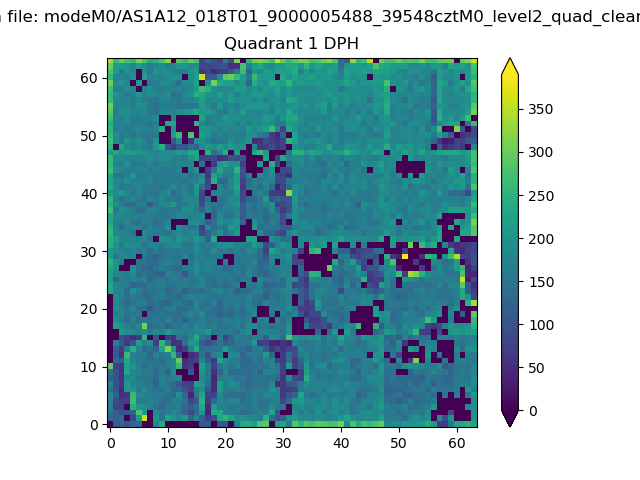 |
Quadrant B |
|---|---|---|---|
| Quadrant D | 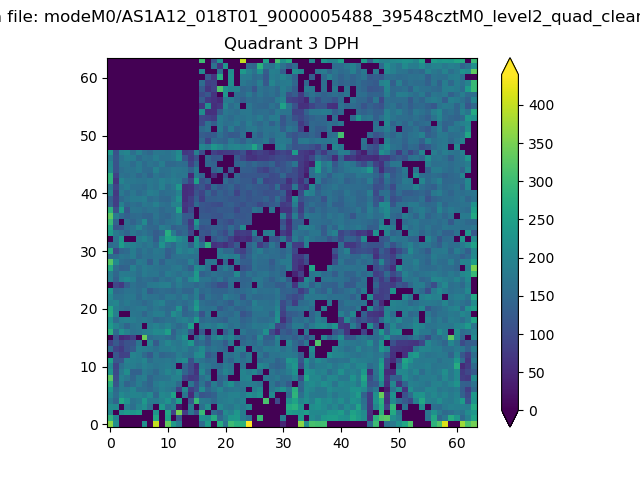 |
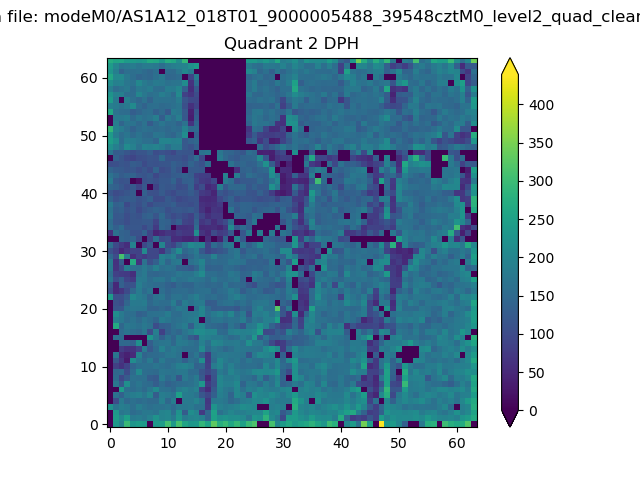 |
Quadrant C |
| Plot type | Count rate plots | Images |
|---|---|---|
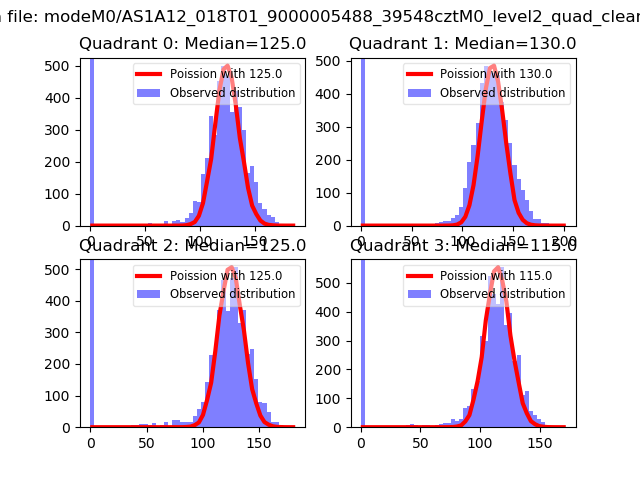
| Comparison with Poisson distribution Blue bars denote a histogram of data divided into 1 sec bins. Red curve is a Poisson curve with rate = median count rate of data. |
 |
 |
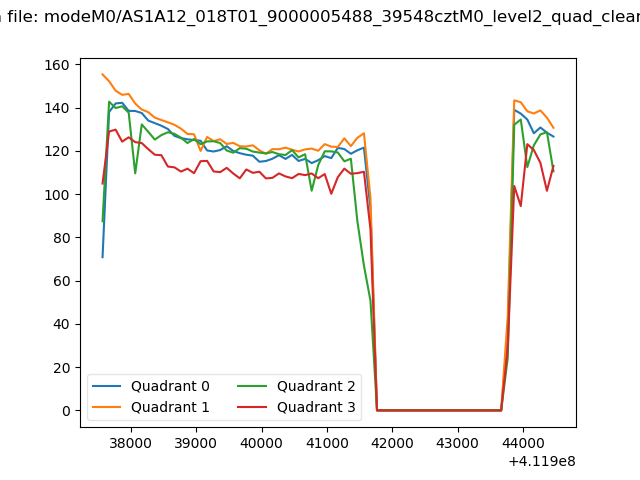
| Quadrant-wise count rates Data is divided into 100 sec bins |
 |
|
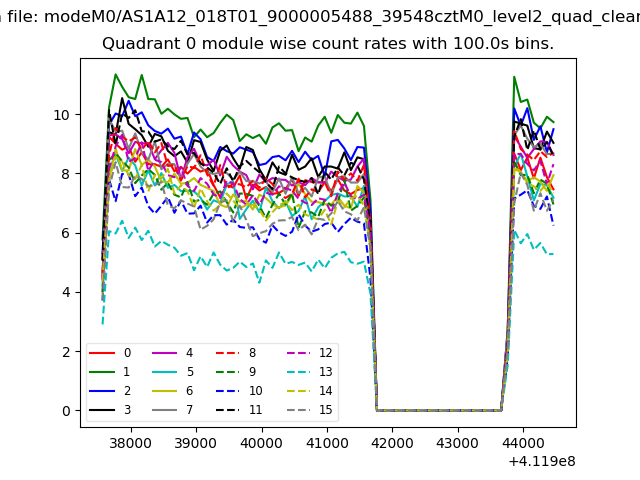
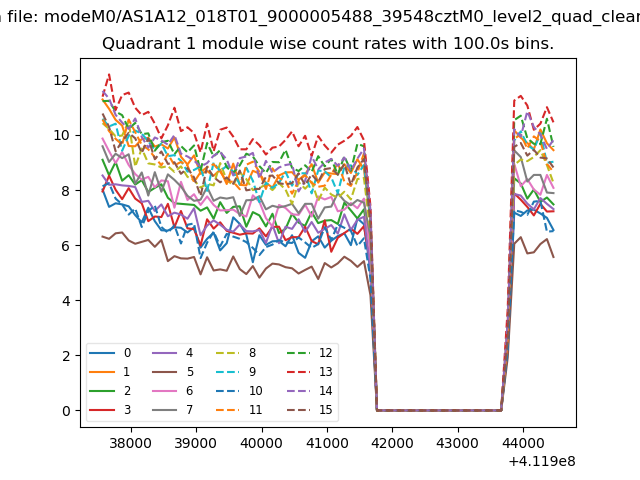
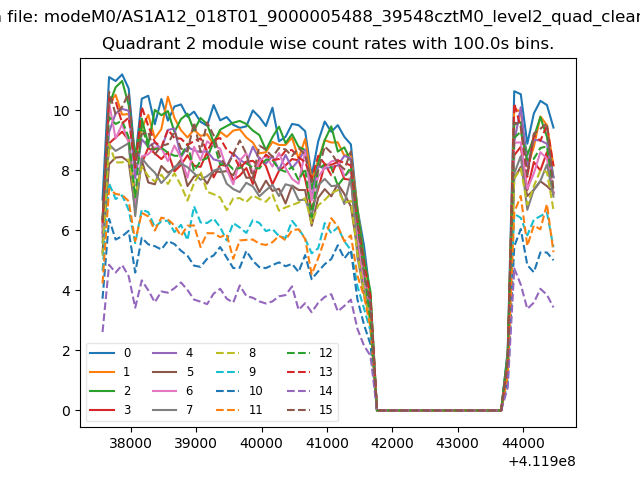
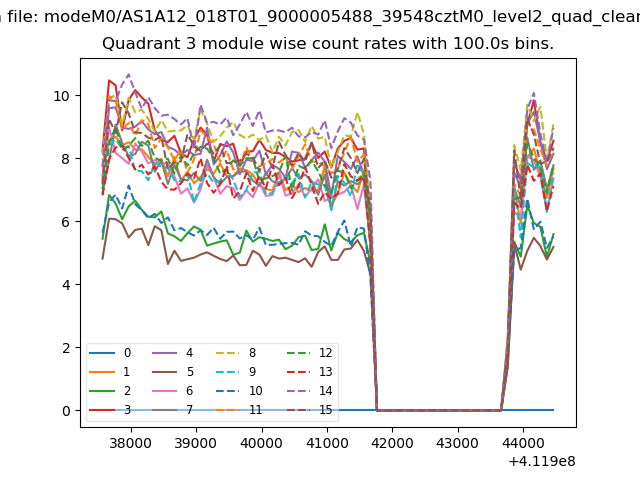
| Module-wise count rates for Quadrant A Data is divided into 100 sec bins |
 |
 |
| Module-wise count rates for Quadrant B Data is divided into 100 sec bins |
 |
 |
| Module-wise count rates for Quadrant C Data is divided into 100 sec bins |
 |
 |
| Module-wise count rates for Quadrant D Data is divided into 100 sec bins |
 |
 |
| Parameter | Plot |
|---|---|
| CZT HV Monitor |  |
| D_VDD | 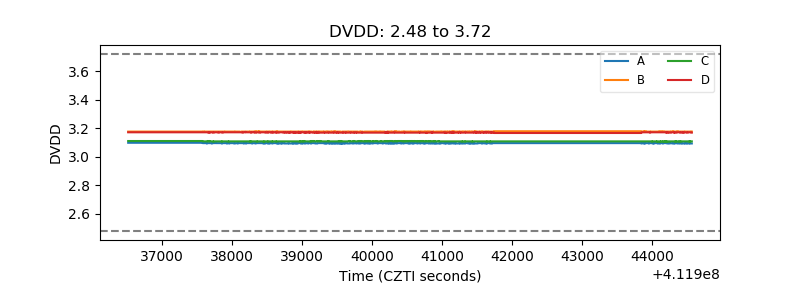 |
| Temperature 1 | 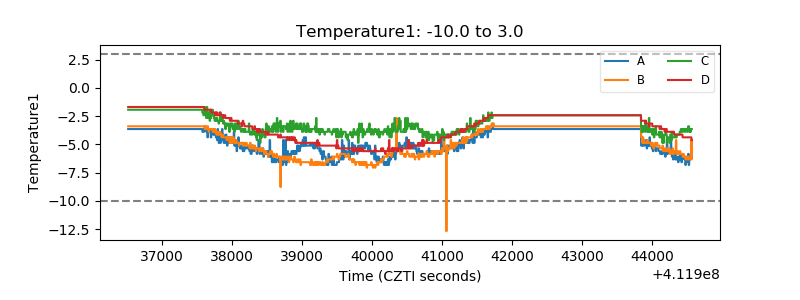 |
| Veto HV Monitor | 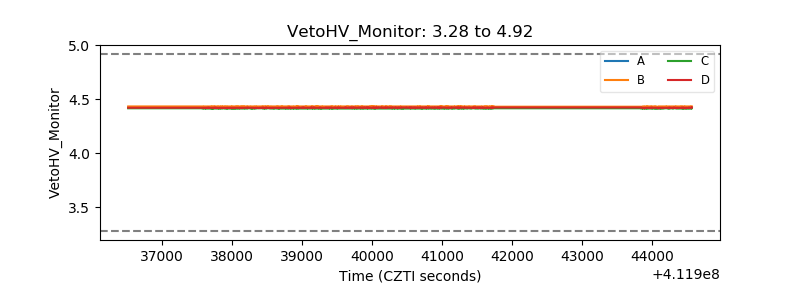 |
| Veto LLD | 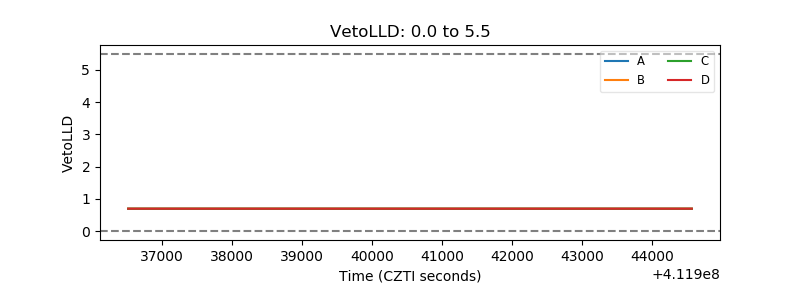 |
| Alpha Counter | 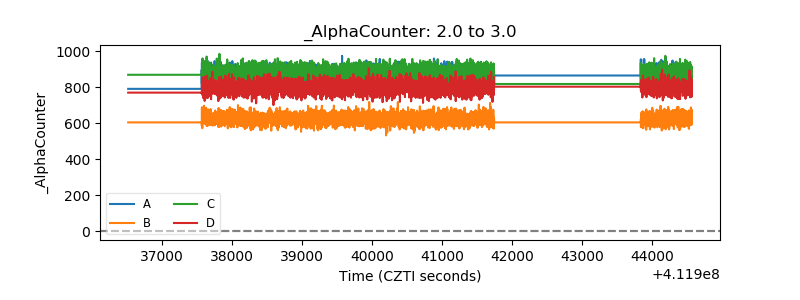 |
| _CPM_Rate |  |
| CZT Counter | 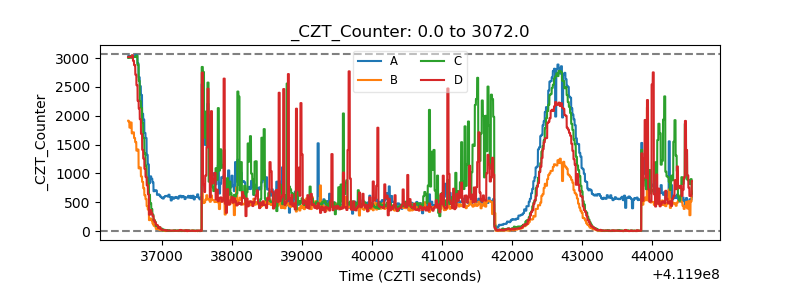 |
| +2.5 Volts monitor | 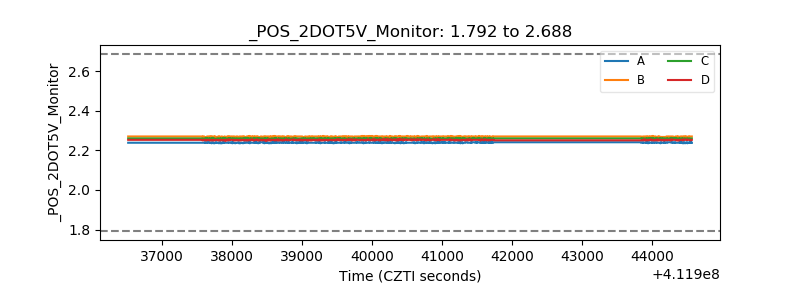 |
| +5 Volts monitor | 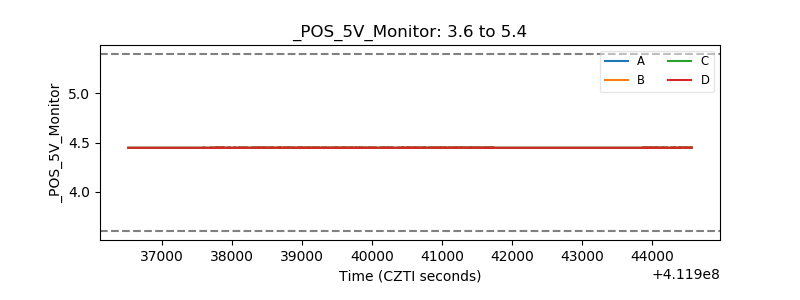 |
| _ROLL_ROT | 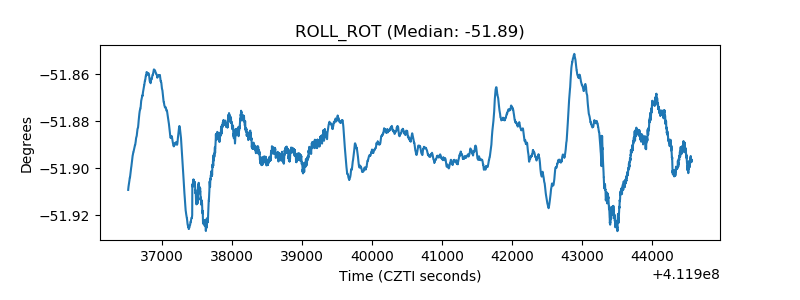 |
| _Roll_DEC | 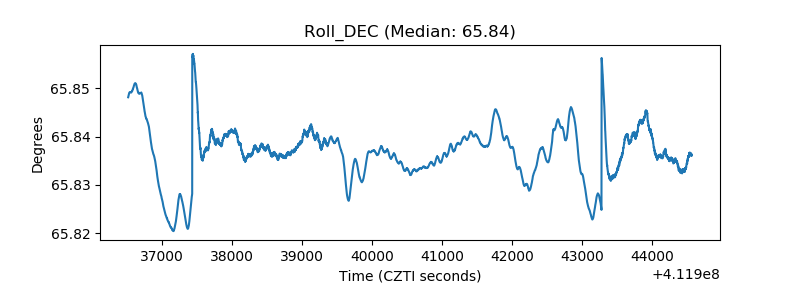 |
| _Roll_RA | 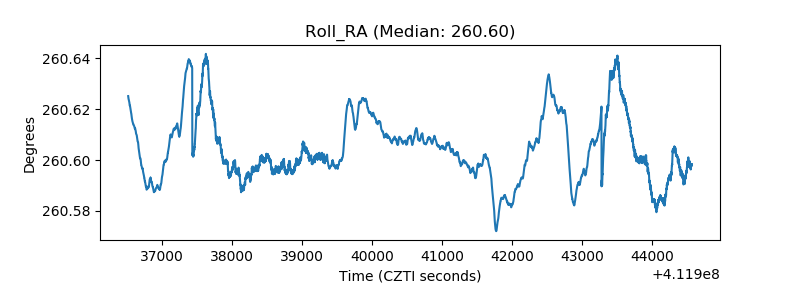 |
| Veto Counter | 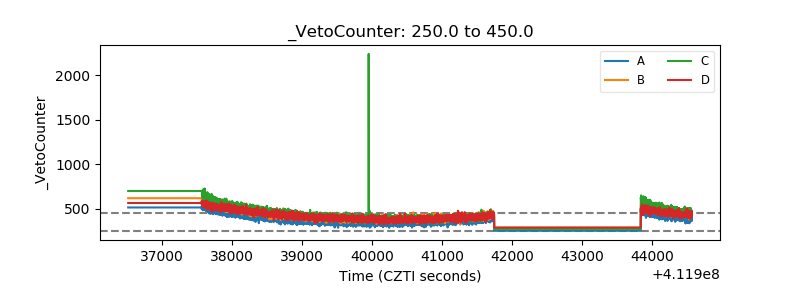 |