| Param | Original file | Final file |
|---|---|---|
| Filename | modeM0/AS1A12_018T01_9000005488_39549cztM0_level2.fits | modeM0/AS1A12_018T01_9000005488_39549cztM0_level2_quad_clean.evt |
| Size (bytes) | 440,542,080 | 83,223,360 |
| Size | 420.1 MB | 79.4 MB |
| Events in quadrant A | 3,640,004 | 579,921 |
| Events in quadrant B | 2,197,606 | 608,630 |
| Events in quadrant C | 3,555,924 | 571,745 |
| Events in quadrant D | 6,535,643 | 418,046 |
| Mode SS | |||
|---|---|---|---|
| Quadrant | BADHDUFLAG | Total packets | Discarded packets |
| A | 0 | 100 | 0 |
| B | 0 | 100 | 0 |
| C | 0 | 100 | 0 |
| D | 0 | 100 | 0 |
| Mode M0 | |||
|---|---|---|---|
| Quadrant | BADHDUFLAG | Total packets | Discarded packets |
| A | 0 | 14022 | 3 |
| B | 0 | 9952 | 2 |
| C | 0 | 13870 | 2 |
| D | 0 | 22751 | 2 |
| Mode M9 | |||
|---|---|---|---|
| Quadrant | BADHDUFLAG | Total packets | Discarded packets |
| A | 0 | 25 | 0 |
| B | 0 | 25 | 0 |
| C | 0 | 25 | 0 |
| D | 0 | 26 | 0 |
| Quadrant | Total seconds | Saturated seconds | Saturation percentage |
|---|---|---|---|
| A | 4868 | 79 | 1.622843% |
| B | 4868 | 12 | 0.246508% |
| C | 4868 | 160 | 3.286771% |
| D | 4868 | 1332 | 27.362366% |
Noise dominated data is calculated using 1-second bins in cleaned event files. If a bin has >2000 counts, and if more than 50% of those come from <1% of pixels, then it is considered to be noise-dominated and hence unusable.
| Quadrant | # 1 sec bins | Bins with >0 counts | Bins with >2000 counts | High rate bins dominated by noise | Noise dominated (total time) | Noise dominated (detector-on time) | Marked lightcurve |
|---|---|---|---|---|---|---|---|
| A | 6990 | 4869 | 93 | 93 | 1.33% | 1.91% | 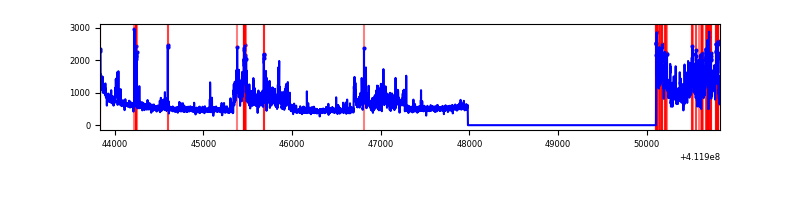 |
| B | 6990 | 4869 | 7 | 7 | 0.10% | 0.14% | 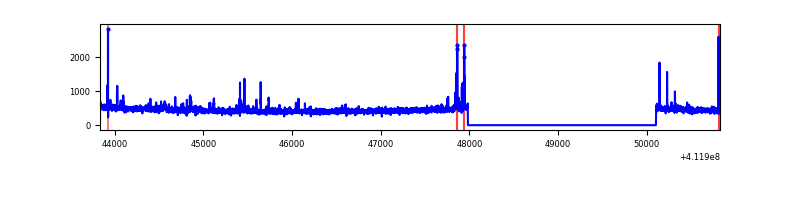 |
| C | 6990 | 4869 | 153 | 153 | 2.19% | 3.14% | 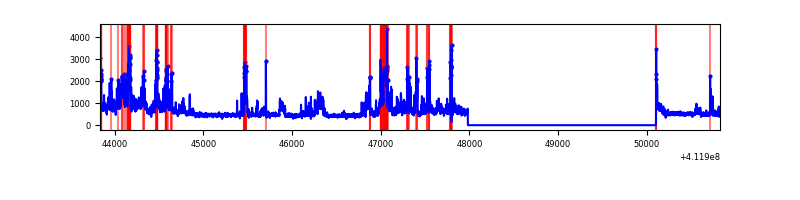 |
| D | 6990 | 4869 | 1324 | 1324 | 18.94% | 27.19% | 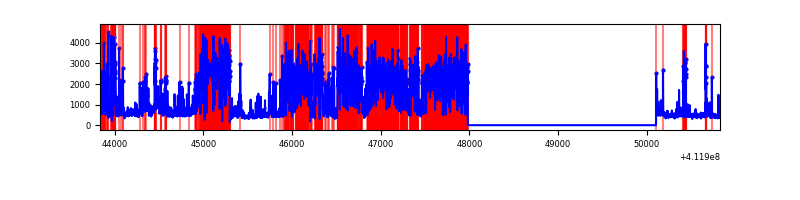 |
Top three noisy pixels from each quadrant. If the there are fewer than three noisy pixels in the level2.evt file, extra rows are filled as -1
| Pixel properties | Quadrant properties | ||||||
|---|---|---|---|---|---|---|---|
| Quadrant | DetID | PixID | Counts | Sigma | Mean | Median | Sigma |
| A | 15 | 222 | 1121470 | 10530.34 | 532 | 521 | 106.4 |
| A | 10 | 83 | 397345 | 3727.82 | 532 | 521 | 106.4 |
| A | 2 | 79 | 38584 | 357.57 | 532 | 521 | 106.4 |
| B | 5 | 255 | 79725 | 780.13 | 537 | 522 | 101.5 |
| B | 12 | 111 | 12518 | 118.16 | 537 | 522 | 101.5 |
| B | 11 | 111 | 11460 | 107.74 | 537 | 522 | 101.5 |
| C | 9 | 187 | 972905 | 8024.75 | 525 | 529 | 121.2 |
| C | 15 | 208 | 288482 | 2376.4 | 525 | 529 | 121.2 |
| C | 15 | 214 | 205816 | 1694.18 | 525 | 529 | 121.2 |
| D | 14 | 34 | 2978558 | 25712.39 | 472 | 457 | 115.8 |
| D | 7 | 38 | 983635 | 8488.58 | 472 | 457 | 115.8 |
| D | 12 | 227 | 322178 | 2777.68 | 472 | 457 | 115.8 |
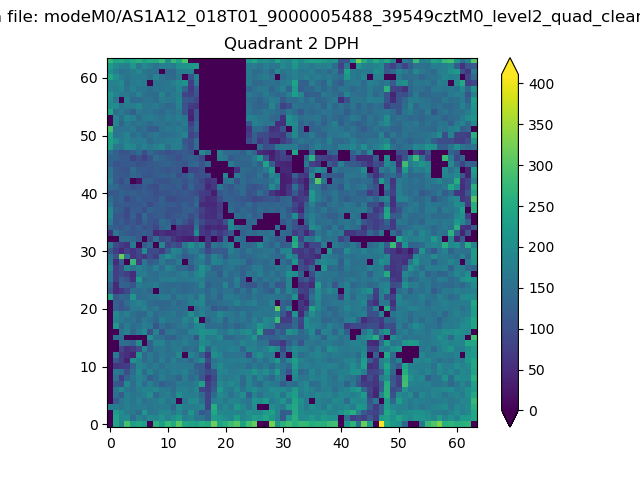
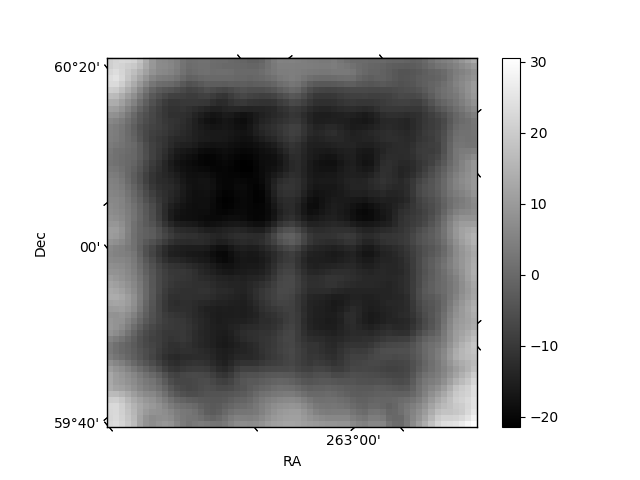
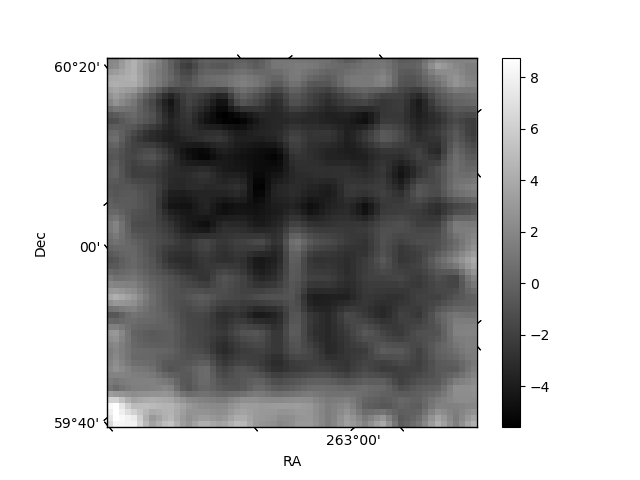
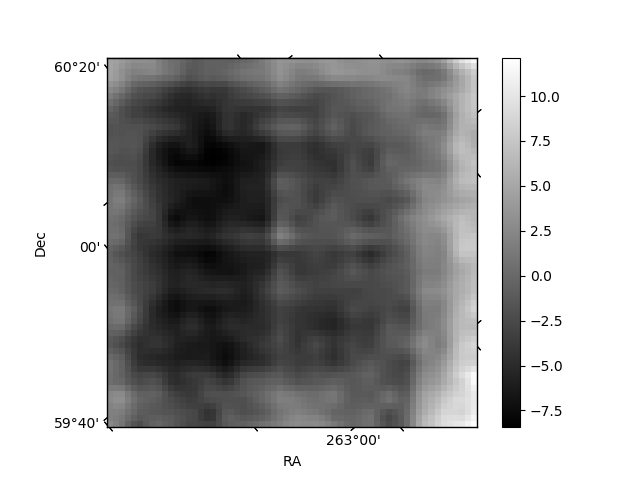
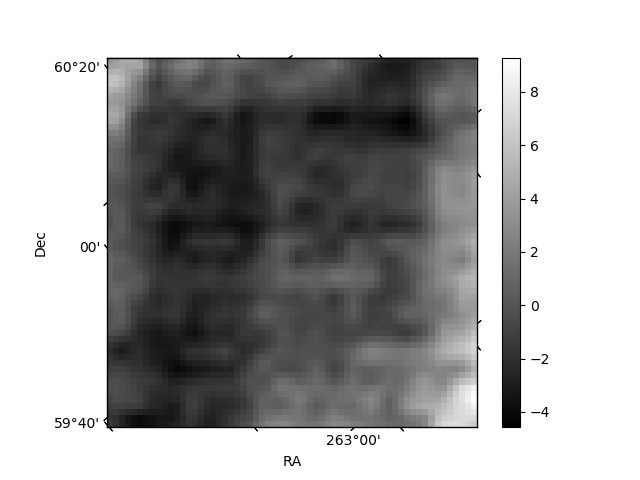
Histogram calculated using DETX and DETY for each event in the final _common_clean file
| Quadrant A | 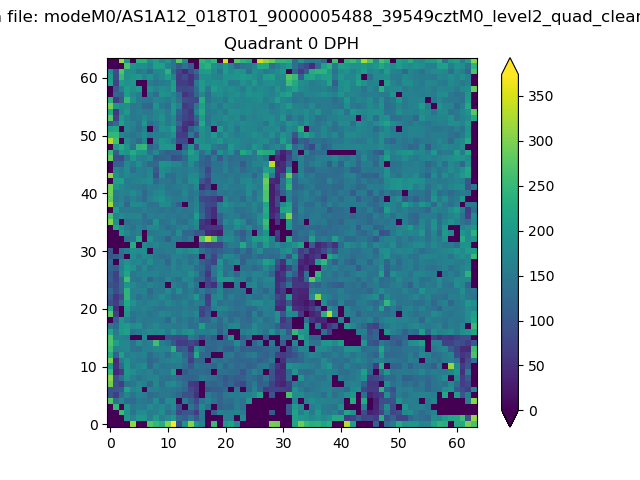 |
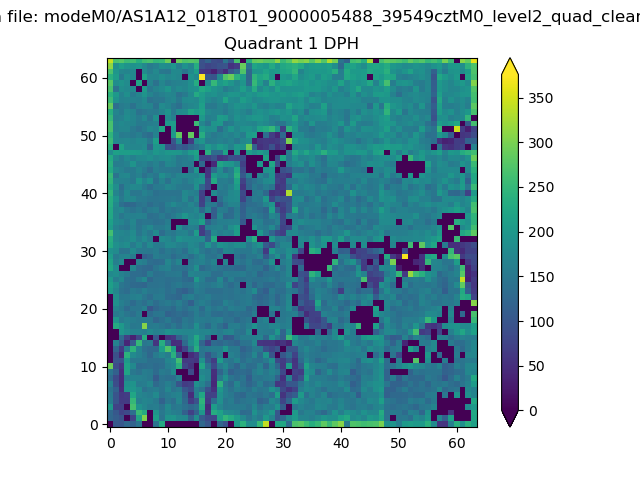 |
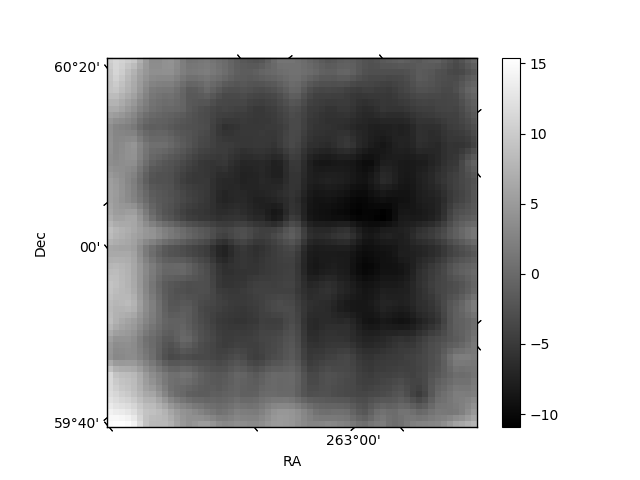
Quadrant B |
|---|---|---|---|
| Quadrant D | 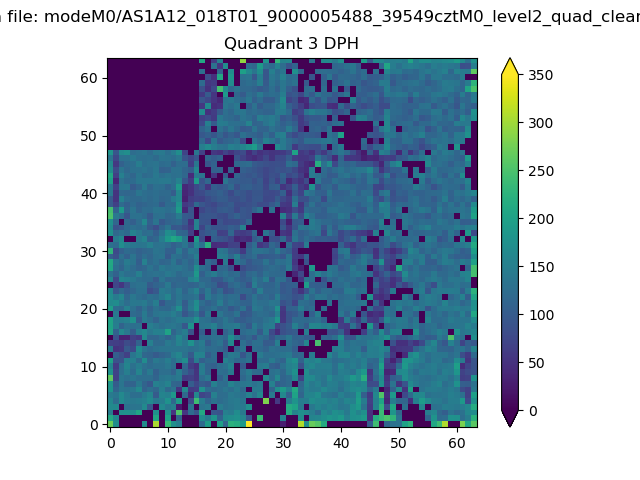 |
 |
Quadrant C |
| Plot type | Count rate plots | Images |
|---|---|---|
| Comparison with Poisson distribution Blue bars denote a histogram of data divided into 1 sec bins. Red curve is a Poisson curve with rate = median count rate of data. |
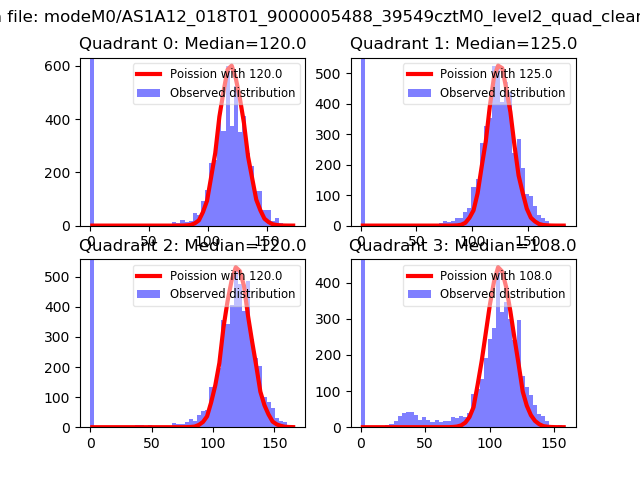 |
 |
| Quadrant-wise count rates Data is divided into 100 sec bins |
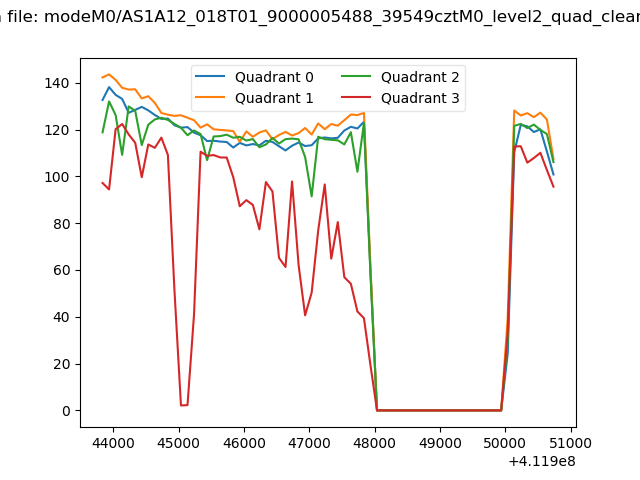 |
|
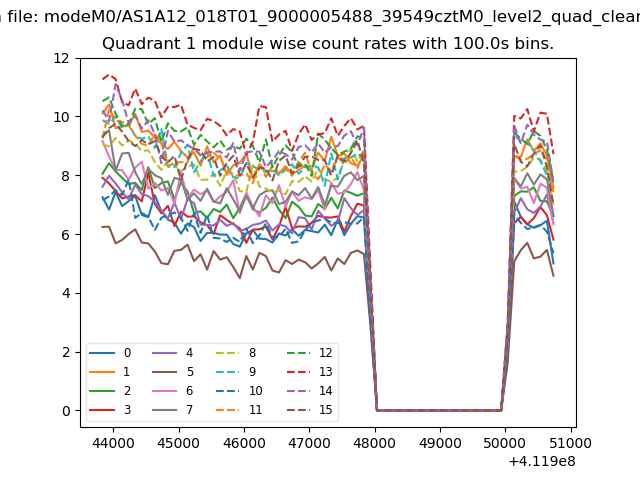
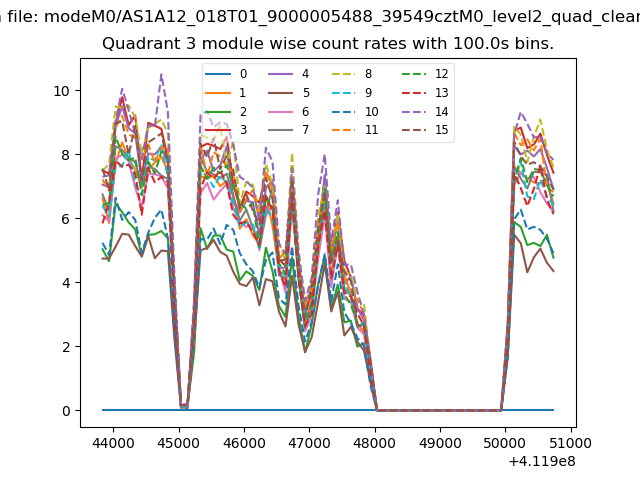
| Module-wise count rates for Quadrant A Data is divided into 100 sec bins |
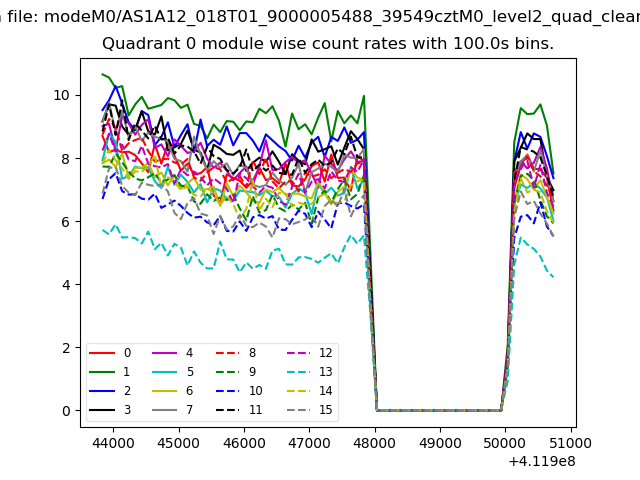 |
 |
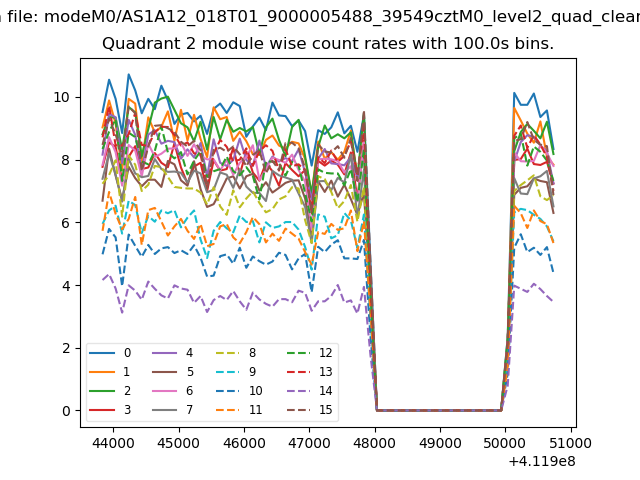
| Module-wise count rates for Quadrant B Data is divided into 100 sec bins |
 |
 |
| Module-wise count rates for Quadrant C Data is divided into 100 sec bins |
 |
 |
| Module-wise count rates for Quadrant D Data is divided into 100 sec bins |
 |
 |
| Parameter | Plot |
|---|---|
| CZT HV Monitor | 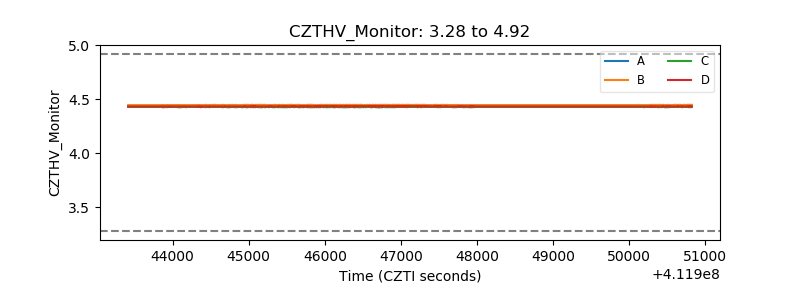 |
| D_VDD | 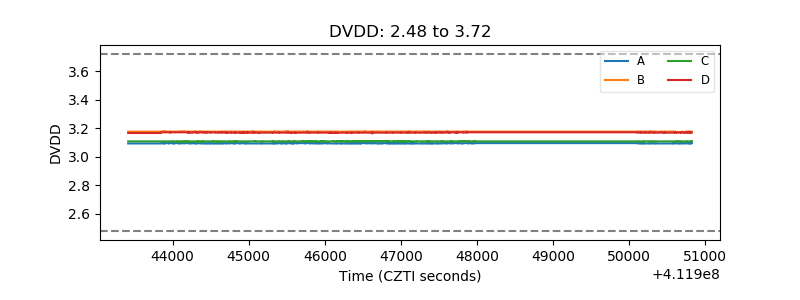 |
| Temperature 1 | 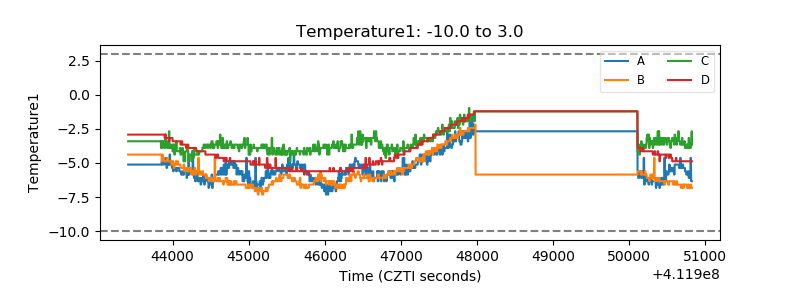 |
| Veto HV Monitor | 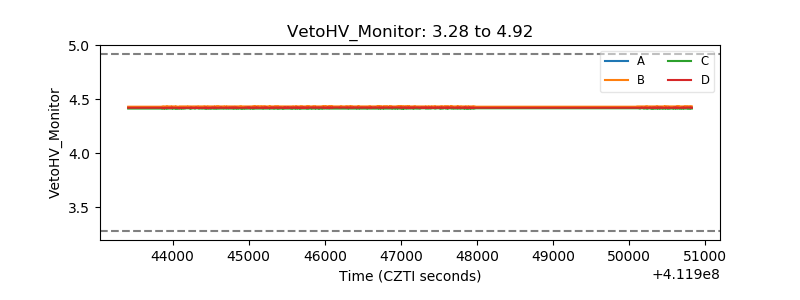 |
| Veto LLD | 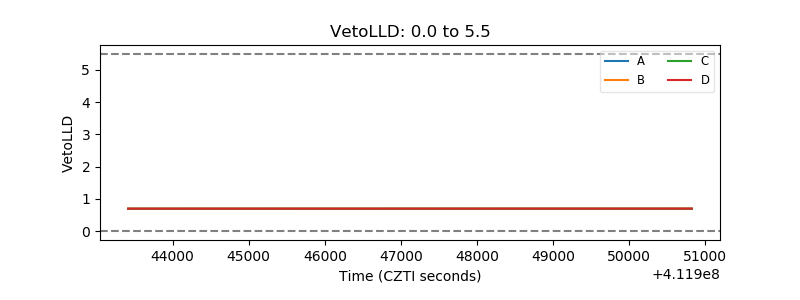 |
| Alpha Counter | 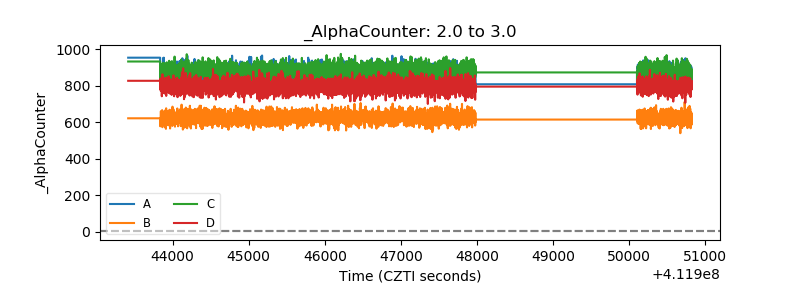 |
| _CPM_Rate | 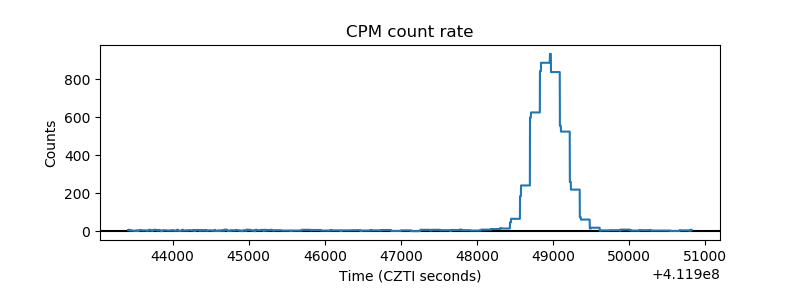 |
| CZT Counter | 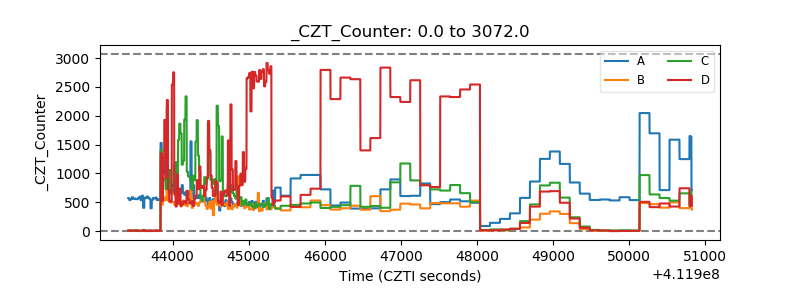 |
| +2.5 Volts monitor | 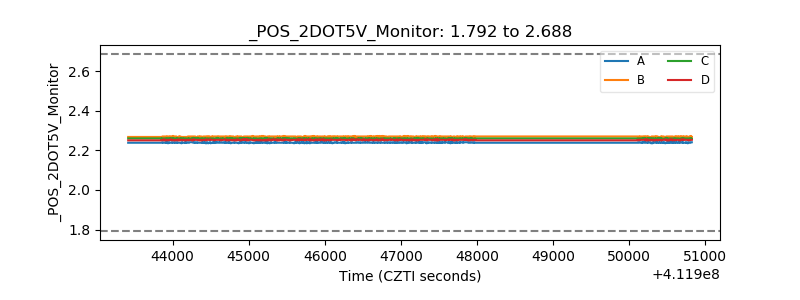 |
| +5 Volts monitor | 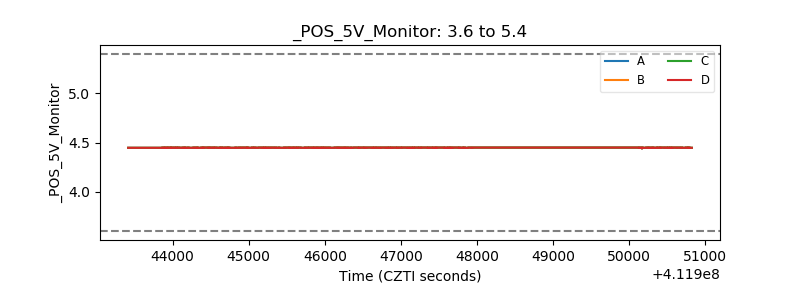 |
| _ROLL_ROT | 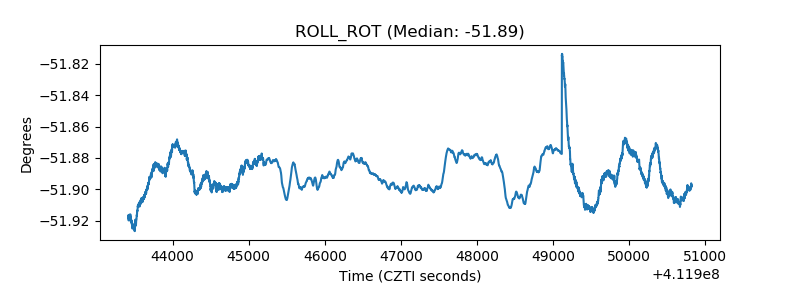 |
| _Roll_DEC | 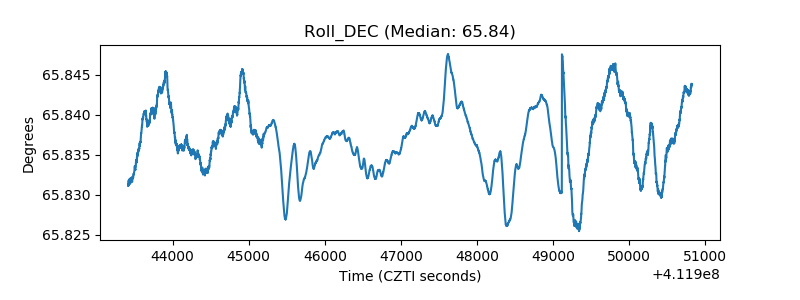 |
| _Roll_RA | 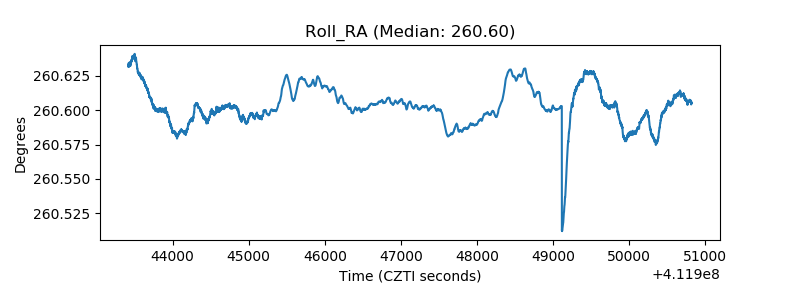 |
| Veto Counter | 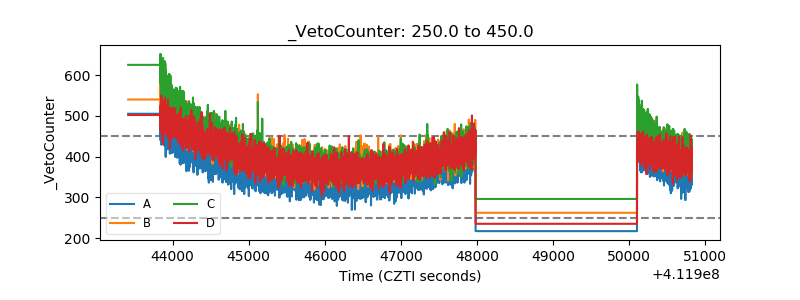 |