| Param | Original file | Final file |
|---|---|---|
| Filename | modeM0/AS1A12_018T01_9000005488_39550cztM0_level2.fits | modeM0/AS1A12_018T01_9000005488_39550cztM0_level2_quad_clean.evt |
| Size (bytes) | 391,835,520 | 87,802,560 |
| Size | 373.7 MB | 83.7 MB |
| Events in quadrant A | 4,356,926 | 581,442 |
| Events in quadrant B | 2,293,925 | 617,339 |
| Events in quadrant C | 3,919,976 | 571,485 |
| Events in quadrant D | 3,526,142 | 521,568 |
| Mode SS | |||
|---|---|---|---|
| Quadrant | BADHDUFLAG | Total packets | Discarded packets |
| A | 0 | 106 | 0 |
| B | 0 | 106 | 0 |
| C | 0 | 106 | 0 |
| D | 0 | 106 | 0 |
| Mode M0 | |||
|---|---|---|---|
| Quadrant | BADHDUFLAG | Total packets | Discarded packets |
| A | 0 | 16439 | 3 |
| B | 0 | 10722 | 2 |
| C | 0 | 15067 | 2 |
| D | 0 | 14385 | 2 |
| Mode M9 | |||
|---|---|---|---|
| Quadrant | BADHDUFLAG | Total packets | Discarded packets |
| A | 0 | 32 | 0 |
| B | 0 | 32 | 0 |
| C | 0 | 32 | 0 |
| D | 0 | 33 | 0 |
| Quadrant | Total seconds | Saturated seconds | Saturation percentage |
|---|---|---|---|
| A | 5239 | 213 | 4.065661% |
| B | 5239 | 16 | 0.305402% |
| C | 5239 | 257 | 4.905516% |
| D | 5239 | 314 | 5.993510% |
Noise dominated data is calculated using 1-second bins in cleaned event files. If a bin has >2000 counts, and if more than 50% of those come from <1% of pixels, then it is considered to be noise-dominated and hence unusable.
| Quadrant | # 1 sec bins | Bins with >0 counts | Bins with >2000 counts | High rate bins dominated by noise | Noise dominated (total time) | Noise dominated (detector-on time) | Marked lightcurve |
|---|---|---|---|---|---|---|---|
| A | 7302 | 5240 | 256 | 256 | 3.51% | 4.89% | 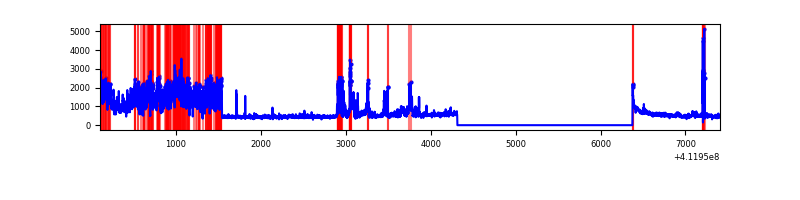 |
| B | 7302 | 5240 | 8 | 8 | 0.11% | 0.15% | 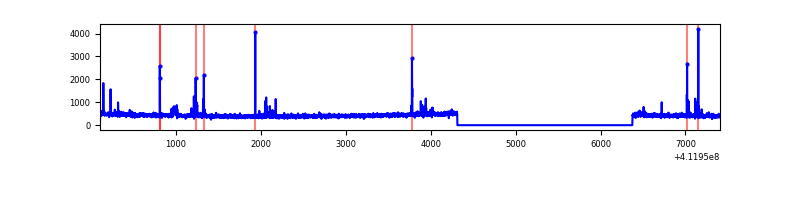 |
| C | 7302 | 5240 | 331 | 331 | 4.53% | 6.32% | 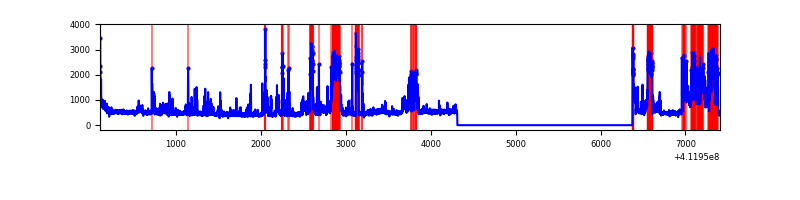 |
| D | 7302 | 5240 | 256 | 256 | 3.51% | 4.89% | 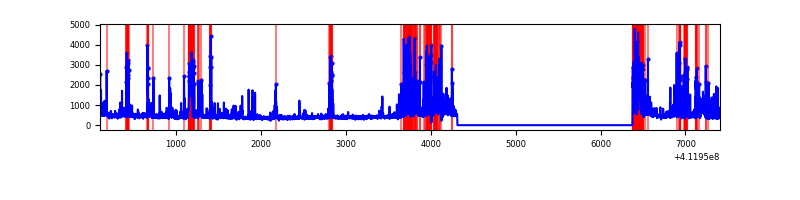 |
Top three noisy pixels from each quadrant. If the there are fewer than three noisy pixels in the level2.evt file, extra rows are filled as -1
| Pixel properties | Quadrant properties | ||||||
|---|---|---|---|---|---|---|---|
| Quadrant | DetID | PixID | Counts | Sigma | Mean | Median | Sigma |
| A | 15 | 222 | 1544783 | 13881.49 | 549 | 539 | 111.2 |
| A | 10 | 83 | 418291 | 3755.25 | 549 | 539 | 111.2 |
| A | 9 | 143 | 178874 | 1603.09 | 549 | 539 | 111.2 |
| B | 5 | 255 | 93577 | 879.18 | 554 | 539 | 105.8 |
| B | 12 | 111 | 13279 | 120.39 | 554 | 539 | 105.8 |
| B | 11 | 111 | 11975 | 108.07 | 554 | 539 | 105.8 |
| C | 9 | 187 | 1265807 | 10077.69 | 539 | 542 | 125.6 |
| C | 15 | 208 | 243480 | 1934.97 | 539 | 542 | 125.6 |
| C | 15 | 214 | 218346 | 1734.78 | 539 | 542 | 125.6 |
| D | 2 | 249 | 583217 | 4480.35 | 528 | 513 | 130.1 |
| D | 12 | 227 | 481513 | 3698.36 | 528 | 513 | 130.1 |
| D | 13 | 249 | 140856 | 1079.08 | 528 | 513 | 130.1 |
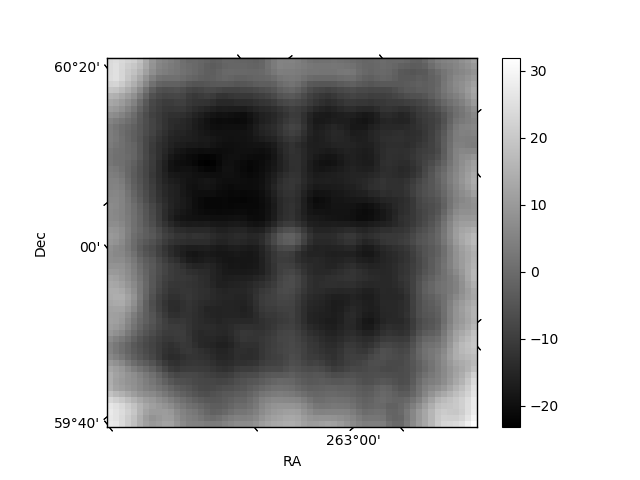
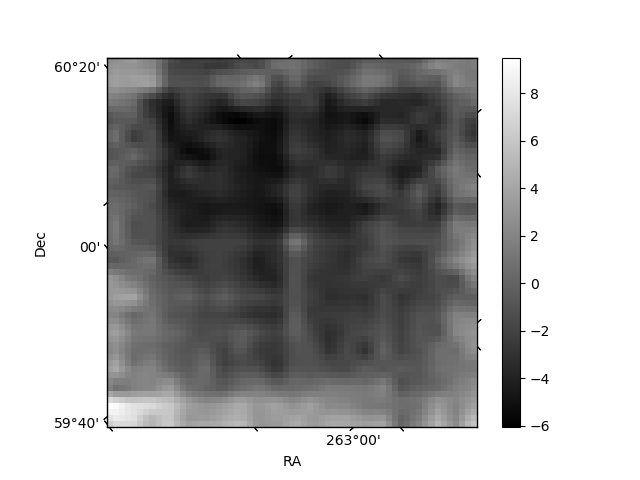
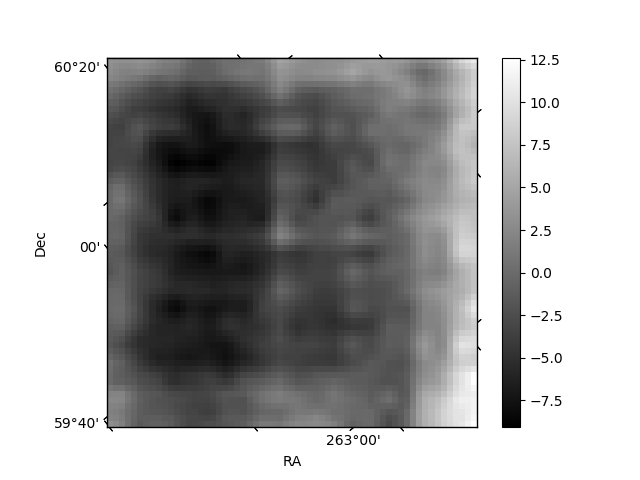
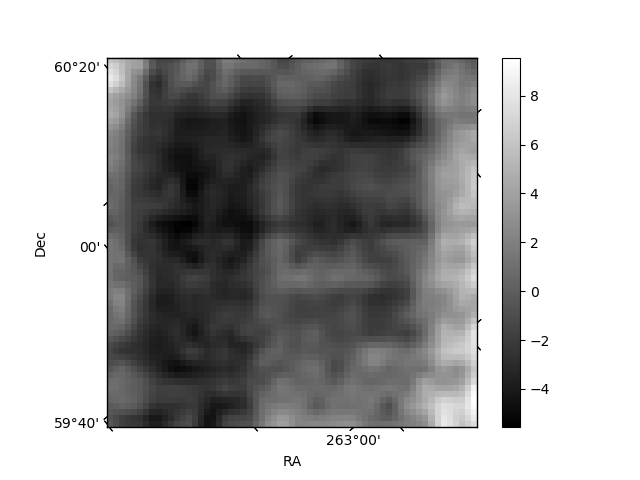
Histogram calculated using DETX and DETY for each event in the final _common_clean file
| Quadrant A | 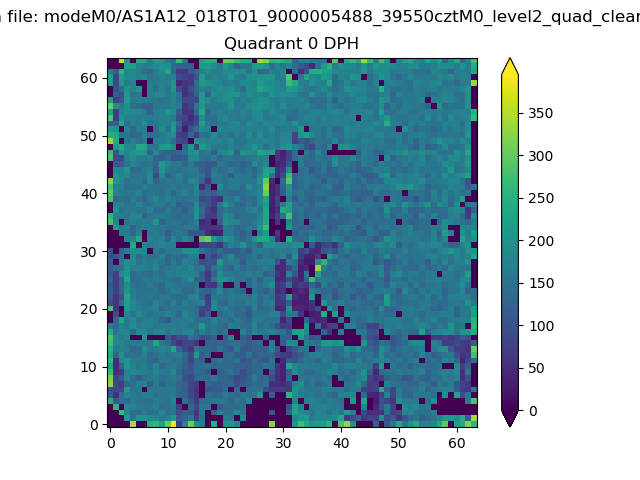 |
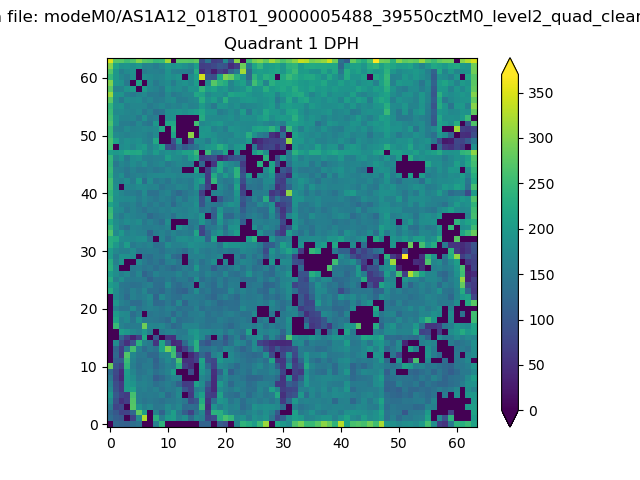 |
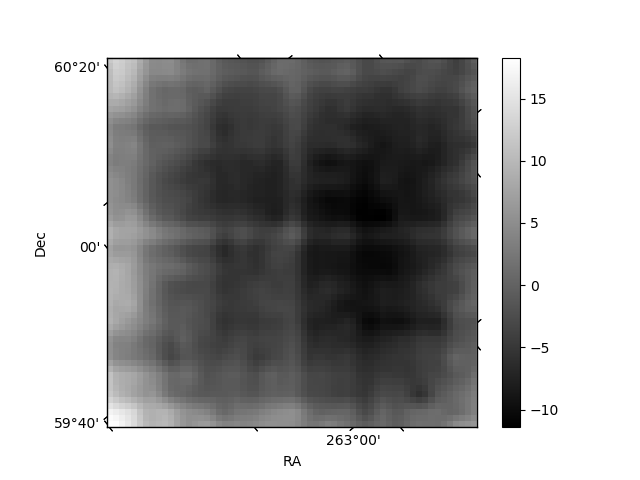
Quadrant B |
|---|---|---|---|
| Quadrant D | 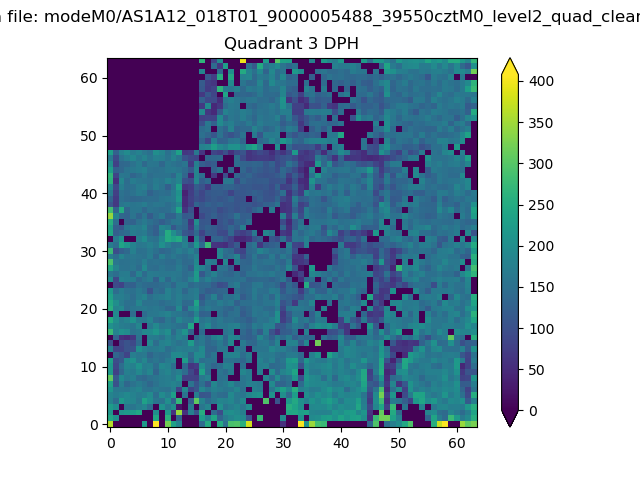 |
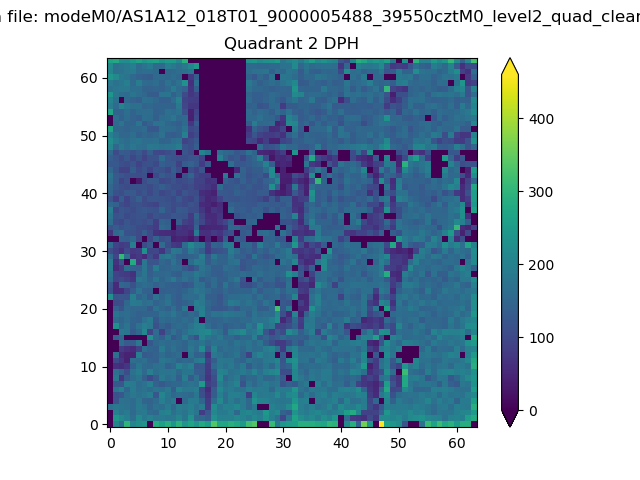 |
Quadrant C |
| Plot type | Count rate plots | Images |
|---|---|---|
| Comparison with Poisson distribution Blue bars denote a histogram of data divided into 1 sec bins. Red curve is a Poisson curve with rate = median count rate of data. |
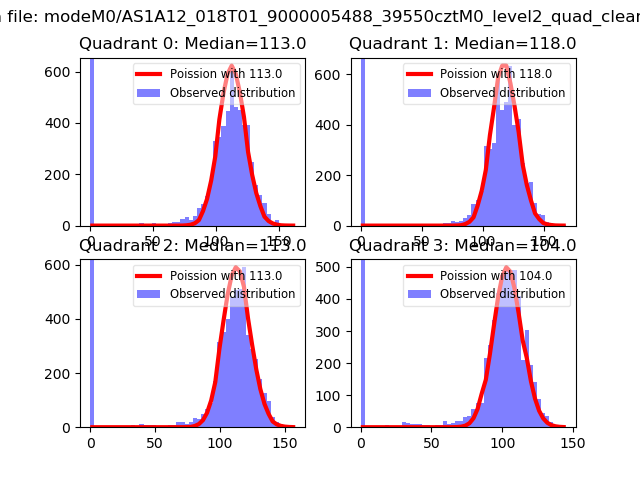 |
 |
| Quadrant-wise count rates Data is divided into 100 sec bins |
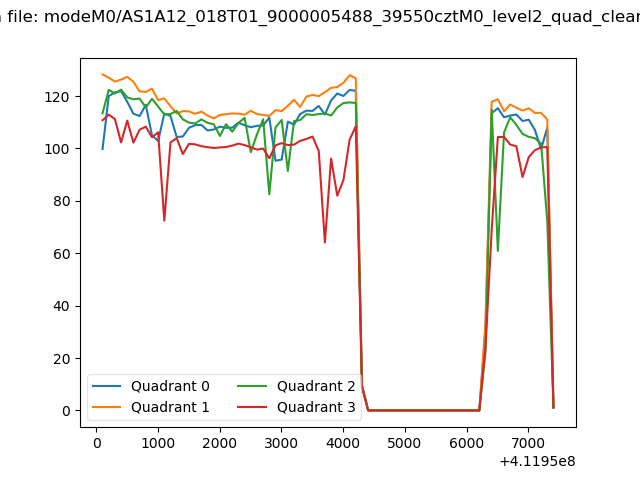 |
|
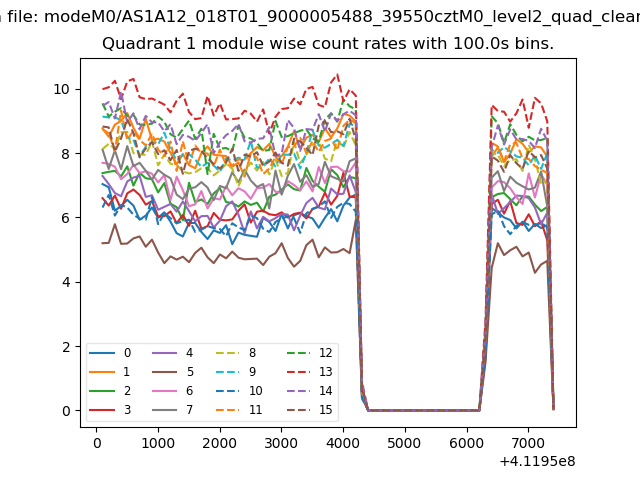
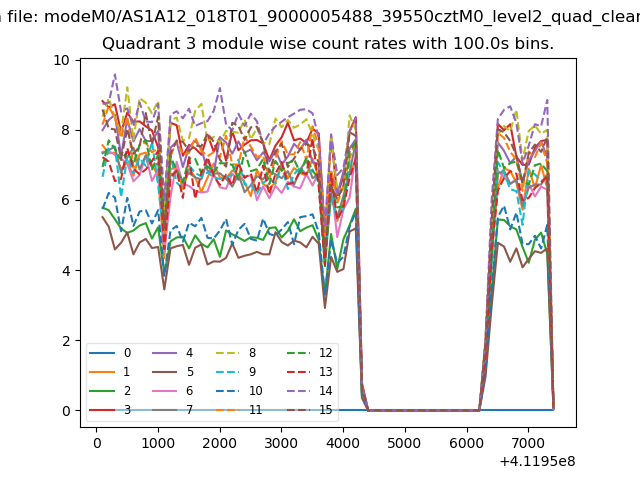
| Module-wise count rates for Quadrant A Data is divided into 100 sec bins |
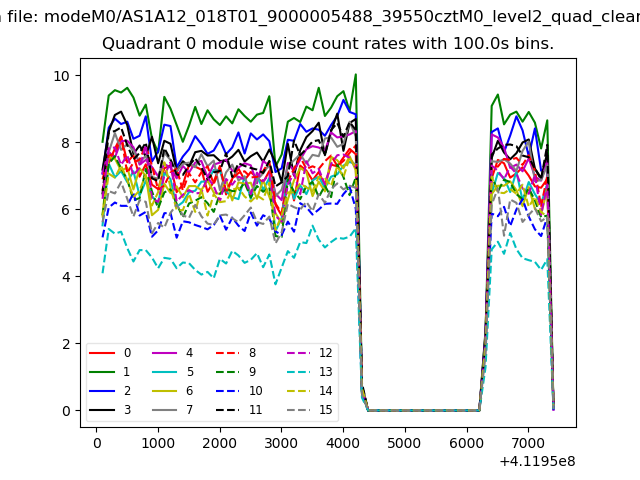 |
 |
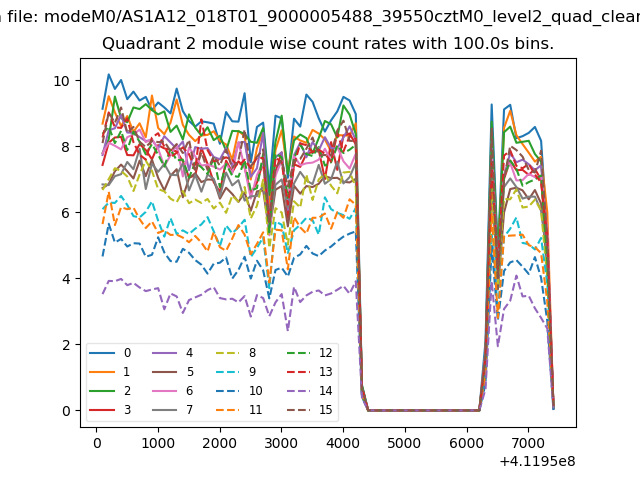
| Module-wise count rates for Quadrant B Data is divided into 100 sec bins |
 |
 |
| Module-wise count rates for Quadrant C Data is divided into 100 sec bins |
 |
 |
| Module-wise count rates for Quadrant D Data is divided into 100 sec bins |
 |
 |
| Parameter | Plot |
|---|---|
| CZT HV Monitor | 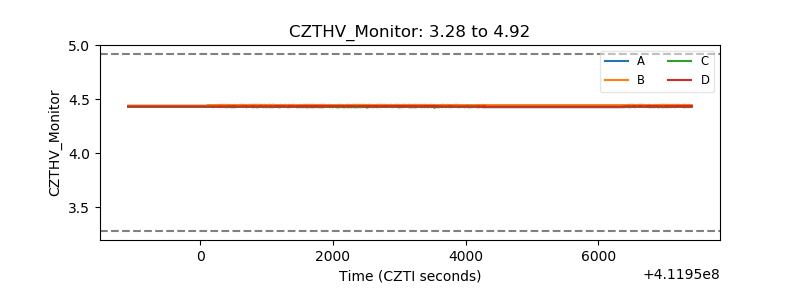 |
| D_VDD | 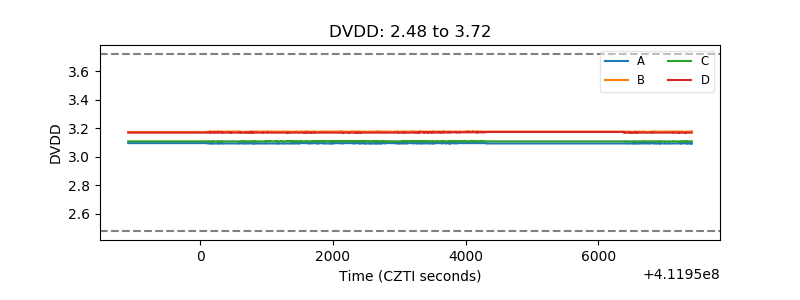 |
| Temperature 1 | 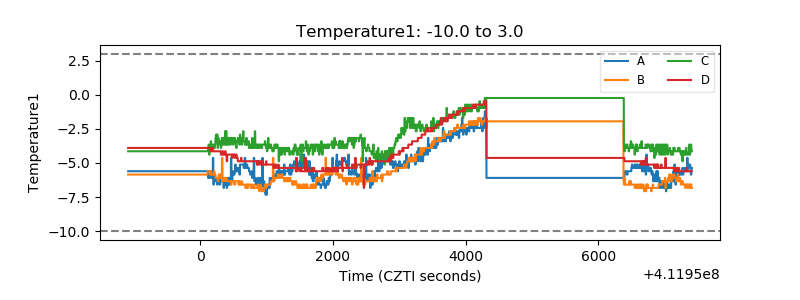 |
| Veto HV Monitor | 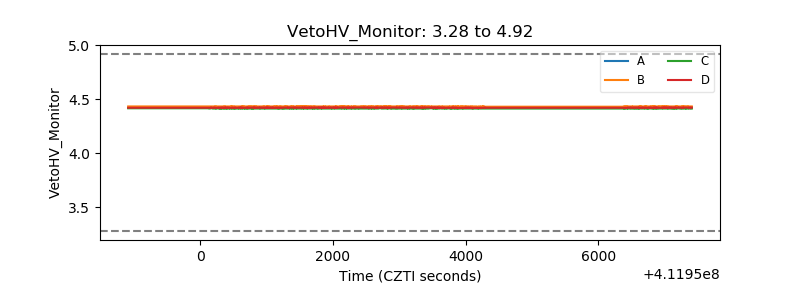 |
| Veto LLD | 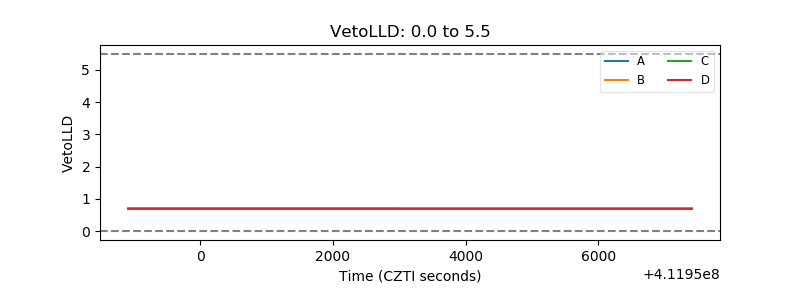 |
| Alpha Counter | 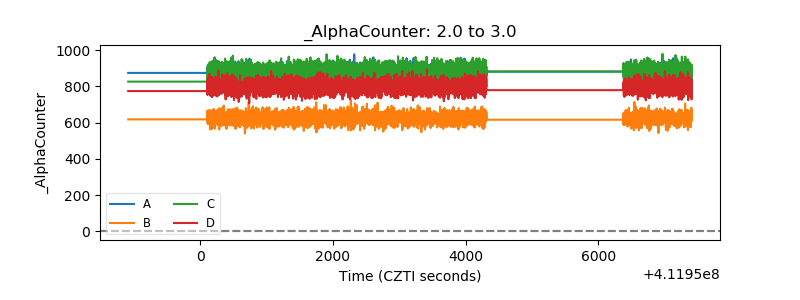 |
| _CPM_Rate | 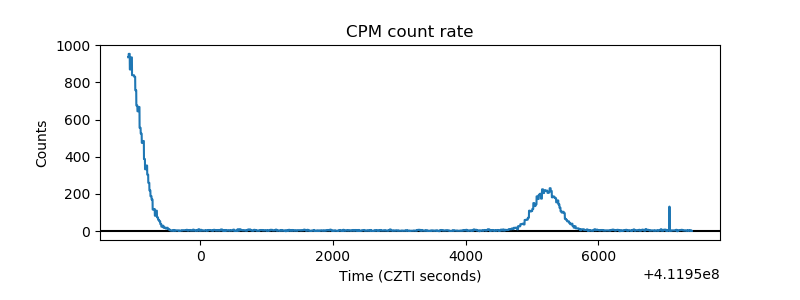 |
| CZT Counter | 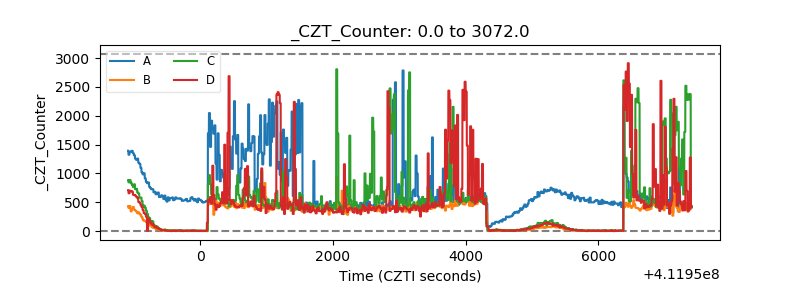 |
| +2.5 Volts monitor | 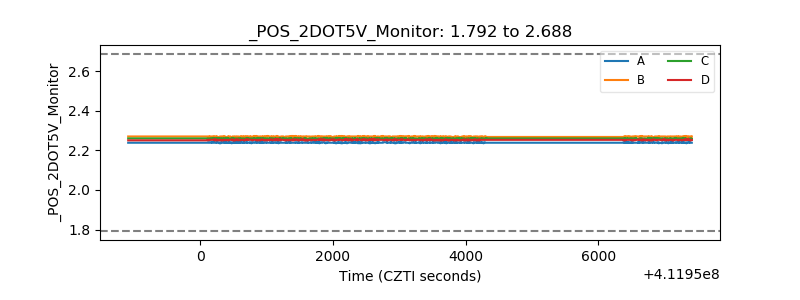 |
| +5 Volts monitor | 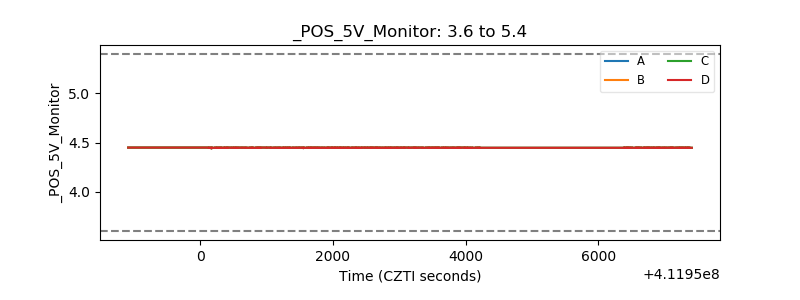 |
| _ROLL_ROT | 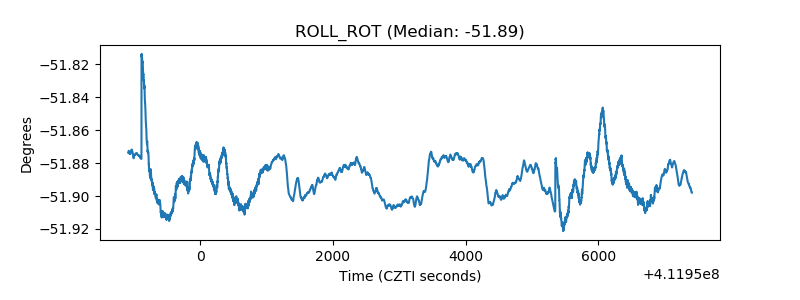 |
| _Roll_DEC | 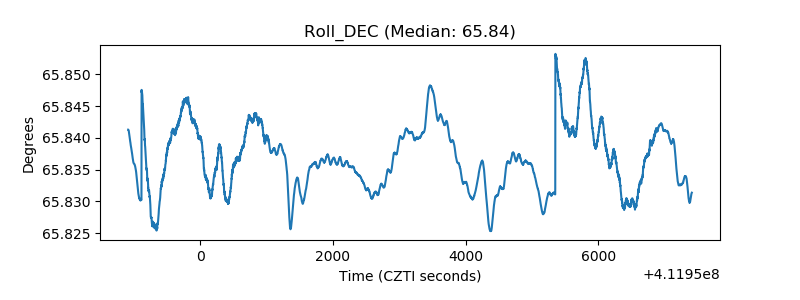 |
| _Roll_RA | 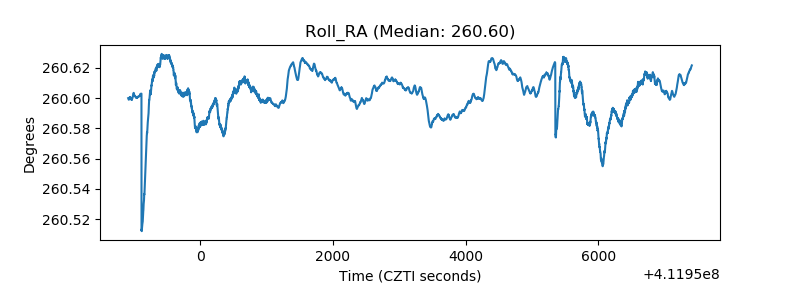 |
| Veto Counter | 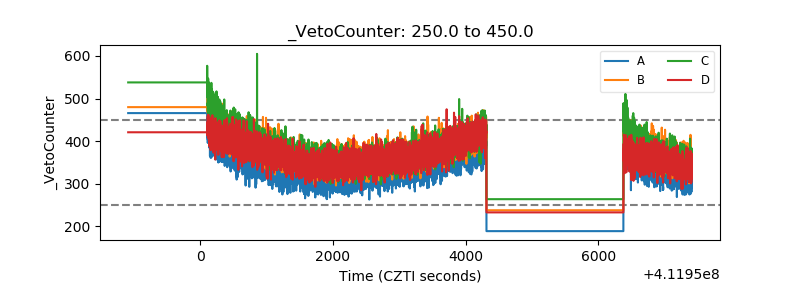 |