| Param | Original file | Final file |
|---|---|---|
| Filename | modeM0/AS1A12_018T01_9000005488_39551cztM0_level2.fits | modeM0/AS1A12_018T01_9000005488_39551cztM0_level2_quad_clean.evt |
| Size (bytes) | 465,816,960 | 83,154,240 |
| Size | 444.2 MB | 79.3 MB |
| Events in quadrant A | 3,070,322 | 589,472 |
| Events in quadrant B | 2,286,934 | 609,953 |
| Events in quadrant C | 5,668,039 | 498,936 |
| Events in quadrant D | 5,797,732 | 441,329 |
| Mode SS | |||
|---|---|---|---|
| Quadrant | BADHDUFLAG | Total packets | Discarded packets |
| A | 0 | 110 | 0 |
| B | 0 | 110 | 0 |
| C | 0 | 110 | 0 |
| D | 0 | 110 | 0 |
| Mode M0 | |||
|---|---|---|---|
| Quadrant | BADHDUFLAG | Total packets | Discarded packets |
| A | 0 | 12661 | 3 |
| B | 0 | 10954 | 2 |
| C | 0 | 20581 | 2 |
| D | 0 | 21222 | 2 |
| Mode M9 | |||
|---|---|---|---|
| Quadrant | BADHDUFLAG | Total packets | Discarded packets |
| A | 0 | 35 | 0 |
| B | 0 | 35 | 0 |
| C | 0 | 35 | 0 |
| D | 0 | 36 | 0 |
| Quadrant | Total seconds | Saturated seconds | Saturation percentage |
|---|---|---|---|
| A | 5402 | 22 | 0.407257% |
| B | 5402 | 15 | 0.277675% |
| C | 5402 | 894 | 16.549426% |
| D | 5402 | 1133 | 20.973713% |
Noise dominated data is calculated using 1-second bins in cleaned event files. If a bin has >2000 counts, and if more than 50% of those come from <1% of pixels, then it is considered to be noise-dominated and hence unusable.
| Quadrant | # 1 sec bins | Bins with >0 counts | Bins with >2000 counts | High rate bins dominated by noise | Noise dominated (total time) | Noise dominated (detector-on time) | Marked lightcurve |
|---|---|---|---|---|---|---|---|
| A | 7255 | 5403 | 14 | 14 | 0.19% | 0.26% | 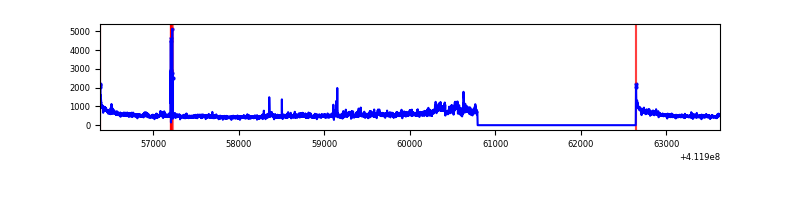 |
| B | 7255 | 5403 | 3 | 3 | 0.04% | 0.06% | 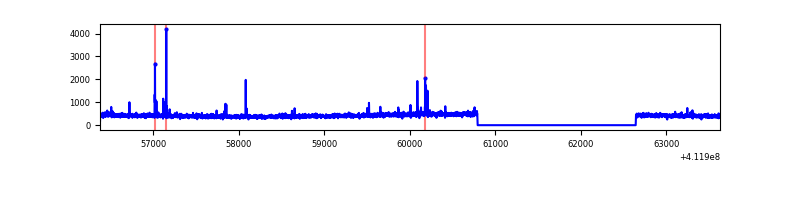 |
| C | 7255 | 5403 | 943 | 943 | 13.00% | 17.45% | 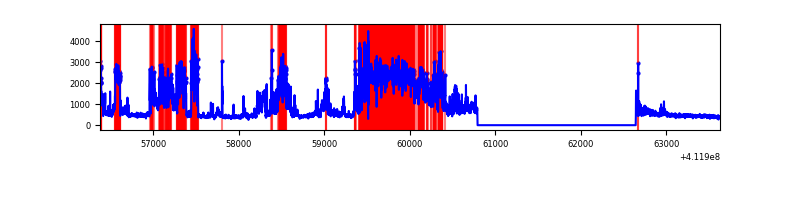 |
| D | 7255 | 5403 | 878 | 878 | 12.10% | 16.25% | 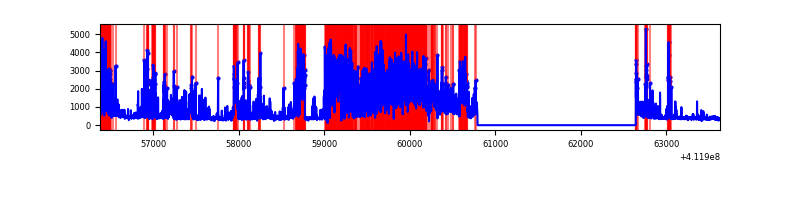 |
Top three noisy pixels from each quadrant. If the there are fewer than three noisy pixels in the level2.evt file, extra rows are filled as -1
| Pixel properties | Quadrant properties | ||||||
|---|---|---|---|---|---|---|---|
| Quadrant | DetID | PixID | Counts | Sigma | Mean | Median | Sigma |
| A | 10 | 83 | 430186 | 3761.0 | 561 | 550 | 114.2 |
| A | 15 | 222 | 396859 | 3469.26 | 561 | 550 | 114.2 |
| A | 10 | 255 | 42406 | 366.4 | 561 | 550 | 114.2 |
| B | 5 | 255 | 60309 | 552.12 | 559 | 543 | 108.2 |
| B | 12 | 111 | 13666 | 121.23 | 559 | 543 | 108.2 |
| B | 11 | 111 | 12469 | 110.17 | 559 | 543 | 108.2 |
| C | 9 | 187 | 3342897 | 27504.12 | 524 | 529 | 121.5 |
| C | 15 | 214 | 219119 | 1798.76 | 524 | 529 | 121.5 |
| C | 15 | 208 | 44259 | 359.85 | 524 | 529 | 121.5 |
| D | 7 | 38 | 2045306 | 16893.1 | 494 | 479 | 121.0 |
| D | 12 | 227 | 864229 | 7135.77 | 494 | 479 | 121.0 |
| D | 12 | 0 | 356432 | 2940.66 | 494 | 479 | 121.0 |
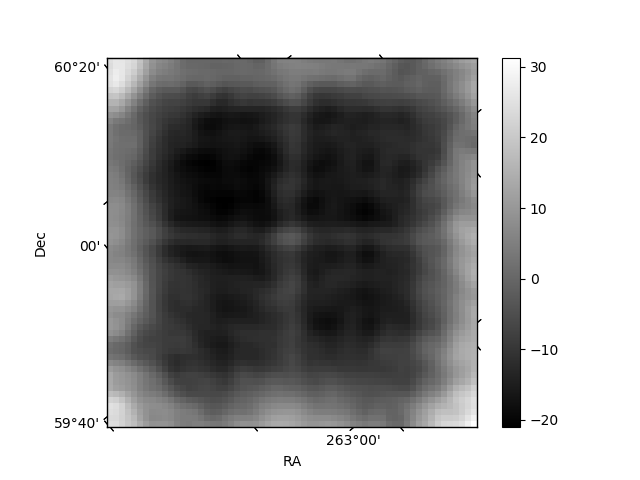
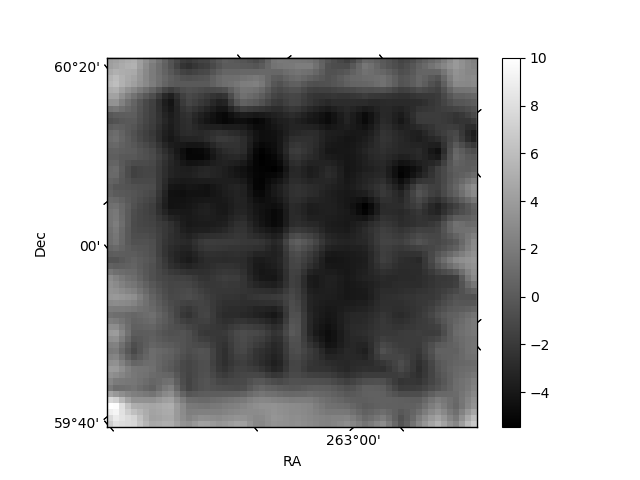
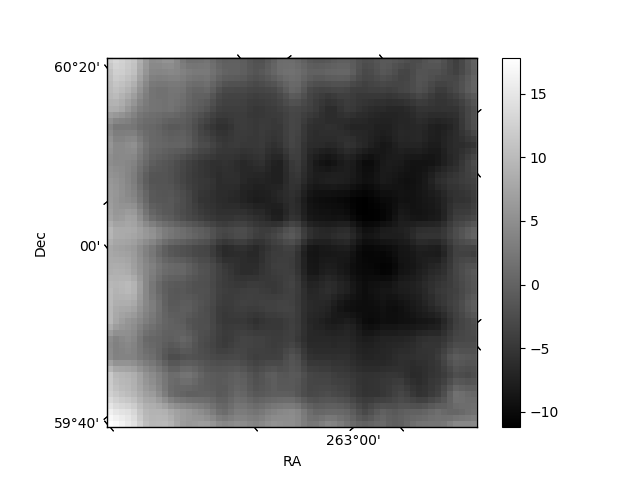
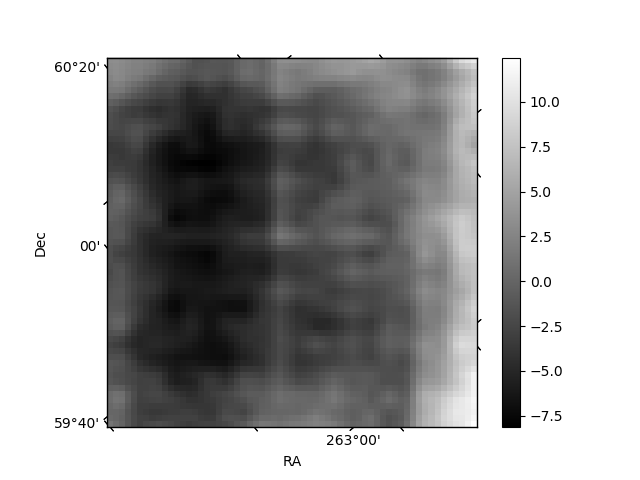
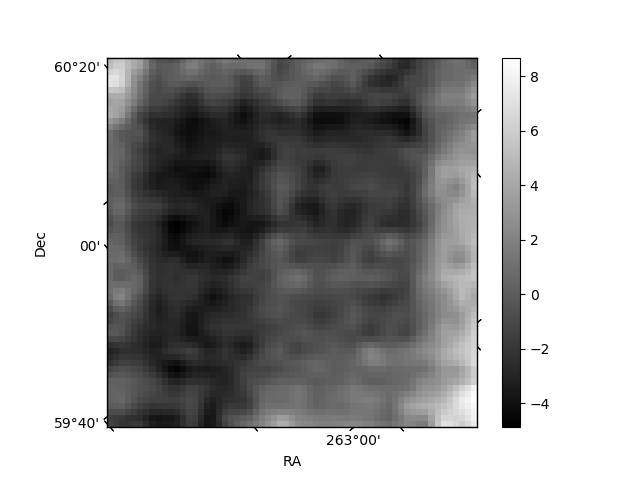
Histogram calculated using DETX and DETY for each event in the final _common_clean file
| Quadrant A | 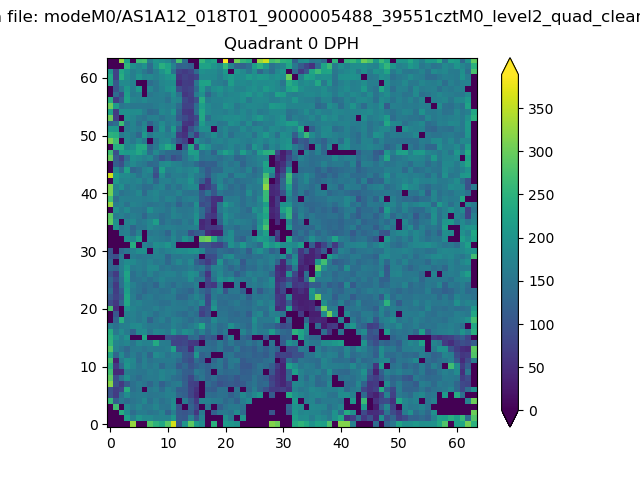 |
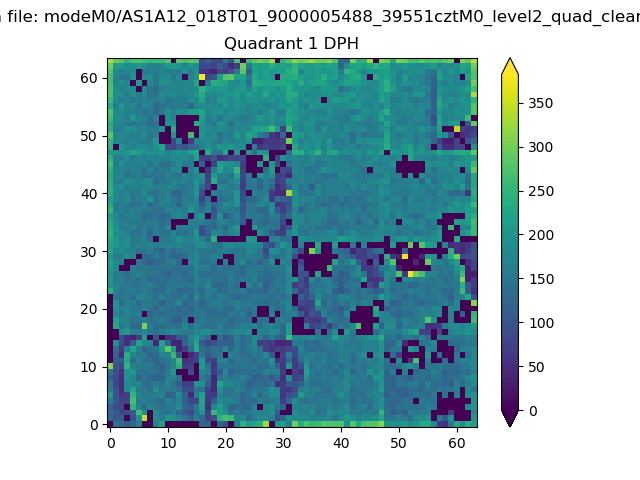 |
Quadrant B |
|---|---|---|---|
| Quadrant D | 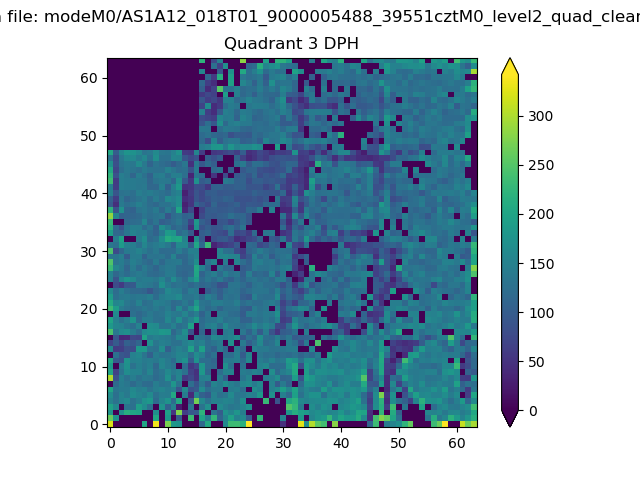 |
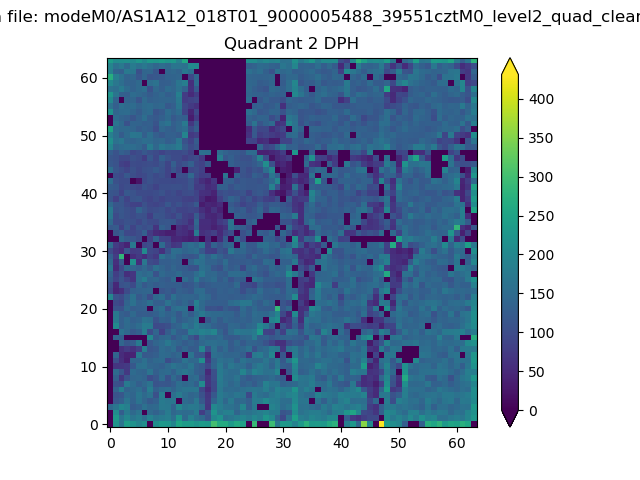 |
Quadrant C |
| Plot type | Count rate plots | Images |
|---|---|---|
| Comparison with Poisson distribution Blue bars denote a histogram of data divided into 1 sec bins. Red curve is a Poisson curve with rate = median count rate of data. |
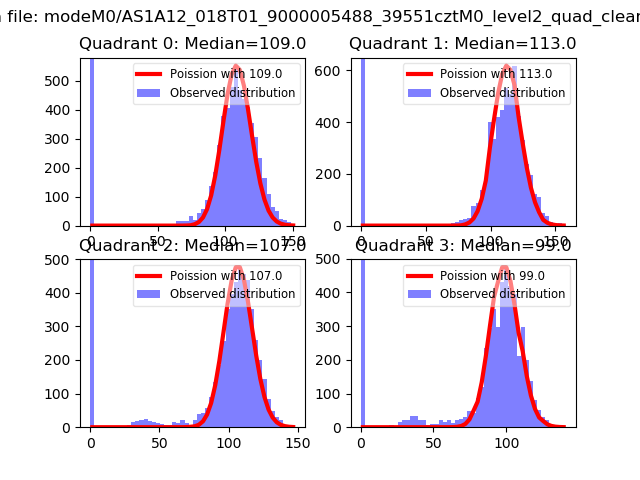 |
 |
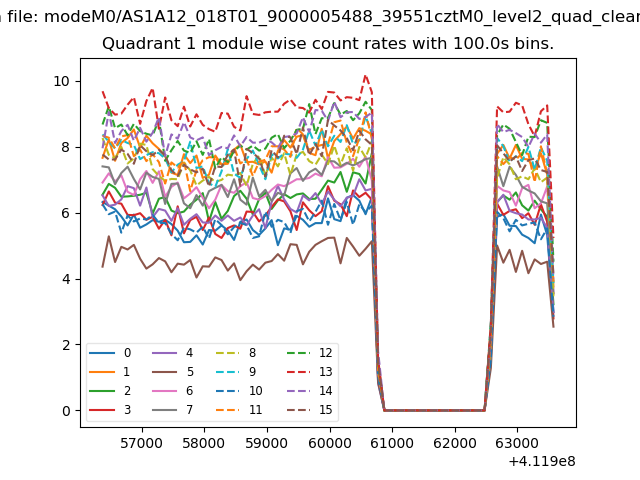
| Quadrant-wise count rates Data is divided into 100 sec bins |
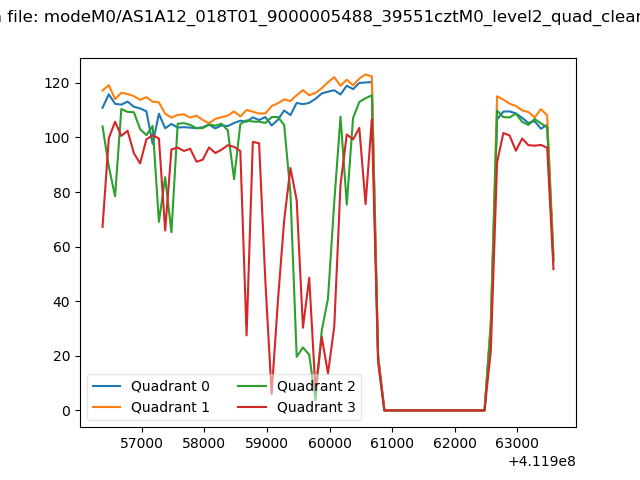 |
|
| Module-wise count rates for Quadrant A Data is divided into 100 sec bins |
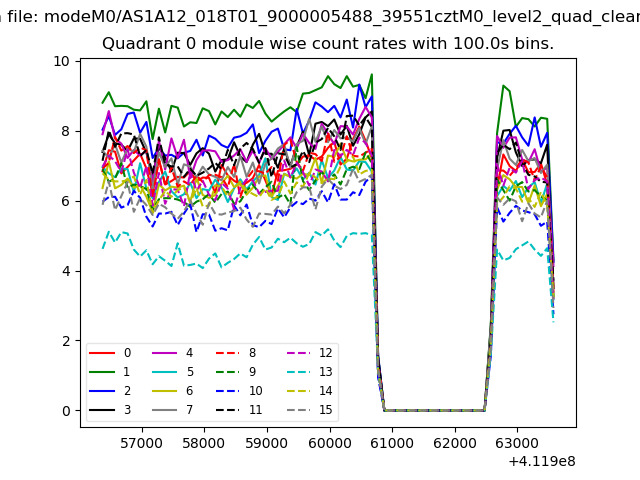 |
 |
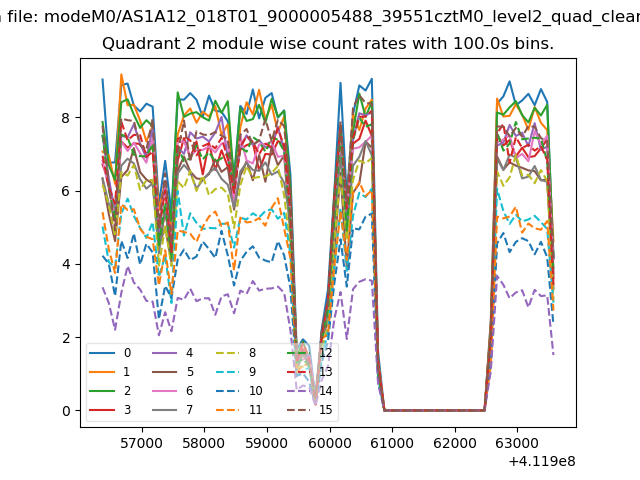
| Module-wise count rates for Quadrant B Data is divided into 100 sec bins |
 |
 |
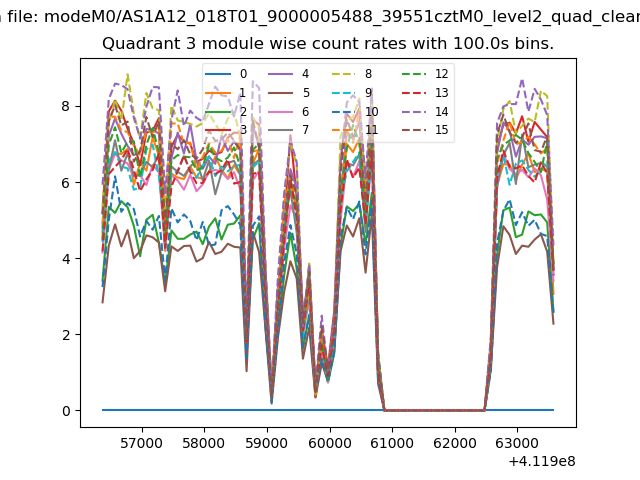
| Module-wise count rates for Quadrant C Data is divided into 100 sec bins |
 |
 |
| Module-wise count rates for Quadrant D Data is divided into 100 sec bins |
 |
 |
| Parameter | Plot |
|---|---|
| CZT HV Monitor | 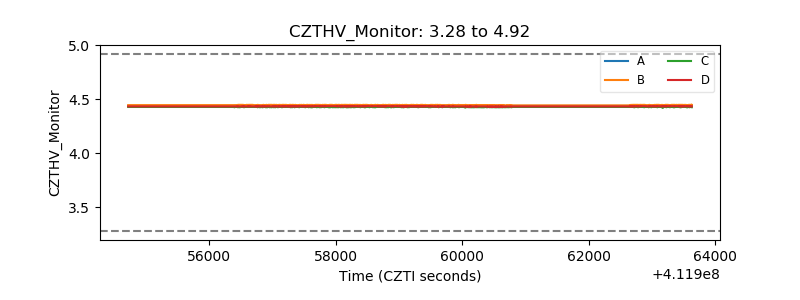 |
| D_VDD | 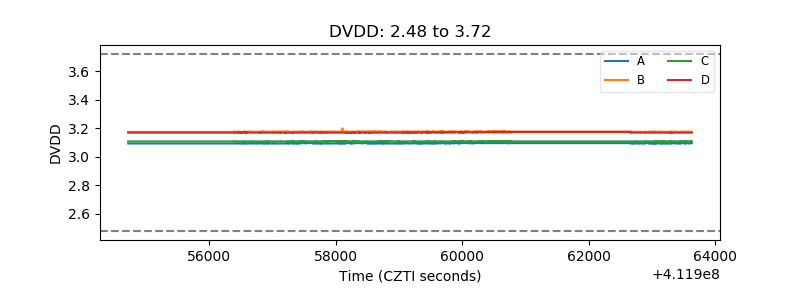 |
| Temperature 1 | 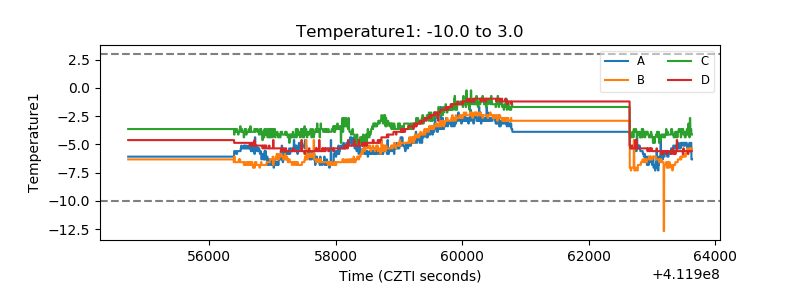 |
| Veto HV Monitor | 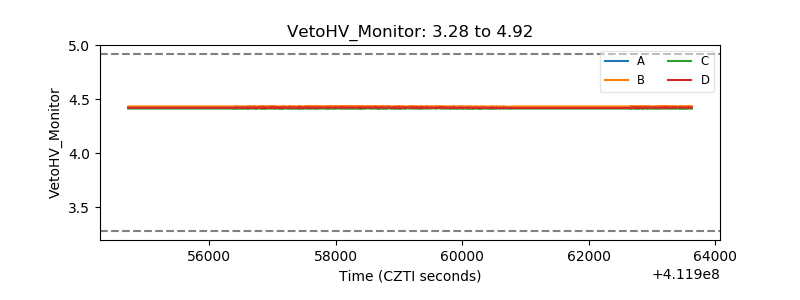 |
| Veto LLD | 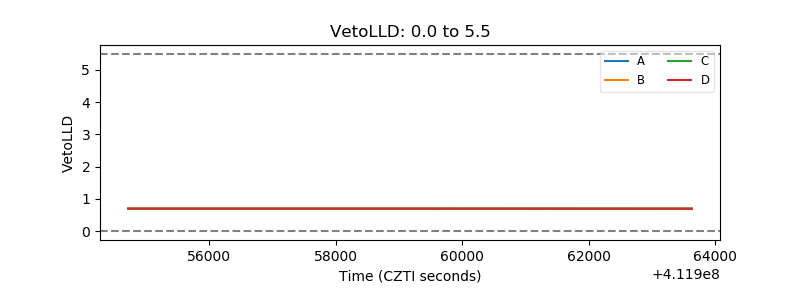 |
| Alpha Counter | 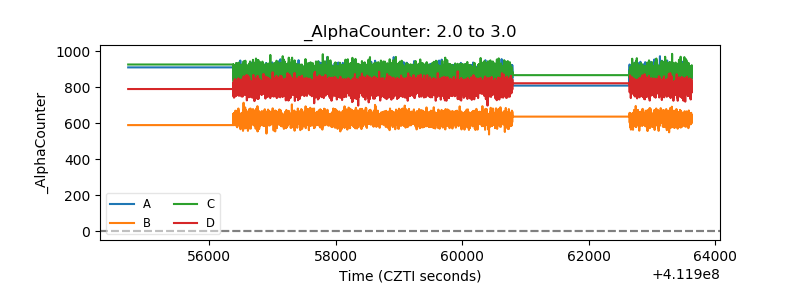 |
| _CPM_Rate | 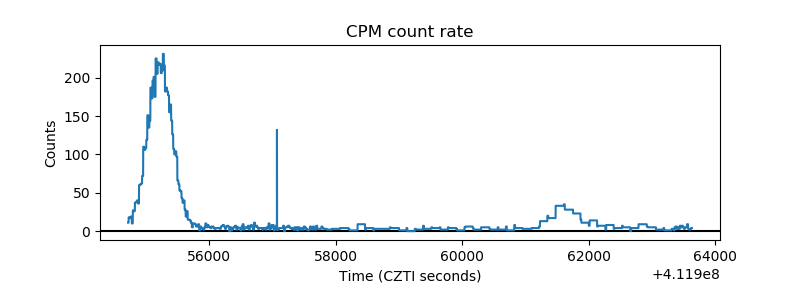 |
| CZT Counter | 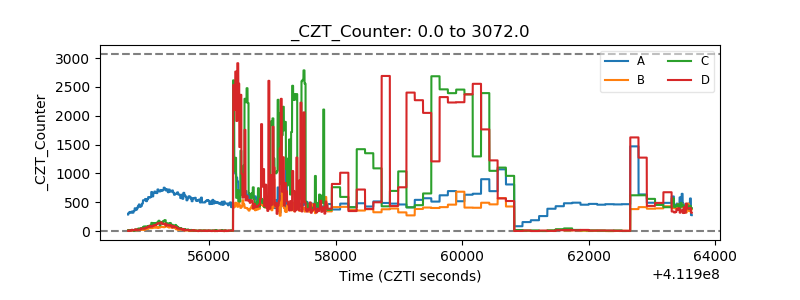 |
| +2.5 Volts monitor | 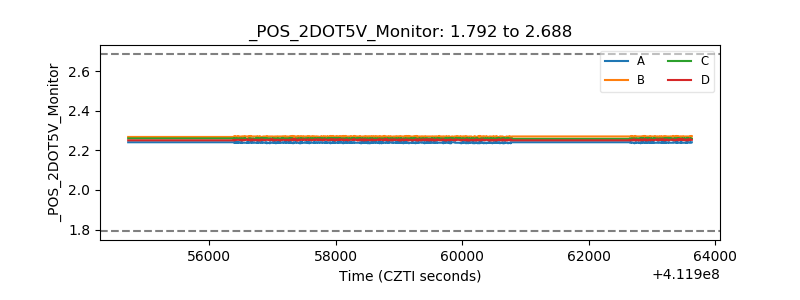 |
| +5 Volts monitor | 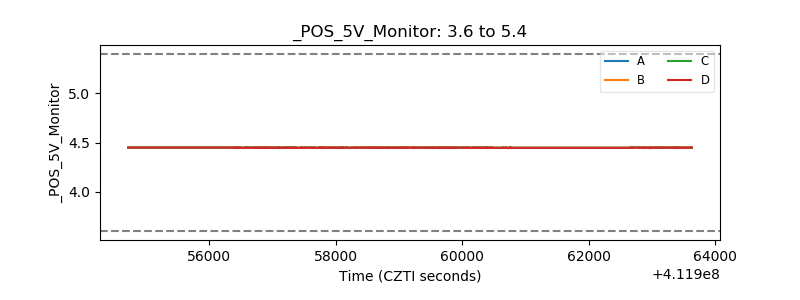 |
| _ROLL_ROT | 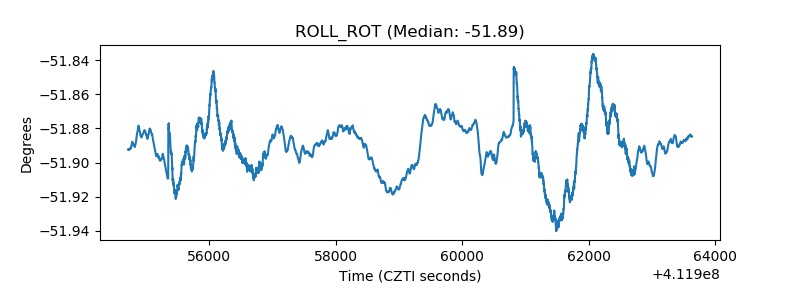 |
| _Roll_DEC | 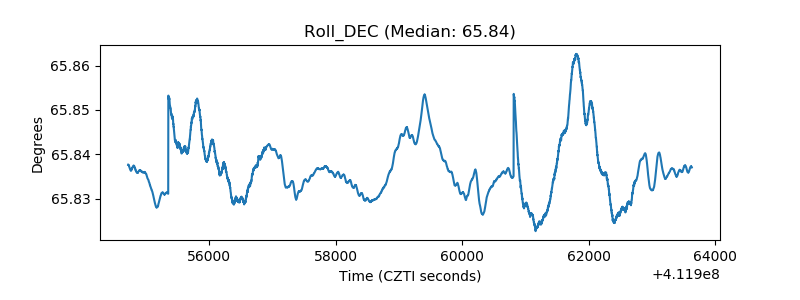 |
| _Roll_RA | 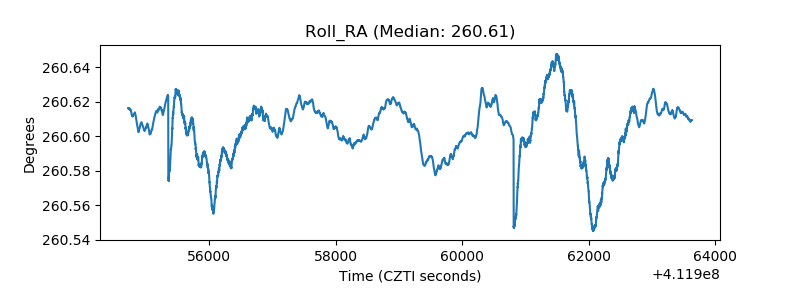 |
| Veto Counter | 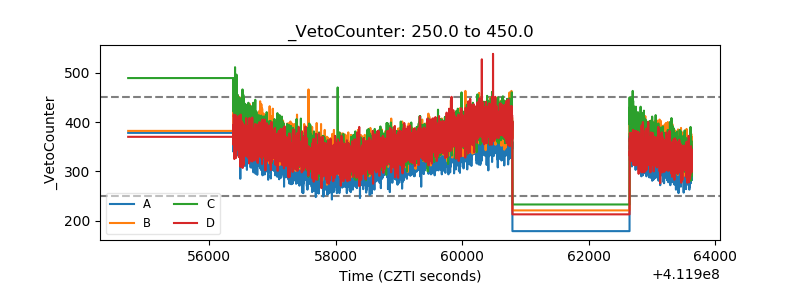 |