| Param | Original file | Final file |
|---|---|---|
| Filename | modeM0/AS1A12_018T01_9000005488_39552cztM0_level2.fits | modeM0/AS1A12_018T01_9000005488_39552cztM0_level2_quad_clean.evt |
| Size (bytes) | 372,510,720 | 91,987,200 |
| Size | 355.3 MB | 87.7 MB |
| Events in quadrant A | 3,000,363 | 615,036 |
| Events in quadrant B | 2,381,772 | 635,717 |
| Events in quadrant C | 4,369,441 | 589,378 |
| Events in quadrant D | 3,594,385 | 546,906 |
| Mode SS | |||
|---|---|---|---|
| Quadrant | BADHDUFLAG | Total packets | Discarded packets |
| A | 0 | 116 | 0 |
| B | 0 | 116 | 0 |
| C | 0 | 116 | 0 |
| D | 0 | 116 | 0 |
| Mode M0 | |||
|---|---|---|---|
| Quadrant | BADHDUFLAG | Total packets | Discarded packets |
| A | 0 | 12518 | 2 |
| B | 0 | 11397 | 1 |
| C | 0 | 17010 | 1 |
| D | 0 | 15156 | 1 |
| Mode M9 | |||
|---|---|---|---|
| Quadrant | BADHDUFLAG | Total packets | Discarded packets |
| A | 0 | 28 | 0 |
| B | 0 | 28 | 0 |
| C | 0 | 28 | 0 |
| D | 0 | 29 | 0 |
| Quadrant | Total seconds | Saturated seconds | Saturation percentage |
|---|---|---|---|
| A | 5694 | 12 | 0.210748% |
| B | 5694 | 6 | 0.105374% |
| C | 5694 | 235 | 4.127151% |
| D | 5694 | 221 | 3.881279% |
Noise dominated data is calculated using 1-second bins in cleaned event files. If a bin has >2000 counts, and if more than 50% of those come from <1% of pixels, then it is considered to be noise-dominated and hence unusable.
| Quadrant | # 1 sec bins | Bins with >0 counts | Bins with >2000 counts | High rate bins dominated by noise | Noise dominated (total time) | Noise dominated (detector-on time) | Marked lightcurve |
|---|---|---|---|---|---|---|---|
| A | 7186 | 5695 | 6 | 6 | 0.08% | 0.11% | 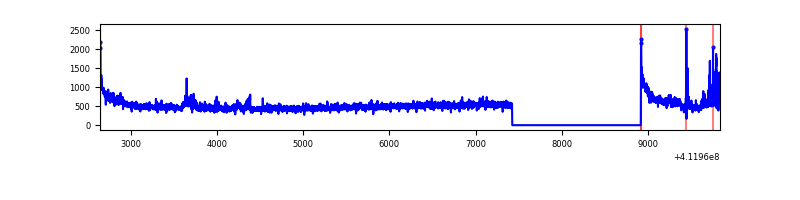 |
| B | 7186 | 5695 | 0 | 0 | 0.00% | 0.00% | 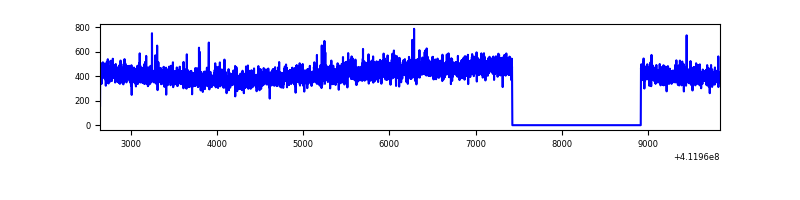 |
| C | 7186 | 5695 | 239 | 239 | 3.33% | 4.20% | 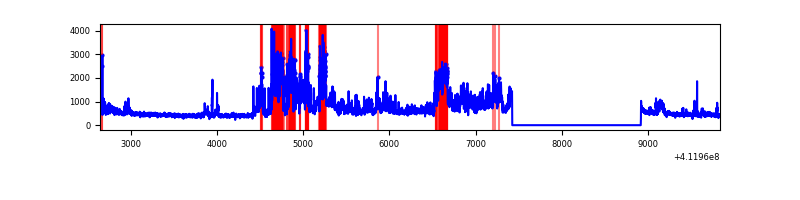 |
| D | 7186 | 5695 | 200 | 200 | 2.78% | 3.51% | 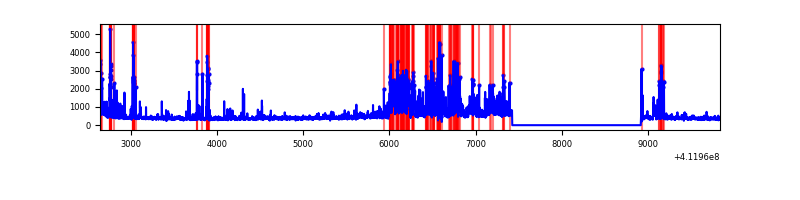 |
Top three noisy pixels from each quadrant. If the there are fewer than three noisy pixels in the level2.evt file, extra rows are filled as -1
| Pixel properties | Quadrant properties | ||||||
|---|---|---|---|---|---|---|---|
| Quadrant | DetID | PixID | Counts | Sigma | Mean | Median | Sigma |
| A | 10 | 83 | 448363 | 3704.1 | 594 | 582 | 120.9 |
| A | 15 | 222 | 226475 | 1868.61 | 594 | 582 | 120.9 |
| A | 6 | 10 | 8136 | 62.49 | 594 | 582 | 120.9 |
| B | 0 | 230 | 21220 | 180.43 | 592 | 575 | 114.4 |
| B | 5 | 255 | 15619 | 131.48 | 592 | 575 | 114.4 |
| B | 12 | 111 | 14699 | 123.44 | 592 | 575 | 114.4 |
| C | 9 | 187 | 1822270 | 13672.86 | 574 | 576 | 133.2 |
| C | 15 | 214 | 237735 | 1780.01 | 574 | 576 | 133.2 |
| C | 15 | 208 | 61508 | 457.33 | 574 | 576 | 133.2 |
| D | 14 | 34 | 516080 | 3708.69 | 569 | 552 | 139.0 |
| D | 12 | 227 | 395612 | 2842.04 | 569 | 552 | 139.0 |
| D | 13 | 249 | 167526 | 1201.2 | 569 | 552 | 139.0 |
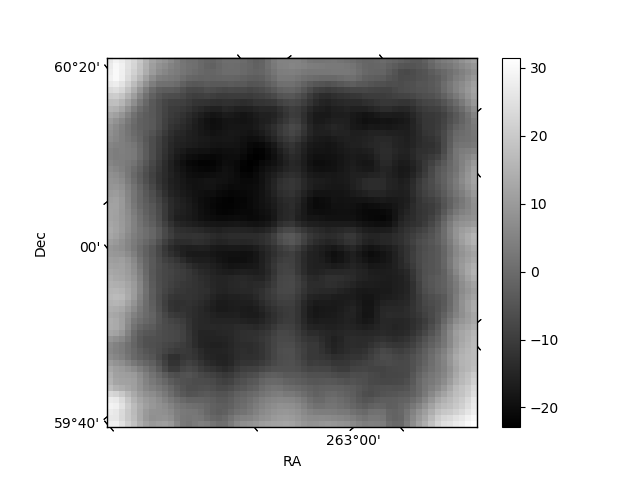
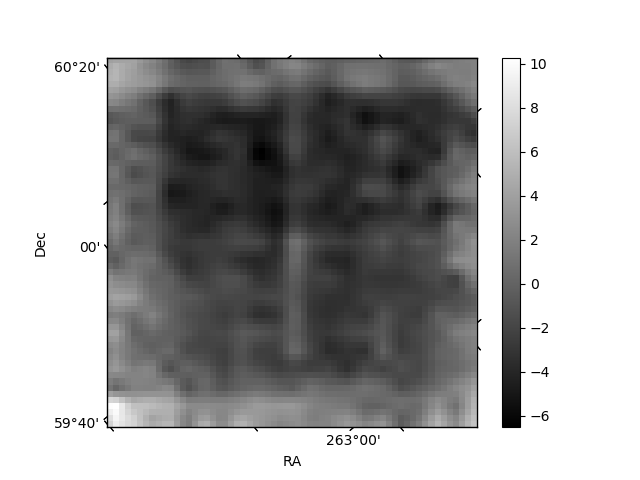
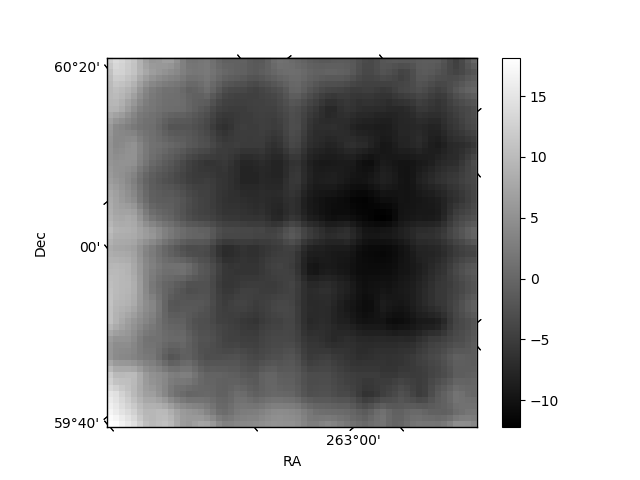
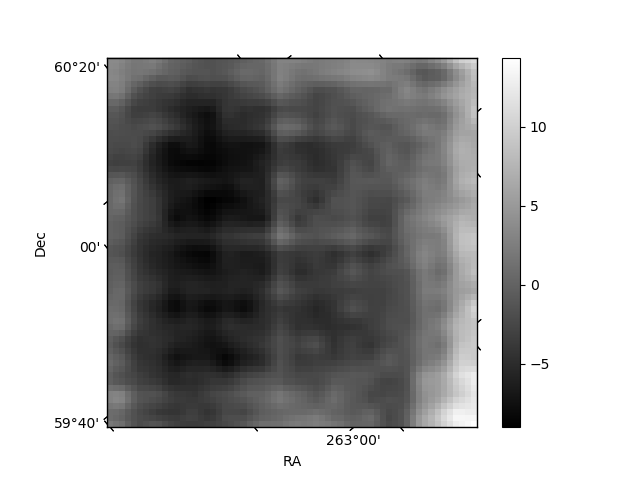
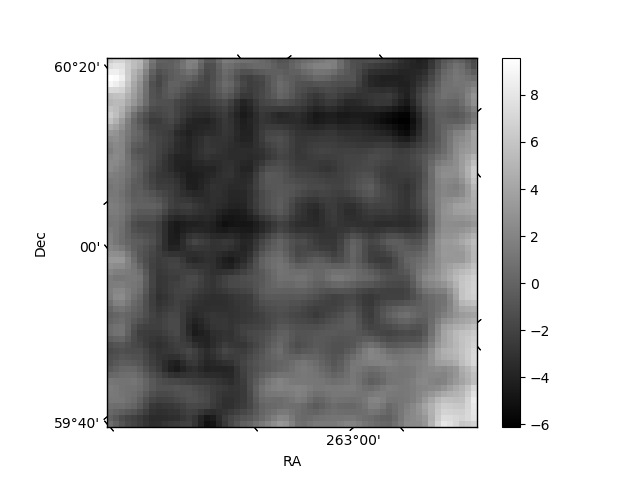
Histogram calculated using DETX and DETY for each event in the final _common_clean file
| Quadrant A | 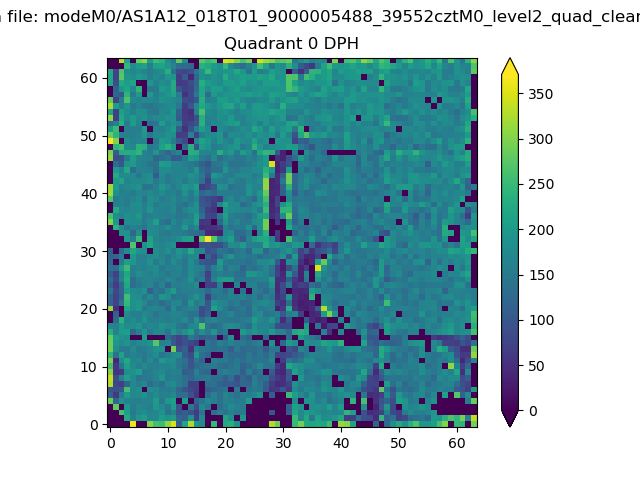 |
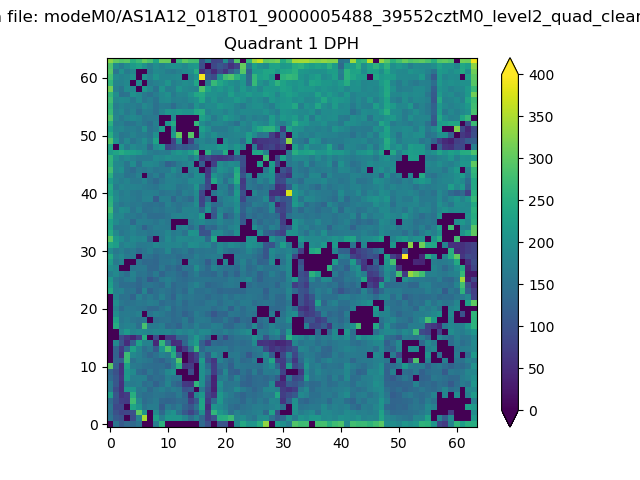 |
Quadrant B |
|---|---|---|---|
| Quadrant D | 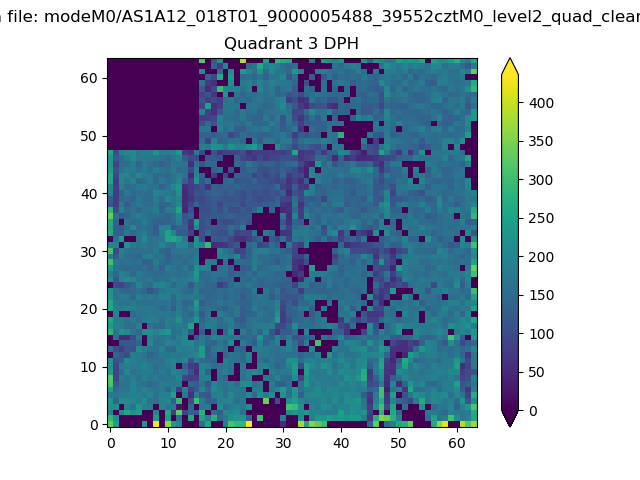 |
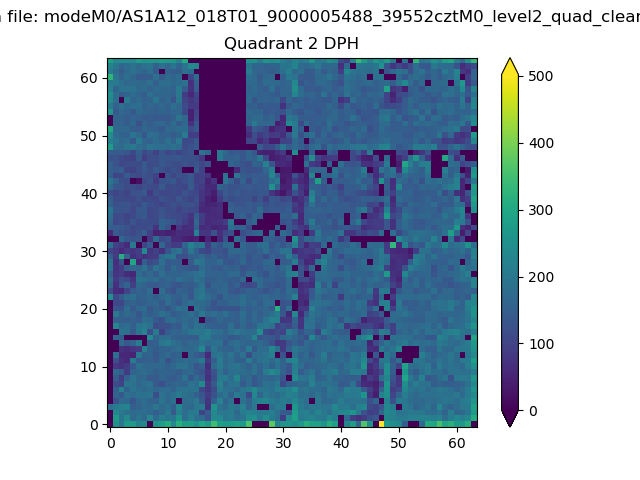 |
Quadrant C |
| Plot type | Count rate plots | Images |
|---|---|---|
| Comparison with Poisson distribution Blue bars denote a histogram of data divided into 1 sec bins. Red curve is a Poisson curve with rate = median count rate of data. |
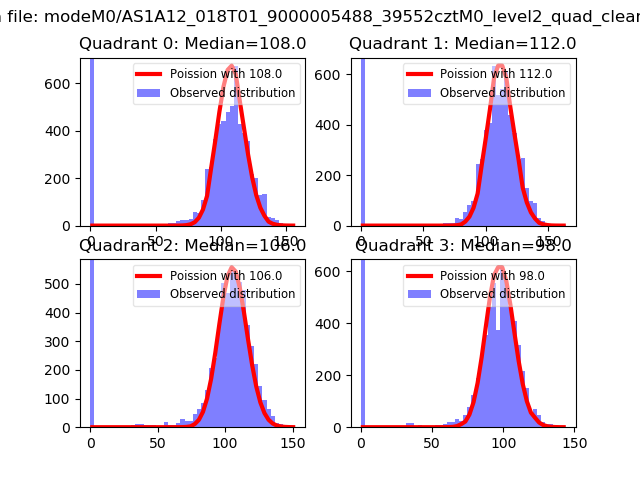 |
 |
| Quadrant-wise count rates Data is divided into 100 sec bins |
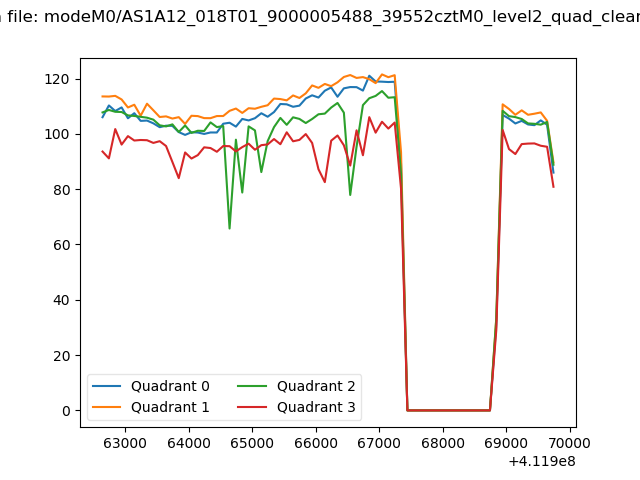 |
|
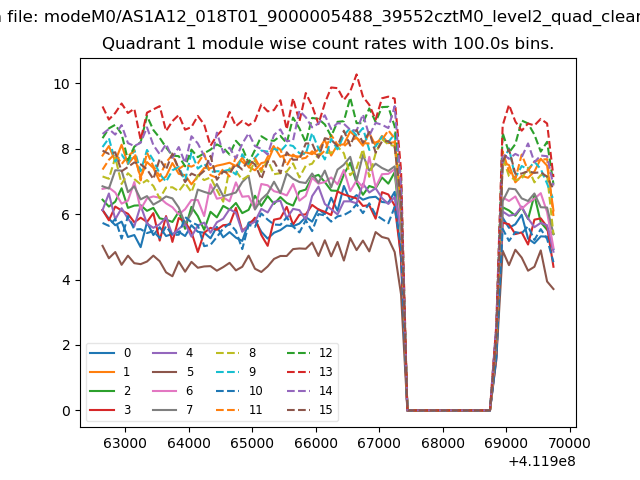
| Module-wise count rates for Quadrant A Data is divided into 100 sec bins |
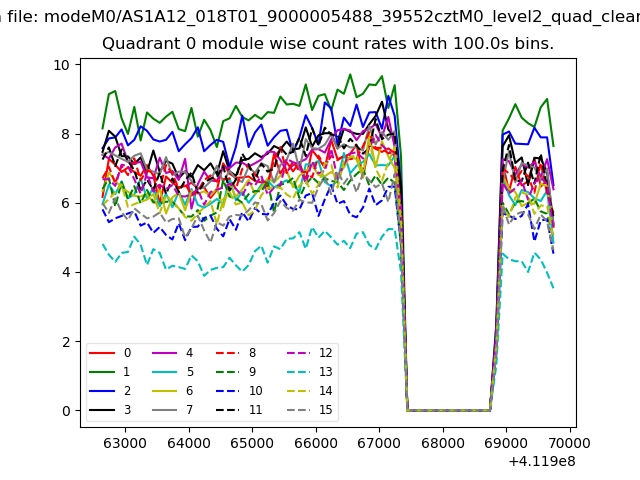 |
 |
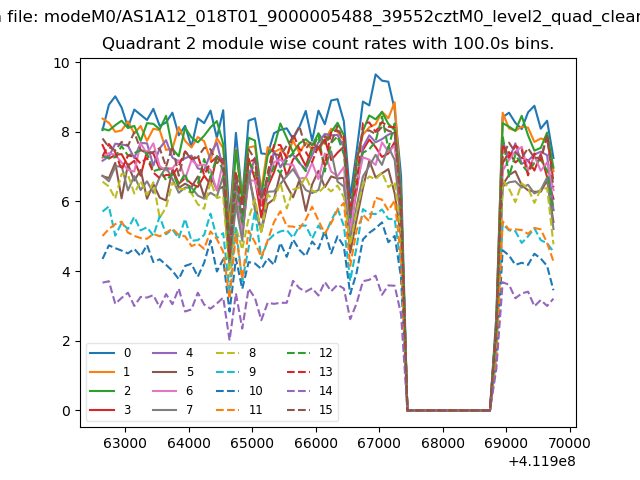
| Module-wise count rates for Quadrant B Data is divided into 100 sec bins |
 |
 |
| Module-wise count rates for Quadrant C Data is divided into 100 sec bins |
 |
 |
| Module-wise count rates for Quadrant D Data is divided into 100 sec bins |
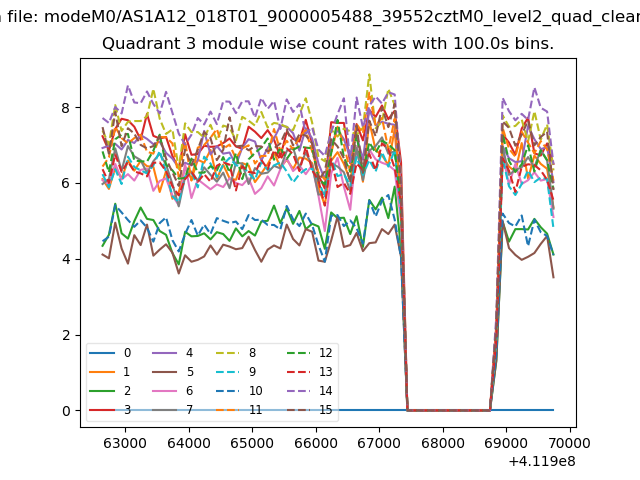 |
 |
| Parameter | Plot |
|---|---|
| CZT HV Monitor | 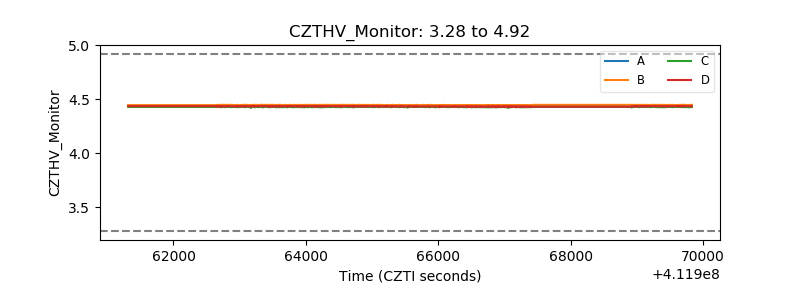 |
| D_VDD | 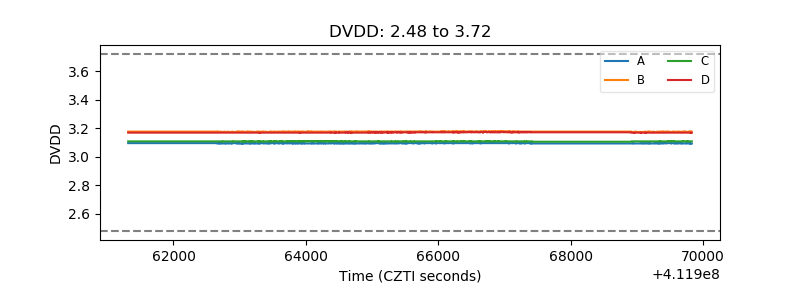 |
| Temperature 1 | 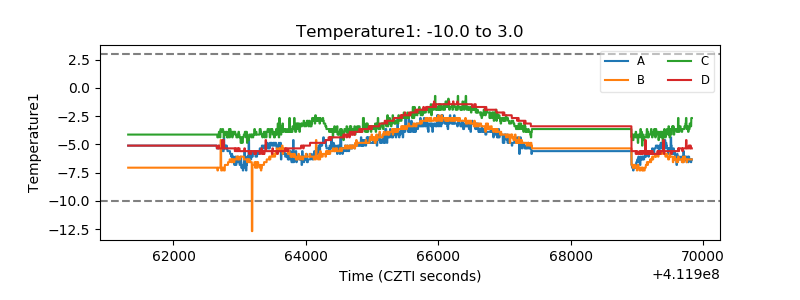 |
| Veto HV Monitor | 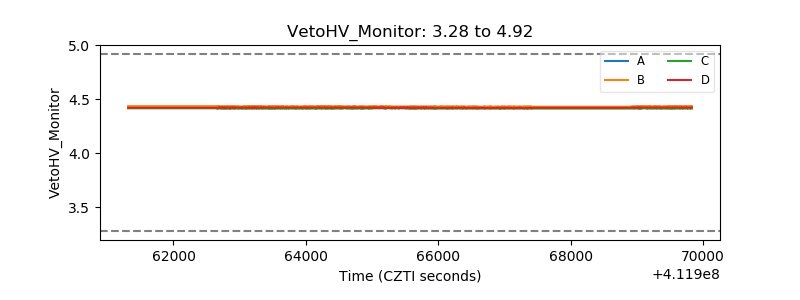 |
| Veto LLD | 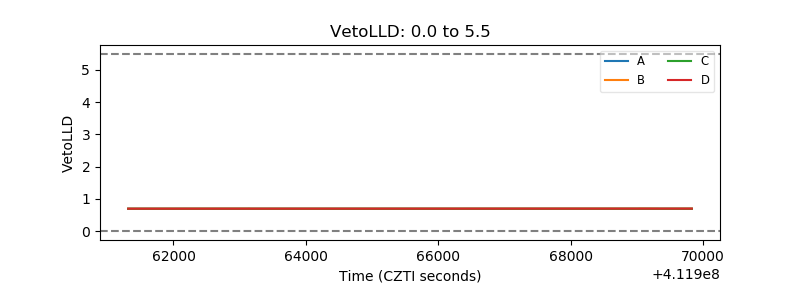 |
| Alpha Counter | 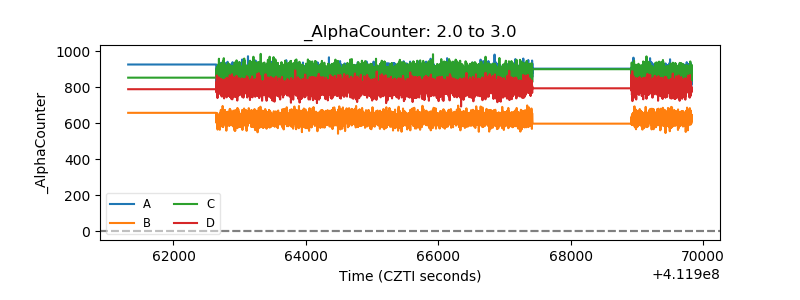 |
| _CPM_Rate | 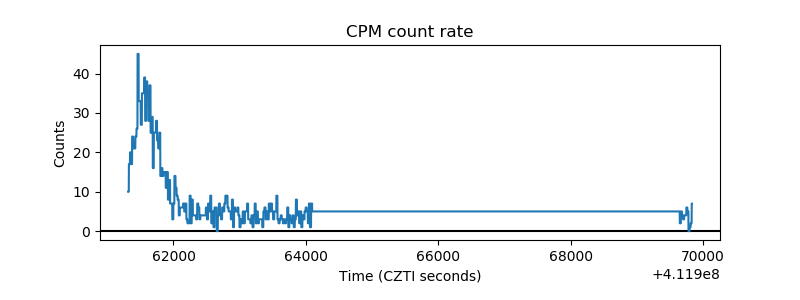 |
| CZT Counter | 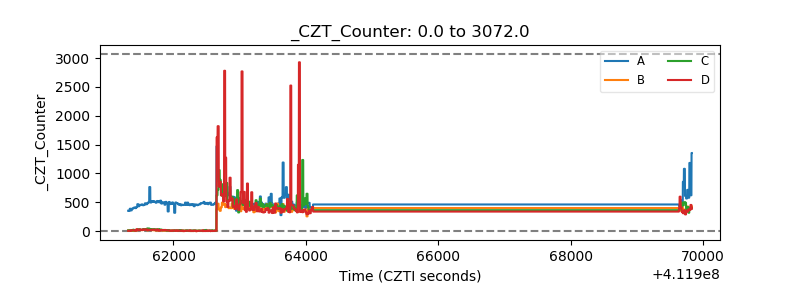 |
| +2.5 Volts monitor | 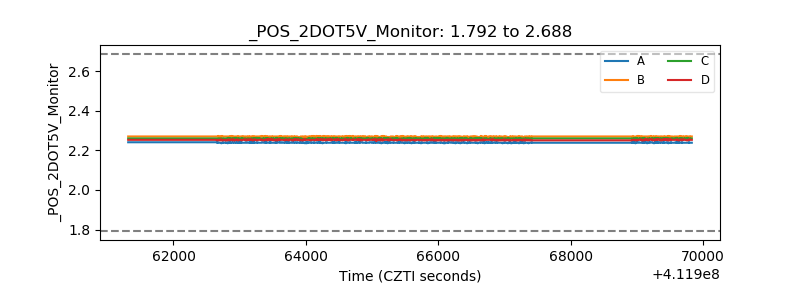 |
| +5 Volts monitor | 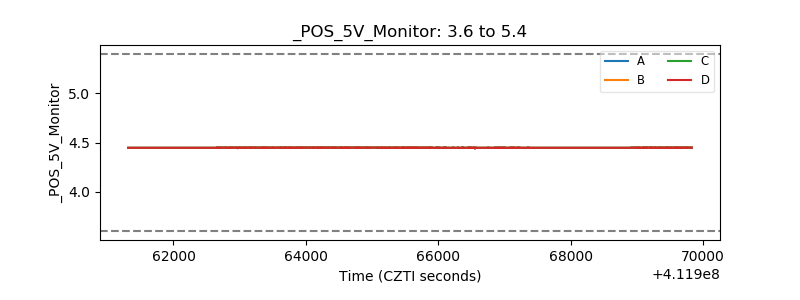 |
| _ROLL_ROT | 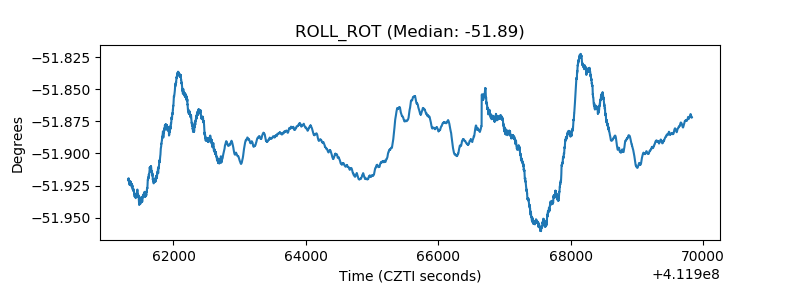 |
| _Roll_DEC | 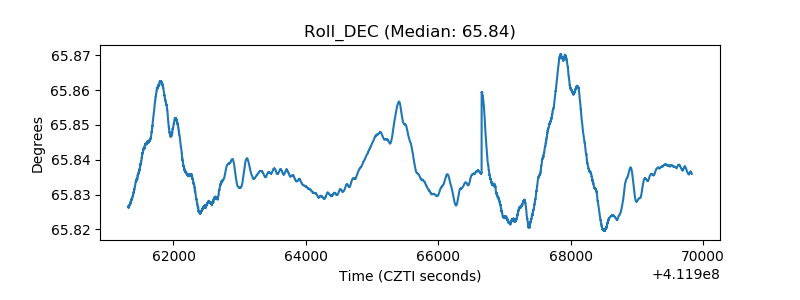 |
| _Roll_RA | 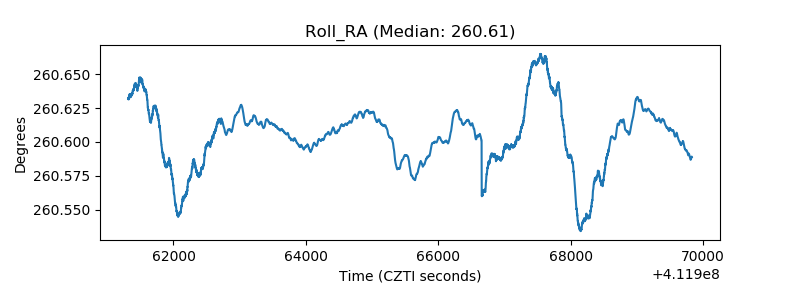 |
| Veto Counter | 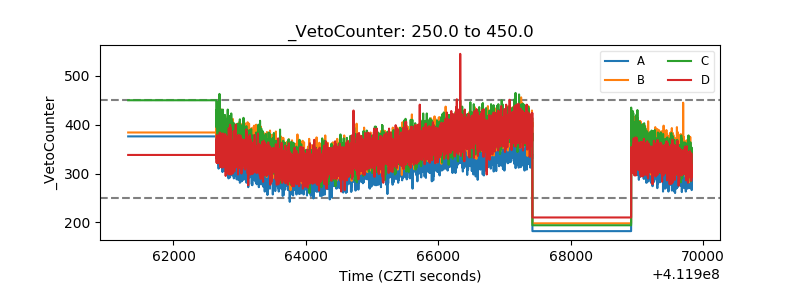 |