| Param | Original file | Final file |
|---|---|---|
| Filename | modeM0/AS1A12_018T01_9000005488_39554cztM0_level2.fits | modeM0/AS1A12_018T01_9000005488_39554cztM0_level2_quad_clean.evt |
| Size (bytes) | 459,766,080 | 91,425,600 |
| Size | 438.5 MB | 87.2 MB |
| Events in quadrant A | 5,064,205 | 605,797 |
| Events in quadrant B | 2,575,979 | 648,022 |
| Events in quadrant C | 4,844,103 | 552,351 |
| Events in quadrant D | 4,080,809 | 553,634 |
| Mode SS | |||
|---|---|---|---|
| Quadrant | BADHDUFLAG | Total packets | Discarded packets |
| A | 0 | 118 | 0 |
| B | 0 | 118 | 0 |
| C | 0 | 118 | 0 |
| D | 0 | 118 | 0 |
| Mode M0 | |||
|---|---|---|---|
| Quadrant | BADHDUFLAG | Total packets | Discarded packets |
| A | 0 | 19016 | 2 |
| B | 0 | 11996 | 1 |
| C | 0 | 18353 | 1 |
| D | 0 | 16455 | 1 |
| Mode M9 | |||
|---|---|---|---|
| Quadrant | BADHDUFLAG | Total packets | Discarded packets |
| A | 0 | 13 | 0 |
| B | 0 | 13 | 0 |
| C | 0 | 13 | 0 |
| D | 0 | 13 | 0 |
| Quadrant | Total seconds | Saturated seconds | Saturation percentage |
|---|---|---|---|
| A | 5845 | 357 | 6.107784% |
| B | 5845 | 13 | 0.222412% |
| C | 5845 | 605 | 10.350727% |
| D | 5845 | 243 | 4.157399% |
Noise dominated data is calculated using 1-second bins in cleaned event files. If a bin has >2000 counts, and if more than 50% of those come from <1% of pixels, then it is considered to be noise-dominated and hence unusable.
| Quadrant | # 1 sec bins | Bins with >0 counts | Bins with >2000 counts | High rate bins dominated by noise | Noise dominated (total time) | Noise dominated (detector-on time) | Marked lightcurve |
|---|---|---|---|---|---|---|---|
| A | 7127 | 5846 | 309 | 309 | 4.34% | 5.29% | 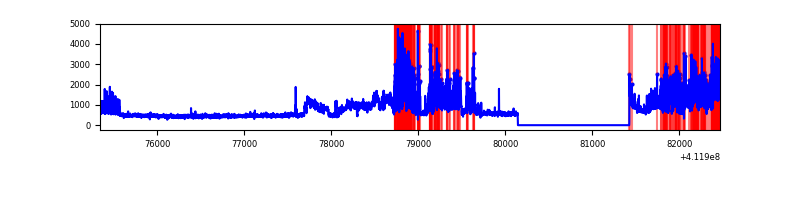 |
| B | 7127 | 5846 | 4 | 4 | 0.06% | 0.07% | 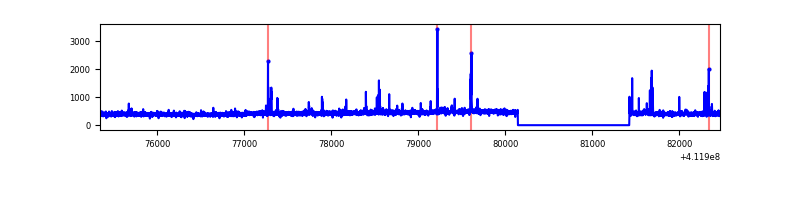 |
| C | 7127 | 5846 | 542 | 542 | 7.60% | 9.27% | 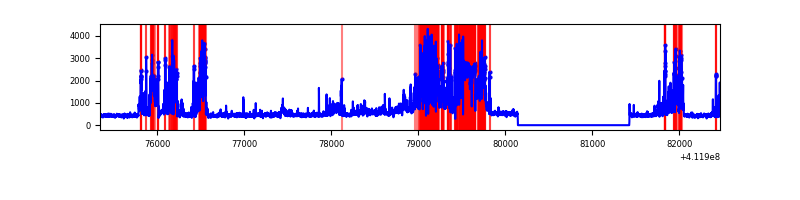 |
| D | 7127 | 5846 | 253 | 253 | 3.55% | 4.33% | 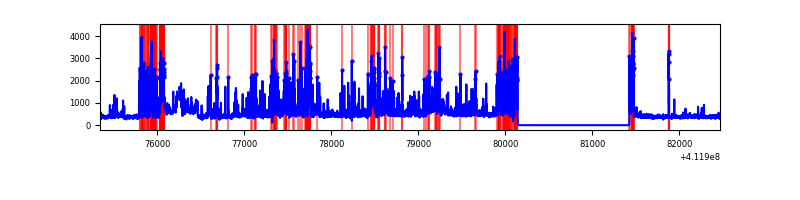 |
Top three noisy pixels from each quadrant. If the there are fewer than three noisy pixels in the level2.evt file, extra rows are filled as -1
| Pixel properties | Quadrant properties | ||||||
|---|---|---|---|---|---|---|---|
| Quadrant | DetID | PixID | Counts | Sigma | Mean | Median | Sigma |
| A | 15 | 222 | 2273871 | 18302.25 | 608 | 595 | 124.2 |
| A | 10 | 83 | 402690 | 3237.29 | 608 | 595 | 124.2 |
| A | 9 | 143 | 12387 | 94.94 | 608 | 595 | 124.2 |
| B | 5 | 255 | 72601 | 606.49 | 616 | 598 | 118.7 |
| B | 5 | 172 | 38152 | 316.32 | 616 | 598 | 118.7 |
| B | 12 | 111 | 15283 | 123.69 | 616 | 598 | 118.7 |
| C | 9 | 187 | 2335135 | 17600.1 | 563 | 565 | 132.6 |
| C | 15 | 214 | 232565 | 1749.03 | 563 | 565 | 132.6 |
| C | 15 | 208 | 46870 | 349.09 | 563 | 565 | 132.6 |
| D | 13 | 249 | 619507 | 4259.32 | 594 | 576 | 145.3 |
| D | 12 | 227 | 379852 | 2610.08 | 594 | 576 | 145.3 |
| D | 14 | 34 | 375189 | 2577.99 | 594 | 576 | 145.3 |
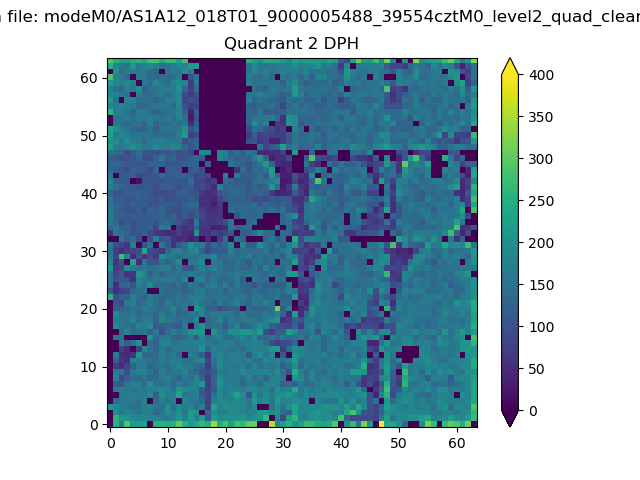
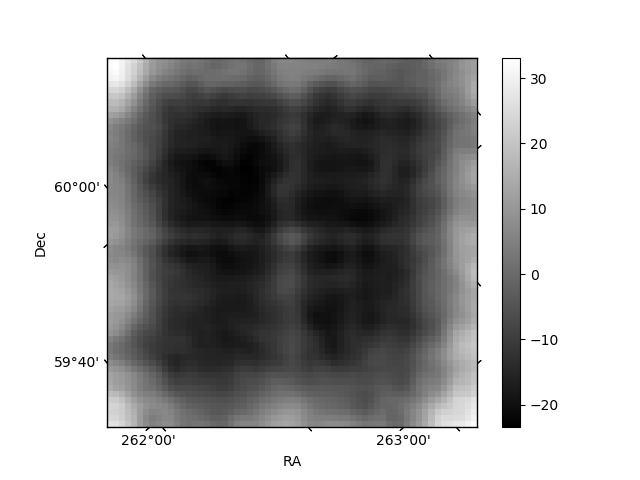
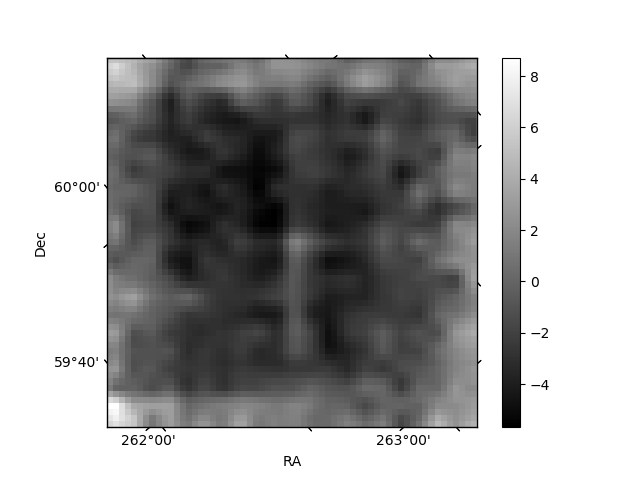
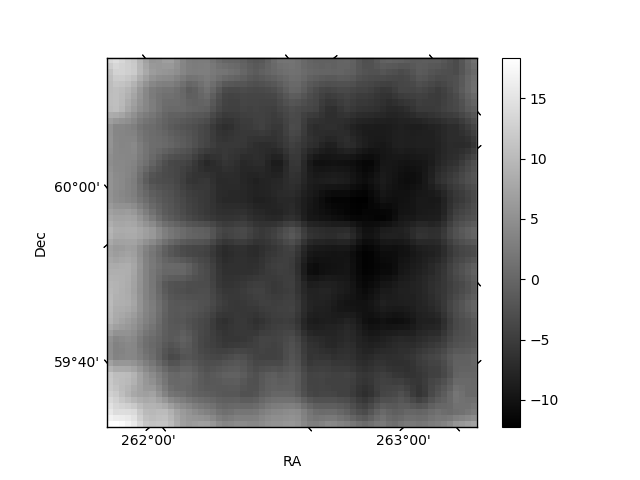
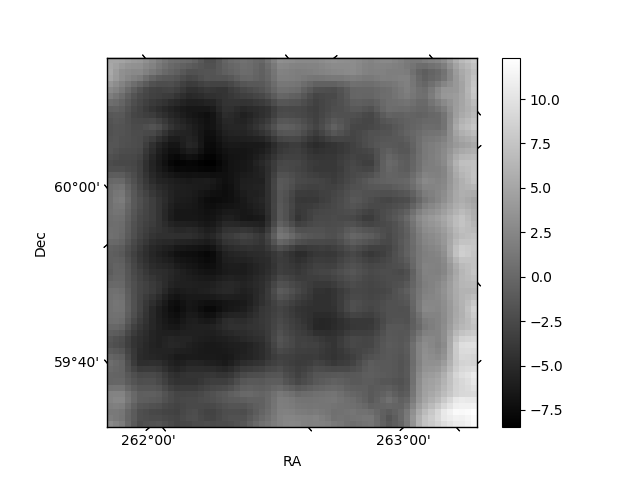
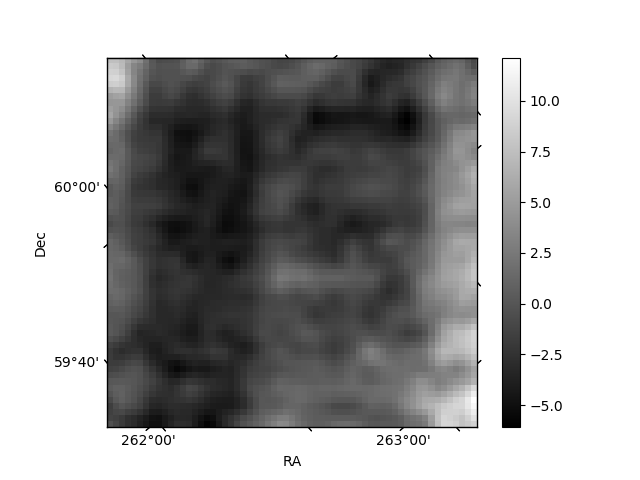
Histogram calculated using DETX and DETY for each event in the final _common_clean file
| Quadrant A | 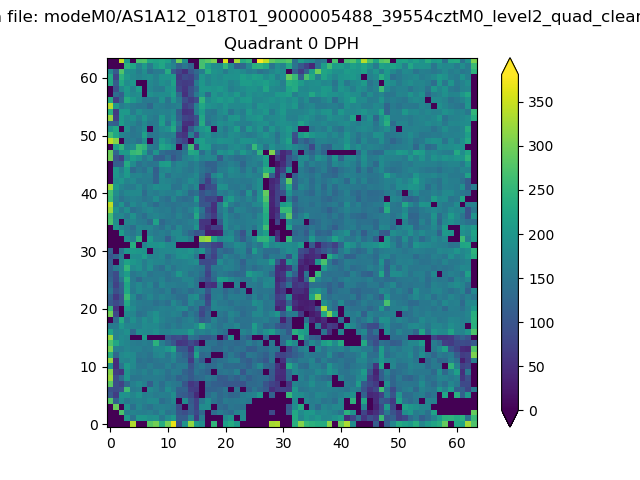 |
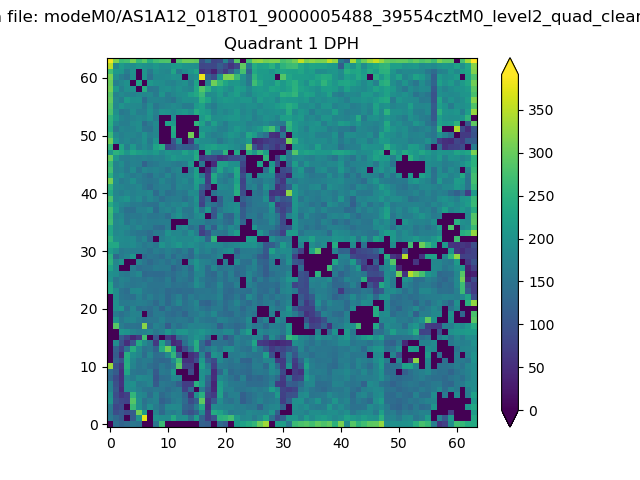 |
Quadrant B |
|---|---|---|---|
| Quadrant D | 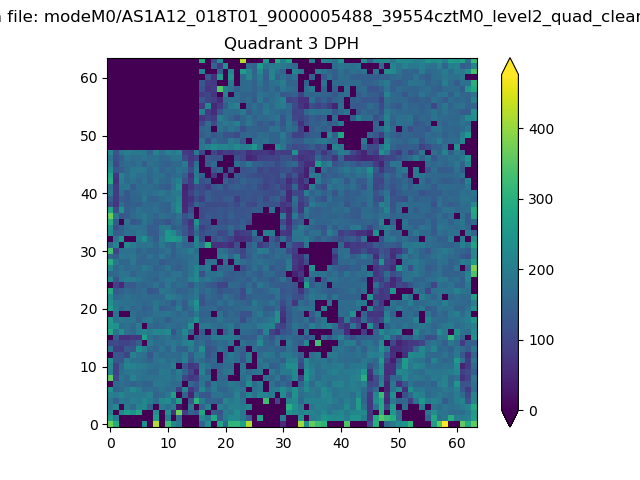 |
 |
Quadrant C |
| Plot type | Count rate plots | Images |
|---|---|---|
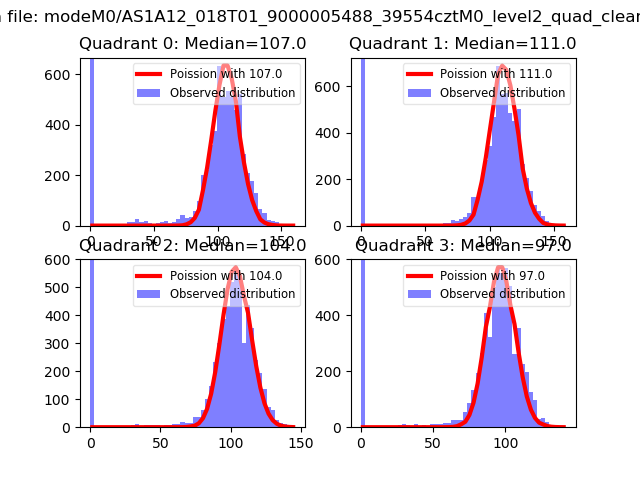
| Comparison with Poisson distribution Blue bars denote a histogram of data divided into 1 sec bins. Red curve is a Poisson curve with rate = median count rate of data. |
 |
 |
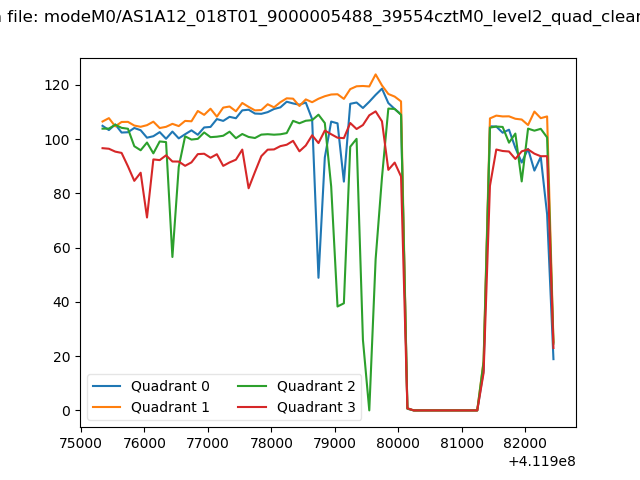
| Quadrant-wise count rates Data is divided into 100 sec bins |
 |
|
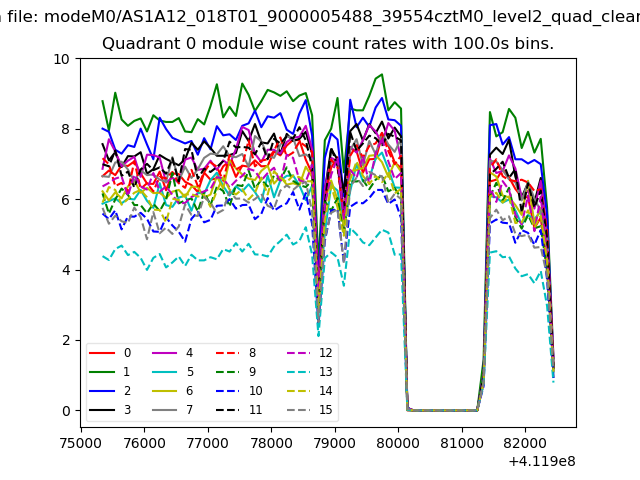
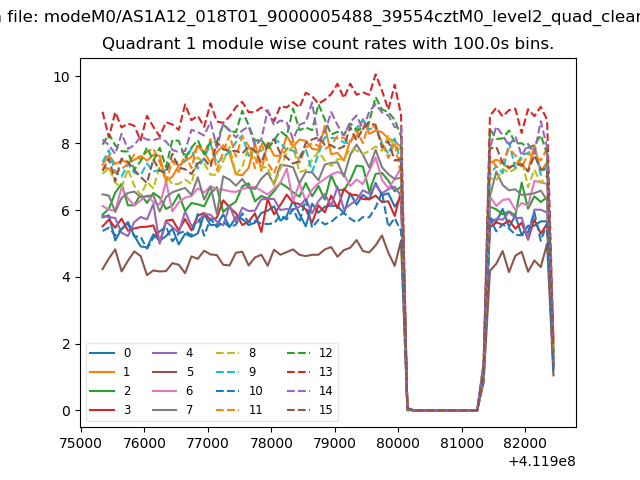
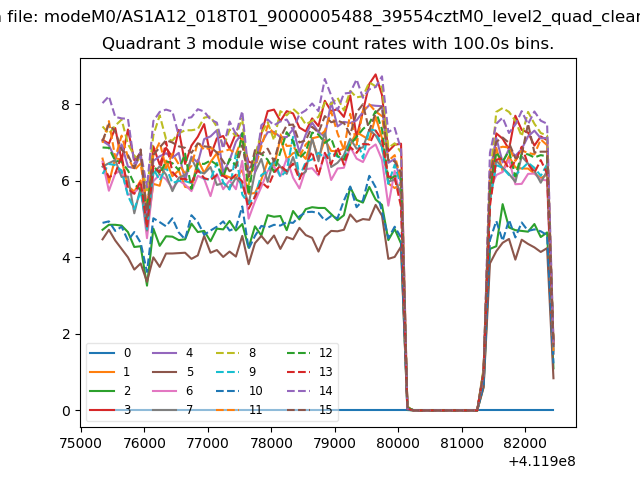
| Module-wise count rates for Quadrant A Data is divided into 100 sec bins |
 |
 |
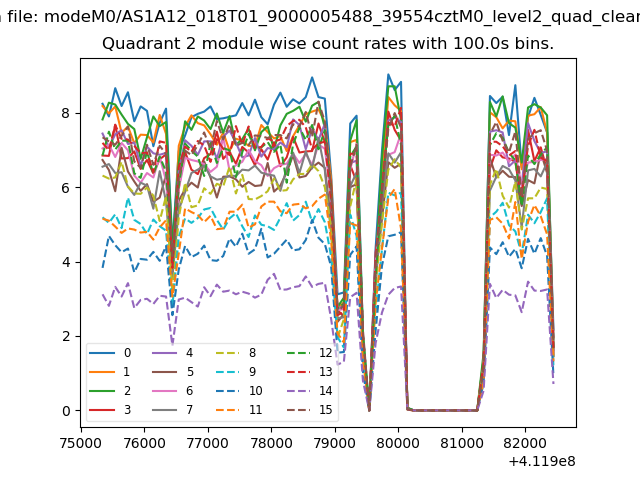
| Module-wise count rates for Quadrant B Data is divided into 100 sec bins |
 |
 |
| Module-wise count rates for Quadrant C Data is divided into 100 sec bins |
 |
 |
| Module-wise count rates for Quadrant D Data is divided into 100 sec bins |
 |
 |
| Parameter | Plot |
|---|---|
| CZT HV Monitor |  |
| D_VDD | 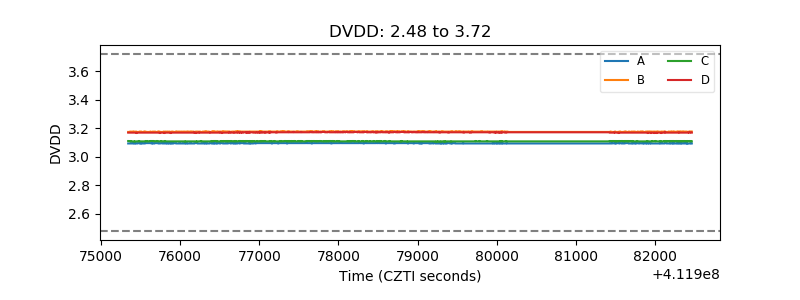 |
| Temperature 1 | 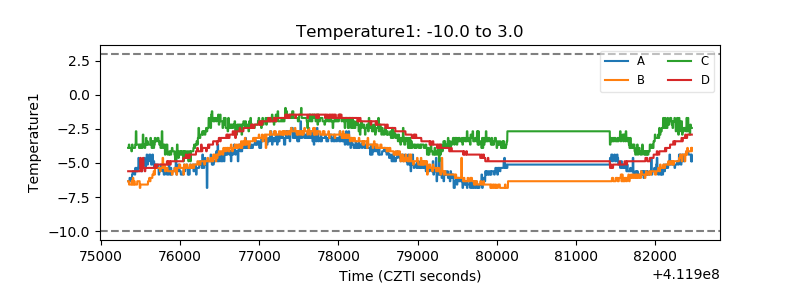 |
| Veto HV Monitor | 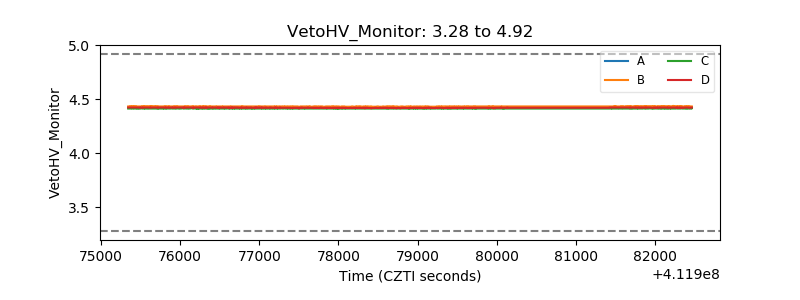 |
| Veto LLD | 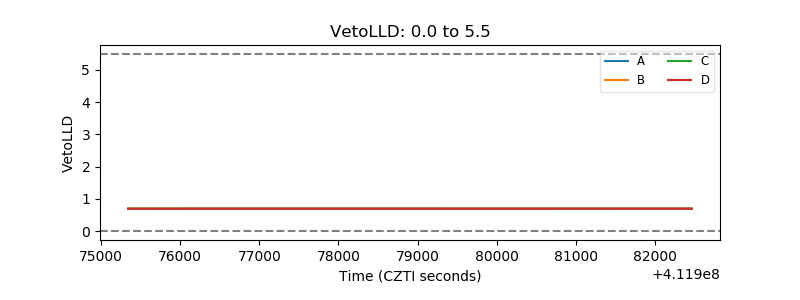 |
| Alpha Counter | 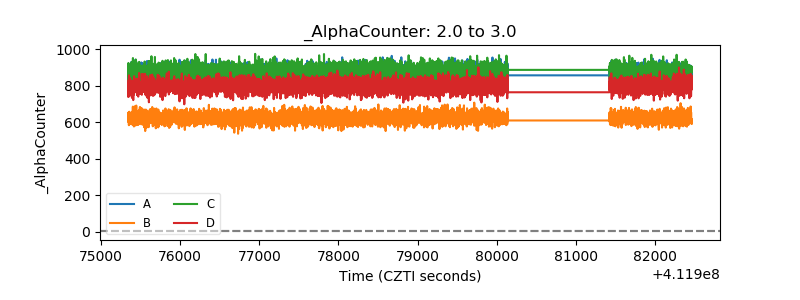 |
| _CPM_Rate | 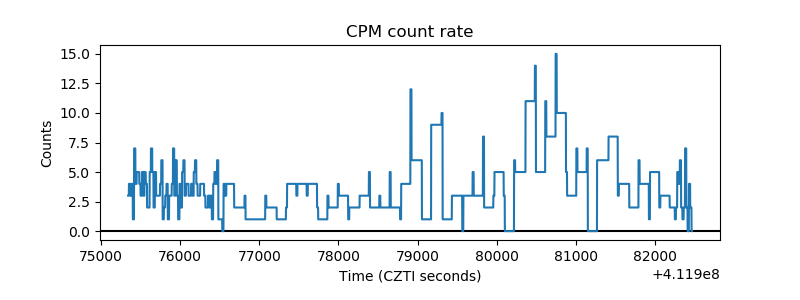 |
| CZT Counter | 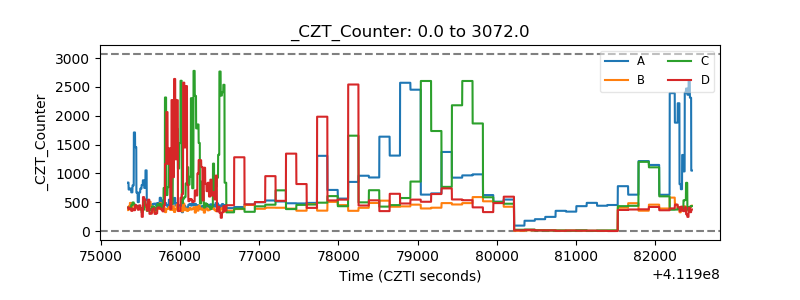 |
| +2.5 Volts monitor | 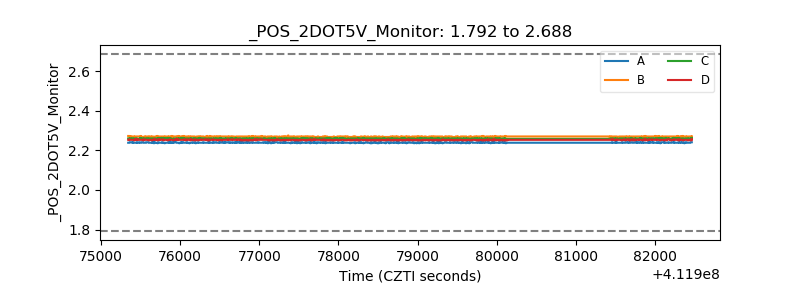 |
| +5 Volts monitor | 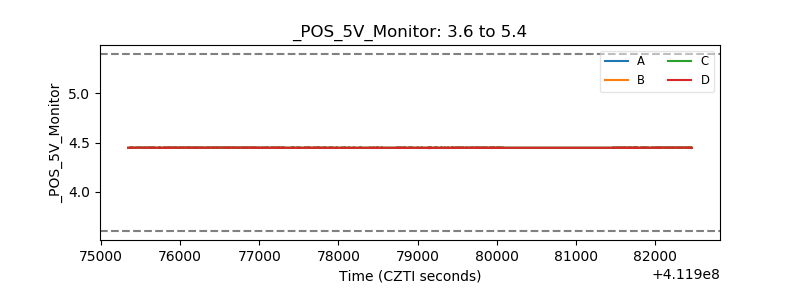 |
| _ROLL_ROT | 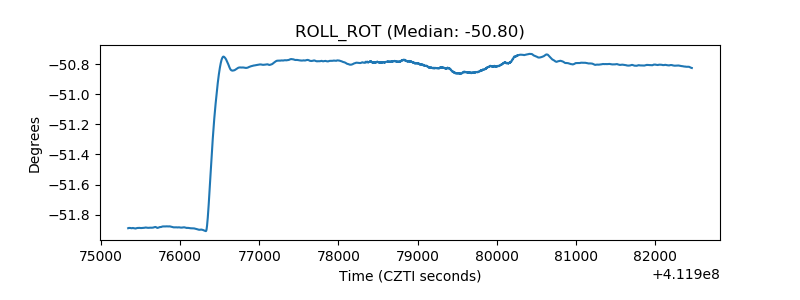 |
| _Roll_DEC | 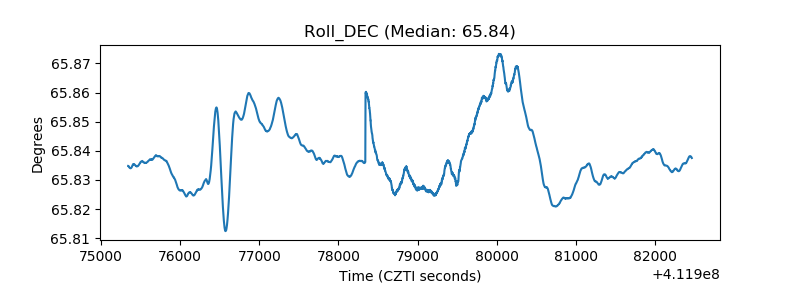 |
| _Roll_RA |  |
| Veto Counter | 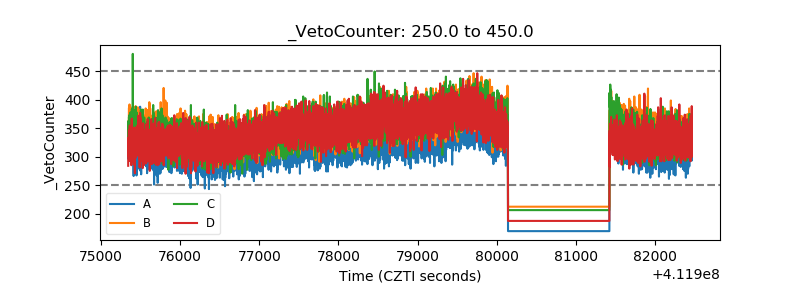 |