| Param | Original file | Final file |
|---|---|---|
| Filename | modeM0/AS1A12_018T01_9000005488_39556cztM0_level2.fits | modeM0/AS1A12_018T01_9000005488_39556cztM0_level2_quad_clean.evt |
| Size (bytes) | 796,878,720 | 167,114,880 |
| Size | 760.0 MB | 159.4 MB |
| Events in quadrant A | 8,602,191 | 1,122,201 |
| Events in quadrant B | 4,744,750 | 1,179,265 |
| Events in quadrant C | 8,004,892 | 1,067,375 |
| Events in quadrant D | 7,328,547 | 959,314 |
| Mode SS | |||
|---|---|---|---|
| Quadrant | BADHDUFLAG | Total packets | Discarded packets |
| A | 0 | 216 | 0 |
| B | 0 | 216 | 0 |
| C | 0 | 216 | 0 |
| D | 0 | 216 | 0 |
| Mode M0 | |||
|---|---|---|---|
| Quadrant | BADHDUFLAG | Total packets | Discarded packets |
| A | 0 | 32307 | 3 |
| B | 0 | 21772 | 2 |
| C | 0 | 30697 | 2 |
| D | 0 | 29417 | 2 |
| Mode M9 | |||
|---|---|---|---|
| Quadrant | BADHDUFLAG | Total packets | Discarded packets |
| A | 0 | 27 | 0 |
| B | 0 | 27 | 0 |
| C | 0 | 27 | 0 |
| D | 0 | 27 | 0 |
| Quadrant | Total seconds | Saturated seconds | Saturation percentage |
|---|---|---|---|
| A | 10561 | 451 | 4.270429% |
| B | 10561 | 35 | 0.331408% |
| C | 10561 | 450 | 4.260960% |
| D | 10561 | 725 | 6.864880% |
Noise dominated data is calculated using 1-second bins in cleaned event files. If a bin has >2000 counts, and if more than 50% of those come from <1% of pixels, then it is considered to be noise-dominated and hence unusable.
| Quadrant | # 1 sec bins | Bins with >0 counts | Bins with >2000 counts | High rate bins dominated by noise | Noise dominated (total time) | Noise dominated (detector-on time) | Marked lightcurve |
|---|---|---|---|---|---|---|---|
| A | 13339 | 10563 | 385 | 385 | 2.89% | 3.64% | 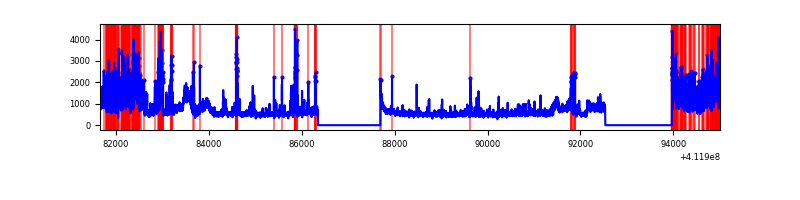 |
| B | 13339 | 10563 | 8 | 8 | 0.06% | 0.08% | 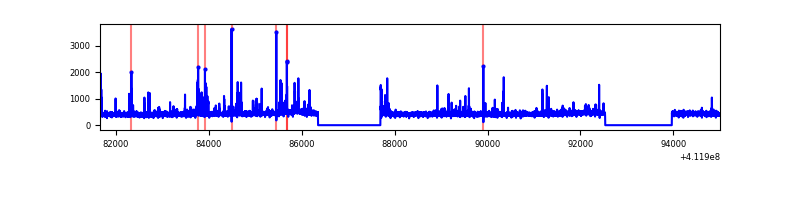 |
| C | 13339 | 10563 | 465 | 465 | 3.49% | 4.40% | 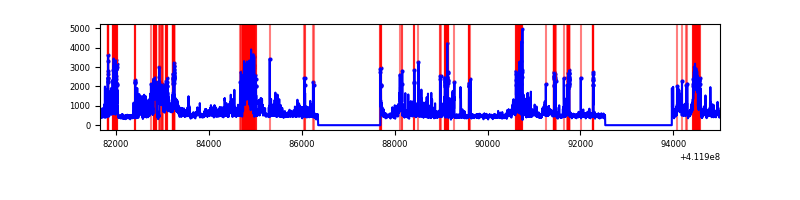 |
| D | 13339 | 10563 | 684 | 684 | 5.13% | 6.48% | 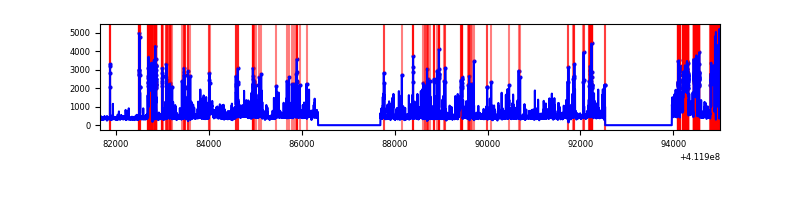 |
Top three noisy pixels from each quadrant. If the there are fewer than three noisy pixels in the level2.evt file, extra rows are filled as -1
| Pixel properties | Quadrant properties | ||||||
|---|---|---|---|---|---|---|---|
| Quadrant | DetID | PixID | Counts | Sigma | Mean | Median | Sigma |
| A | 15 | 222 | 3307202 | 14625.52 | 1119 | 1094 | 226.1 |
| A | 10 | 83 | 704549 | 3111.94 | 1119 | 1094 | 226.1 |
| A | 9 | 143 | 160103 | 703.42 | 1119 | 1094 | 226.1 |
| B | 5 | 172 | 162799 | 753.46 | 1125 | 1095 | 214.6 |
| B | 5 | 255 | 110754 | 510.96 | 1125 | 1095 | 214.6 |
| B | 12 | 111 | 27652 | 123.74 | 1125 | 1095 | 214.6 |
| C | 9 | 187 | 2739872 | 10782.33 | 1088 | 1093 | 254.0 |
| C | 15 | 208 | 564131 | 2216.63 | 1088 | 1093 | 254.0 |
| C | 15 | 214 | 429451 | 1686.41 | 1088 | 1093 | 254.0 |
| D | 12 | 227 | 2334693 | 8928.49 | 1070 | 1039 | 261.4 |
| D | 1 | 52 | 277783 | 1058.81 | 1070 | 1039 | 261.4 |
| D | 13 | 249 | 203342 | 774.01 | 1070 | 1039 | 261.4 |
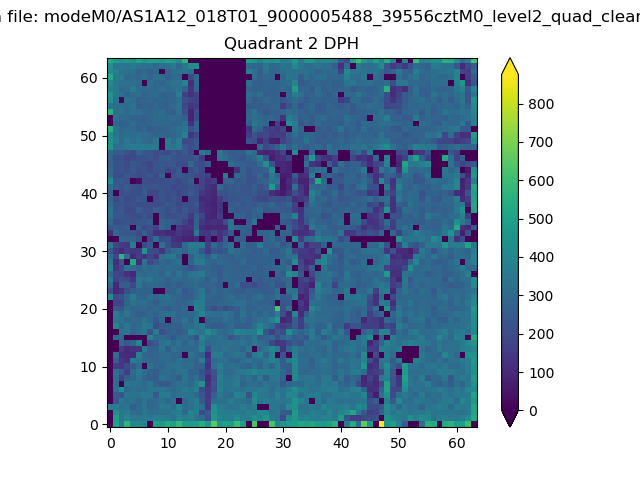
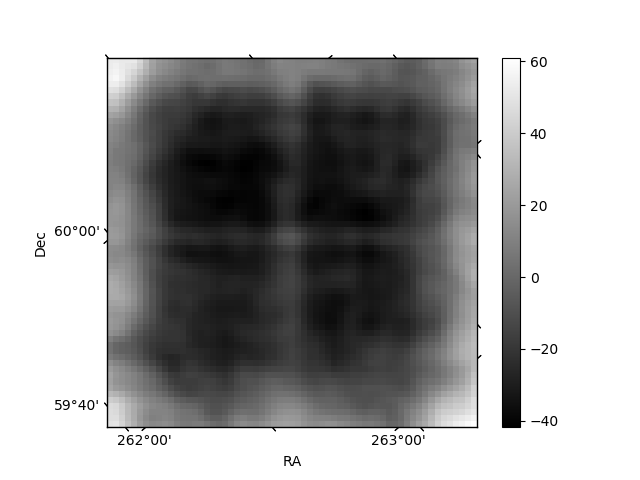
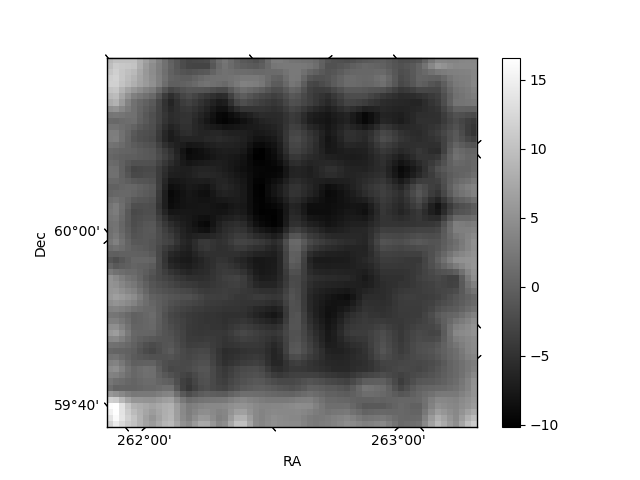
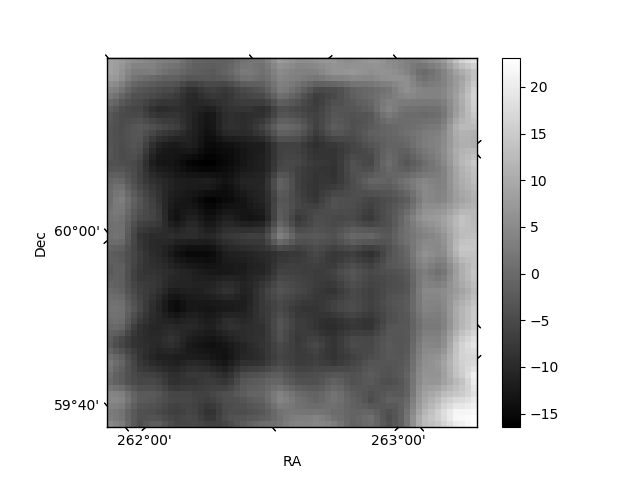
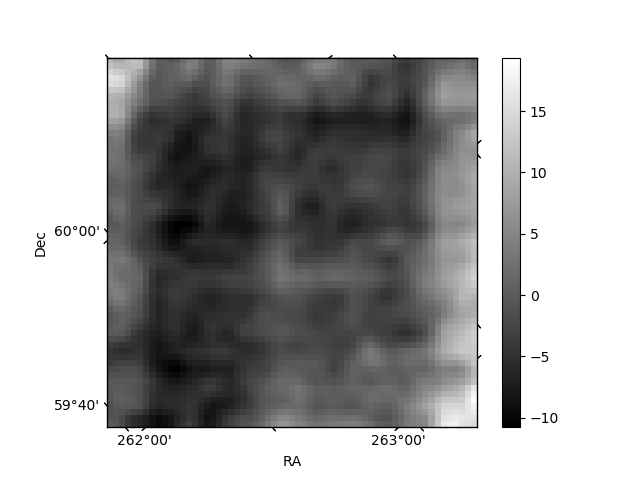
Histogram calculated using DETX and DETY for each event in the final _common_clean file
| Quadrant A | 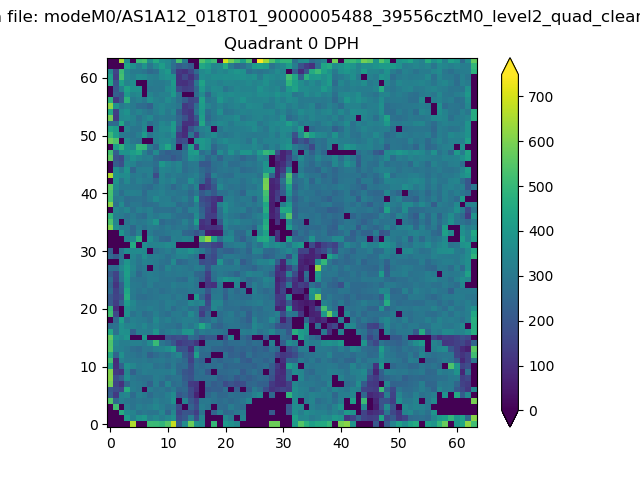 |
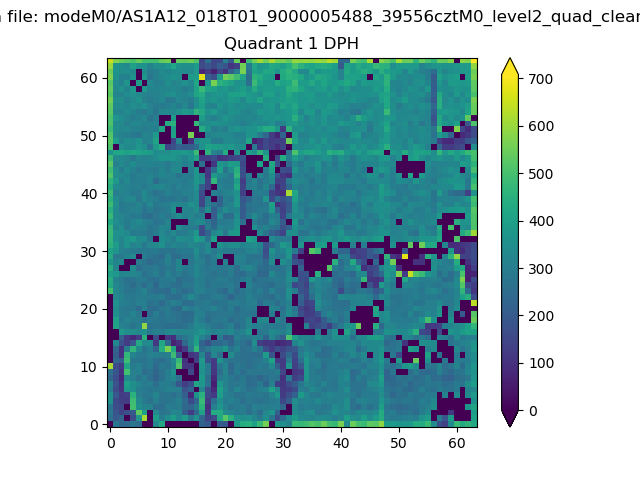 |
Quadrant B |
|---|---|---|---|
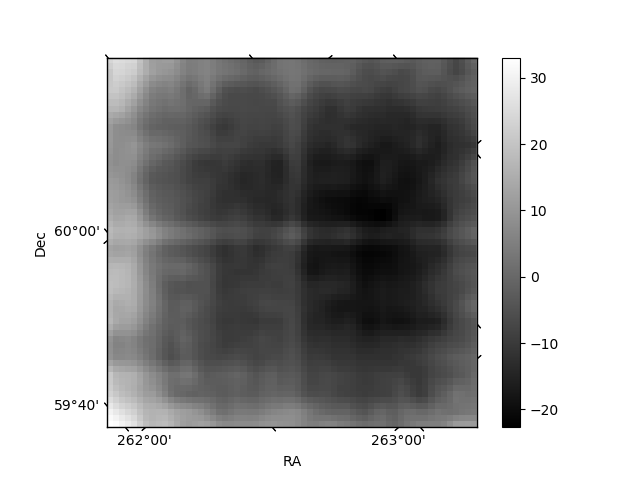
| Quadrant D | 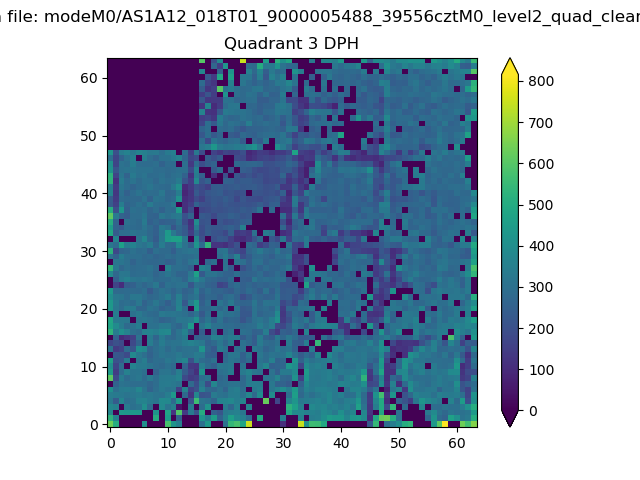 |
 |
Quadrant C |
| Plot type | Count rate plots | Images |
|---|---|---|
| Comparison with Poisson distribution Blue bars denote a histogram of data divided into 1 sec bins. Red curve is a Poisson curve with rate = median count rate of data. |
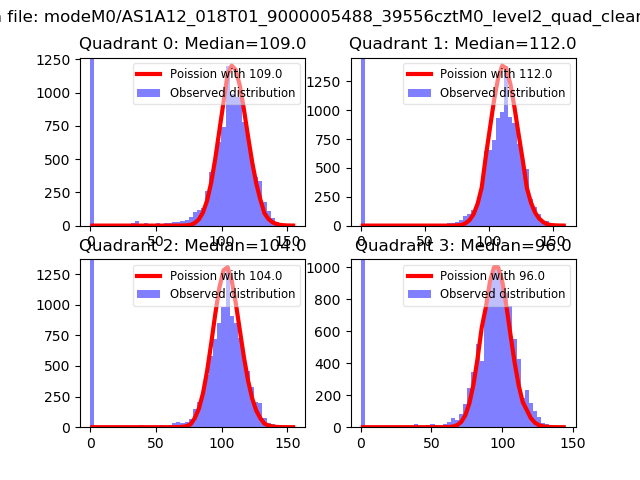 |
 |
| Quadrant-wise count rates Data is divided into 100 sec bins |
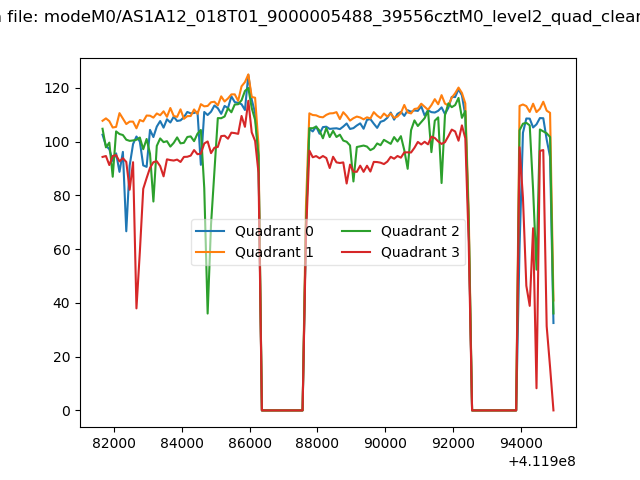 |
|
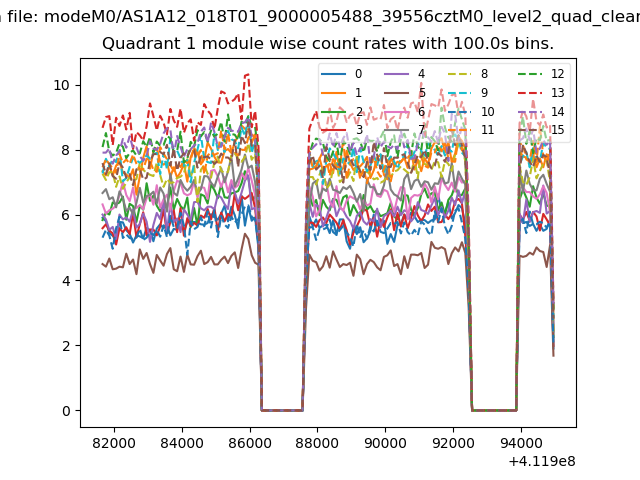
| Module-wise count rates for Quadrant A Data is divided into 100 sec bins |
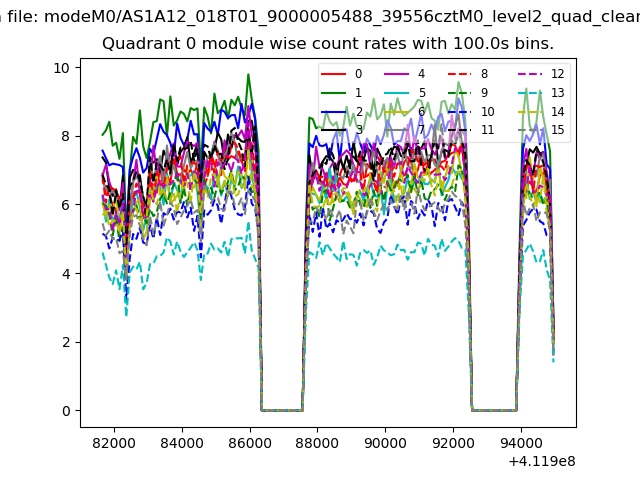 |
 |
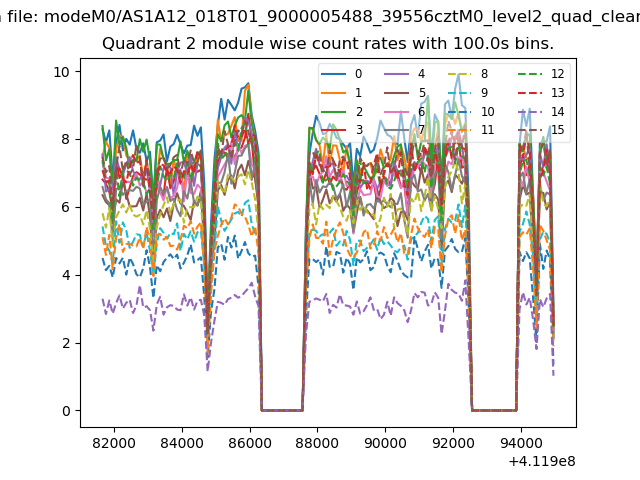
| Module-wise count rates for Quadrant B Data is divided into 100 sec bins |
 |
 |
| Module-wise count rates for Quadrant C Data is divided into 100 sec bins |
 |
 |
| Module-wise count rates for Quadrant D Data is divided into 100 sec bins |
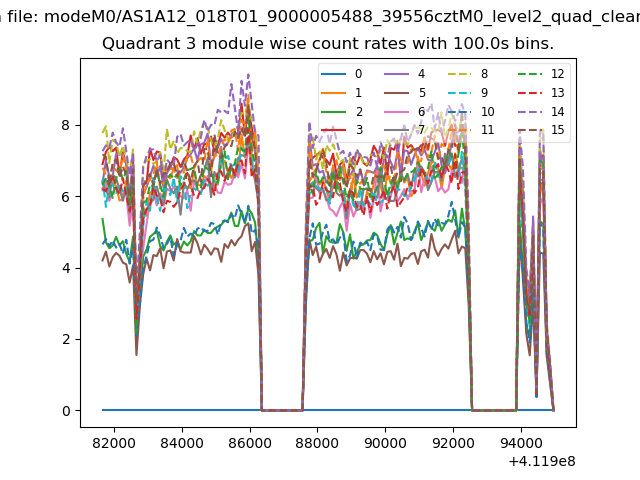 |
 |
| Parameter | Plot |
|---|---|
| CZT HV Monitor | 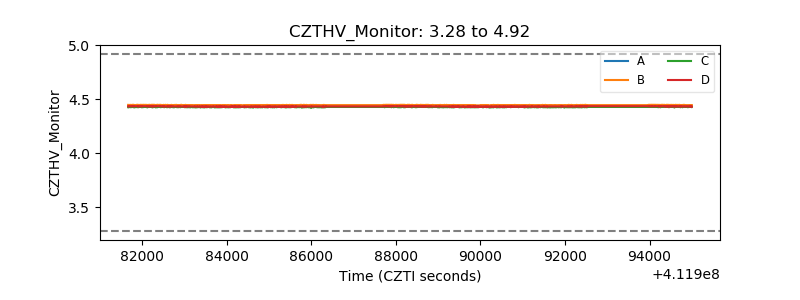 |
| D_VDD | 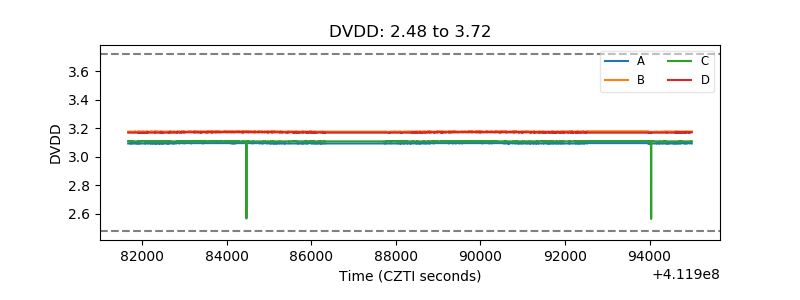 |
| Temperature 1 | 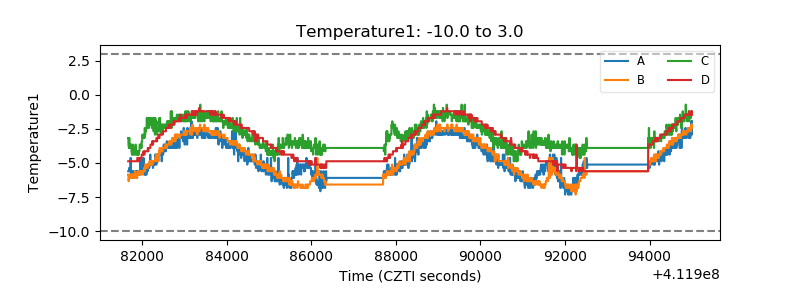 |
| Veto HV Monitor | 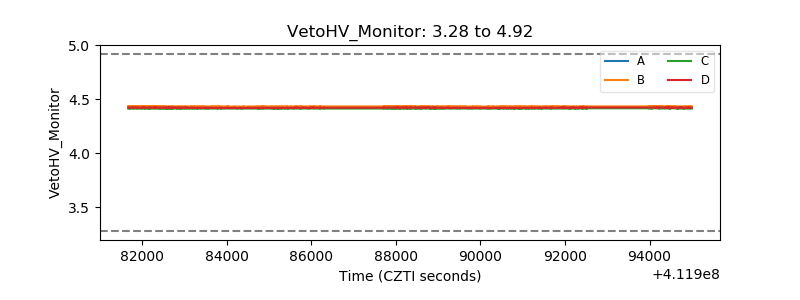 |
| Veto LLD | 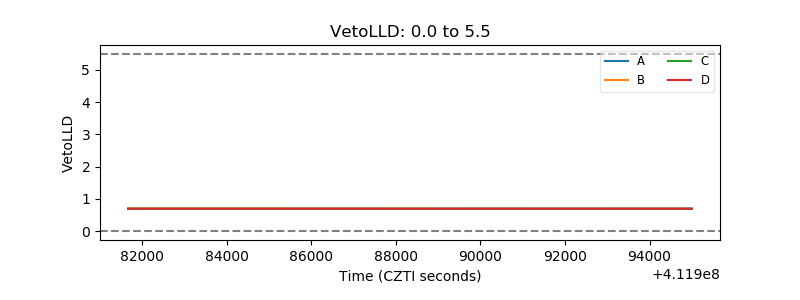 |
| Alpha Counter | 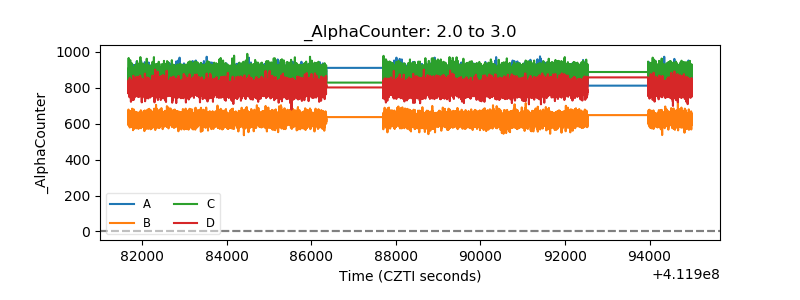 |
| _CPM_Rate | 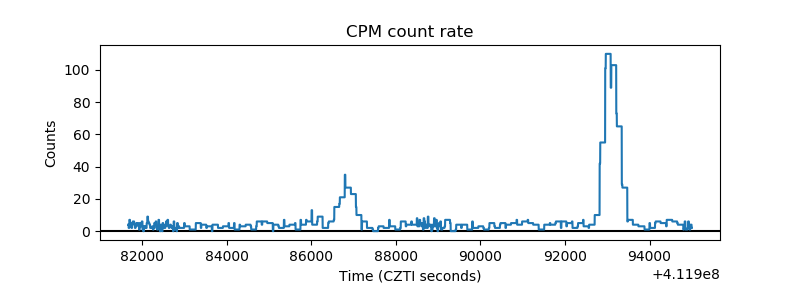 |
| CZT Counter | 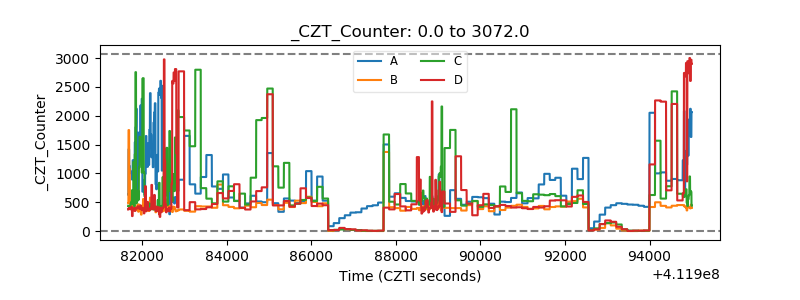 |
| +2.5 Volts monitor | 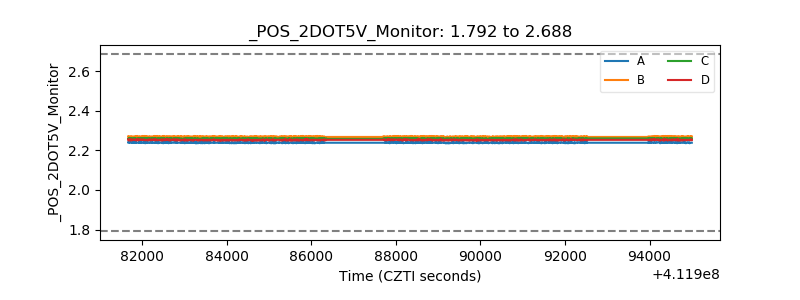 |
| +5 Volts monitor | 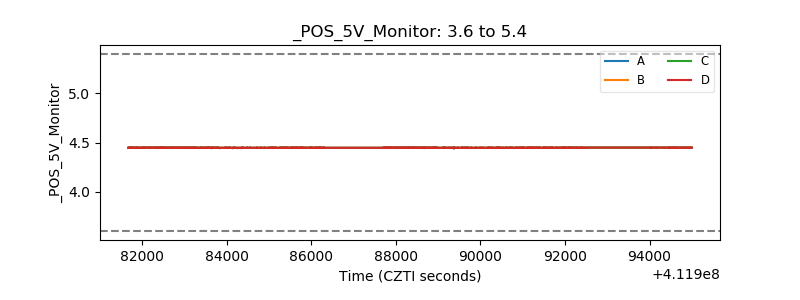 |
| _ROLL_ROT | 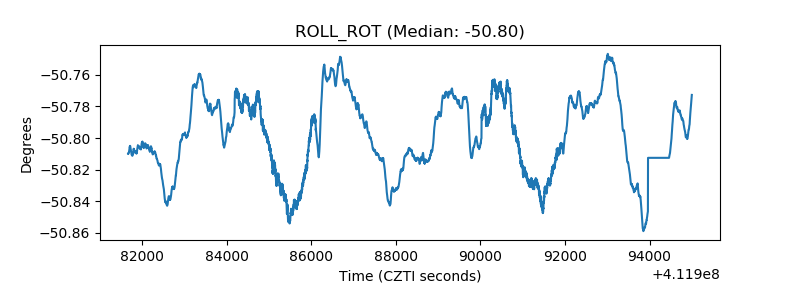 |
| _Roll_DEC | 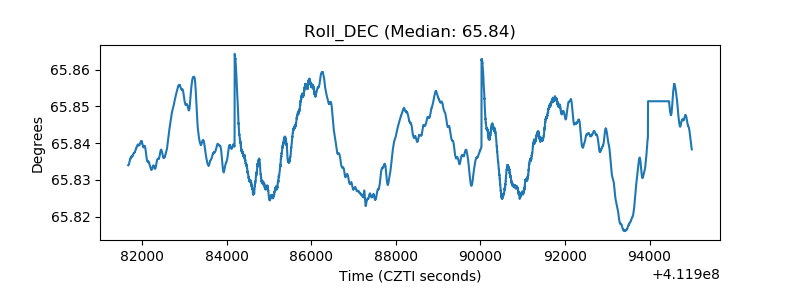 |
| _Roll_RA | 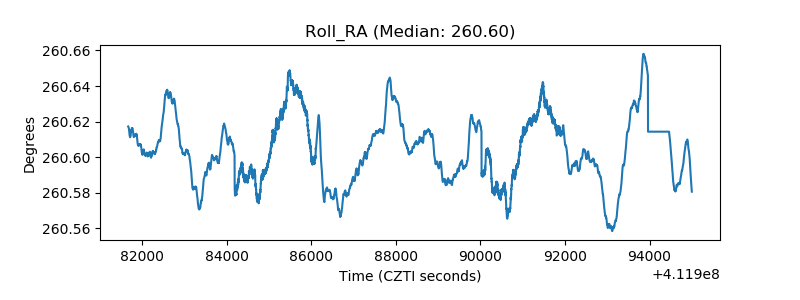 |
| Veto Counter | 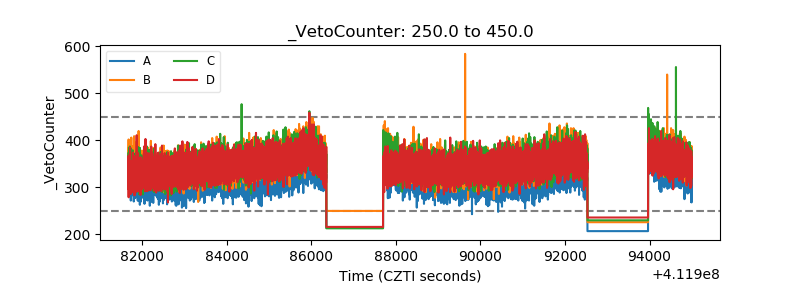 |