| Param | Original file | Final file |
|---|---|---|
| Filename | modeM0/AS1A12_018T01_9000005488_39557cztM0_level2.fits | modeM0/AS1A12_018T01_9000005488_39557cztM0_level2_quad_clean.evt |
| Size (bytes) | 529,574,400 | 87,396,480 |
| Size | 505.0 MB | 83.3 MB |
| Events in quadrant A | 6,422,872 | 551,075 |
| Events in quadrant B | 2,473,183 | 641,728 |
| Events in quadrant C | 4,149,085 | 578,245 |
| Events in quadrant D | 6,116,118 | 476,644 |
| Mode SS | |||
|---|---|---|---|
| Quadrant | BADHDUFLAG | Total packets | Discarded packets |
| A | 0 | 116 | 0 |
| B | 0 | 116 | 0 |
| C | 0 | 116 | 0 |
| D | 0 | 116 | 0 |
| Mode M0 | |||
|---|---|---|---|
| Quadrant | BADHDUFLAG | Total packets | Discarded packets |
| A | 0 | 23011 | 3 |
| B | 0 | 11489 | 2 |
| C | 0 | 16061 | 2 |
| D | 0 | 22053 | 2 |
| Mode M9 | |||
|---|---|---|---|
| Quadrant | BADHDUFLAG | Total packets | Discarded packets |
| A | 0 | 17 | 0 |
| B | 0 | 17 | 0 |
| C | 0 | 17 | 0 |
| D | 0 | 18 | 0 |
| Quadrant | Total seconds | Saturated seconds | Saturation percentage |
|---|---|---|---|
| A | 5696 | 903 | 15.853230% |
| B | 5696 | 9 | 0.158006% |
| C | 5696 | 254 | 4.459270% |
| D | 5696 | 1012 | 17.766854% |
Noise dominated data is calculated using 1-second bins in cleaned event files. If a bin has >2000 counts, and if more than 50% of those come from <1% of pixels, then it is considered to be noise-dominated and hence unusable.
| Quadrant | # 1 sec bins | Bins with >0 counts | Bins with >2000 counts | High rate bins dominated by noise | Noise dominated (total time) | Noise dominated (detector-on time) | Marked lightcurve |
|---|---|---|---|---|---|---|---|
| A | 7280 | 5697 | 747 | 747 | 10.26% | 13.11% | 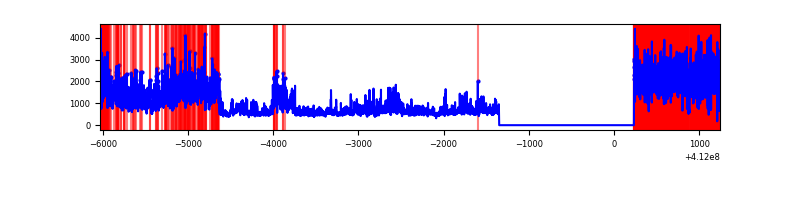 |
| B | 7280 | 5697 | 1 | 1 | 0.01% | 0.02% | 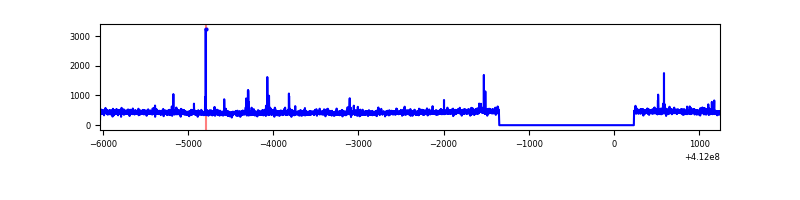 |
| C | 7280 | 5697 | 234 | 234 | 3.21% | 4.11% | 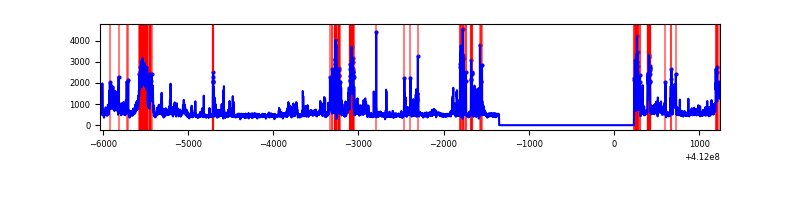 |
| D | 7280 | 5697 | 898 | 898 | 12.34% | 15.76% | 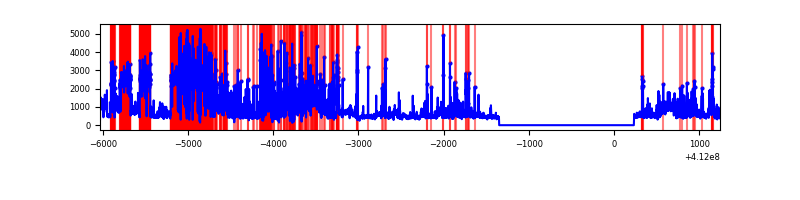 |
Top three noisy pixels from each quadrant. If the there are fewer than three noisy pixels in the level2.evt file, extra rows are filled as -1
| Pixel properties | Quadrant properties | ||||||
|---|---|---|---|---|---|---|---|
| Quadrant | DetID | PixID | Counts | Sigma | Mean | Median | Sigma |
| A | 15 | 222 | 3676612 | 30566.75 | 590 | 578 | 120.3 |
| A | 10 | 83 | 421043 | 3496.23 | 590 | 578 | 120.3 |
| A | 13 | 248 | 11847 | 93.7 | 590 | 578 | 120.3 |
| B | 5 | 255 | 32314 | 268.65 | 610 | 594 | 118.1 |
| B | 0 | 214 | 18913 | 155.15 | 610 | 594 | 118.1 |
| B | 12 | 111 | 14880 | 120.99 | 610 | 594 | 118.1 |
| C | 9 | 187 | 1137309 | 8155.64 | 589 | 592 | 139.4 |
| C | 15 | 208 | 464854 | 3330.95 | 589 | 592 | 139.4 |
| C | 15 | 214 | 236069 | 1689.48 | 589 | 592 | 139.4 |
| D | 12 | 227 | 3240287 | 23941.75 | 546 | 529 | 135.3 |
| D | 1 | 52 | 359344 | 2651.64 | 546 | 529 | 135.3 |
| D | 13 | 249 | 131803 | 970.11 | 546 | 529 | 135.3 |
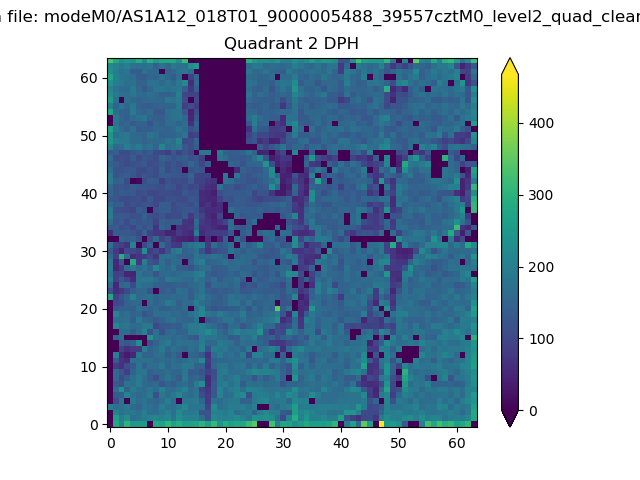
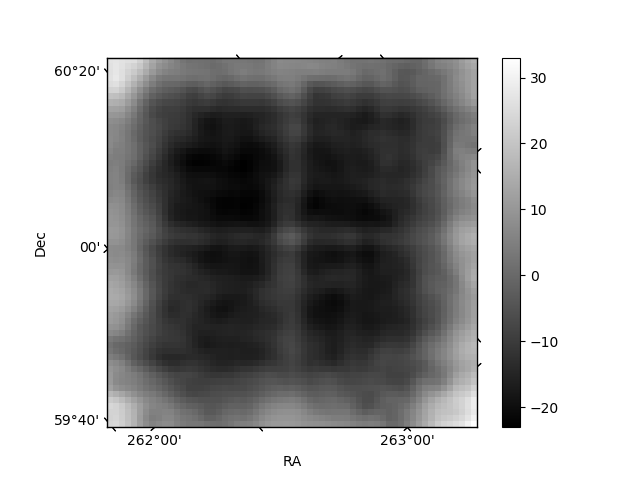
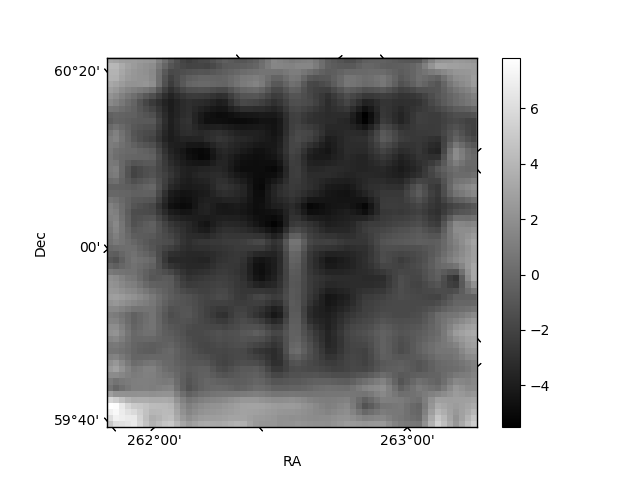
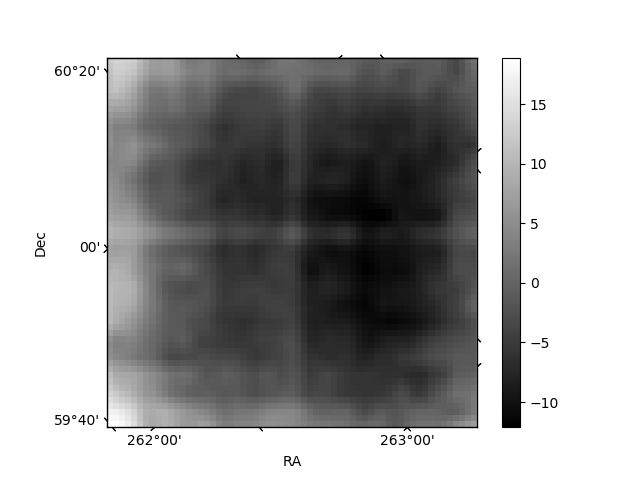
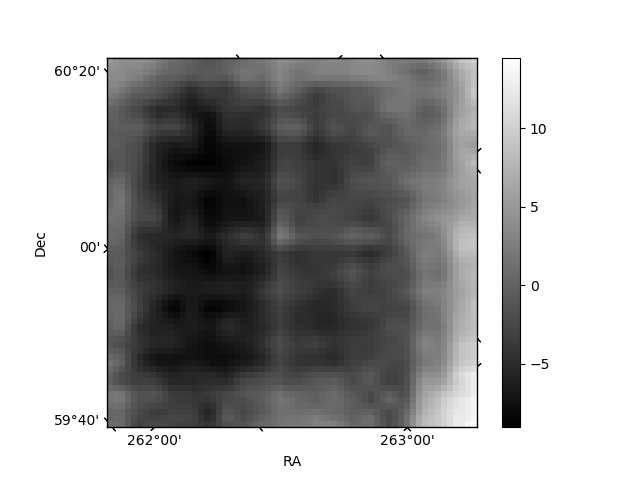
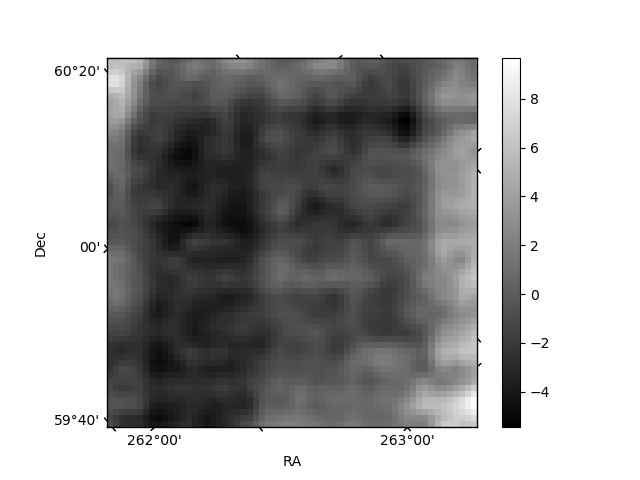
Histogram calculated using DETX and DETY for each event in the final _common_clean file
| Quadrant A | 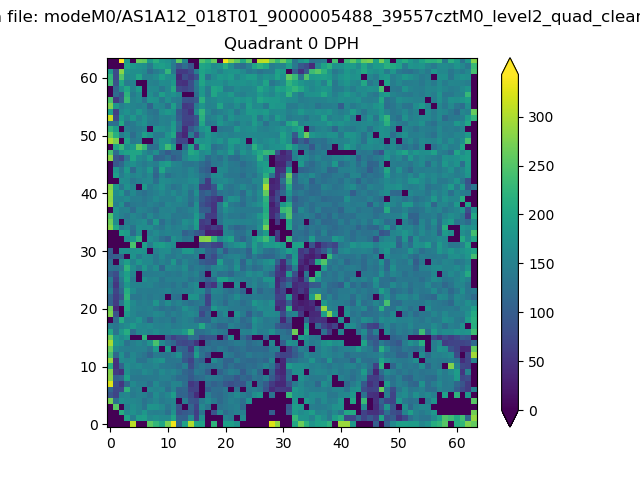 |
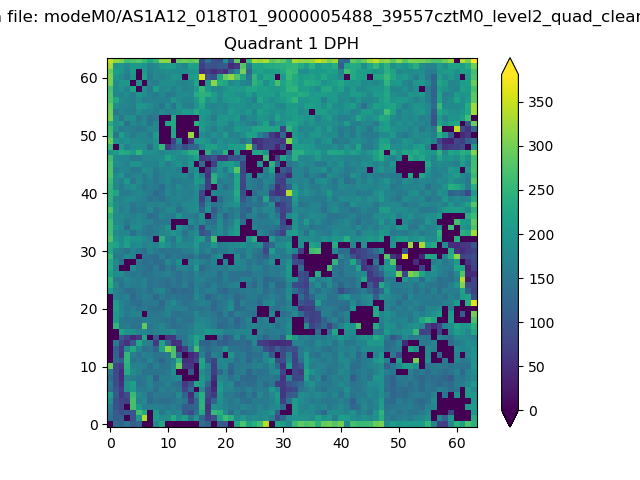 |
Quadrant B |
|---|---|---|---|
| Quadrant D | 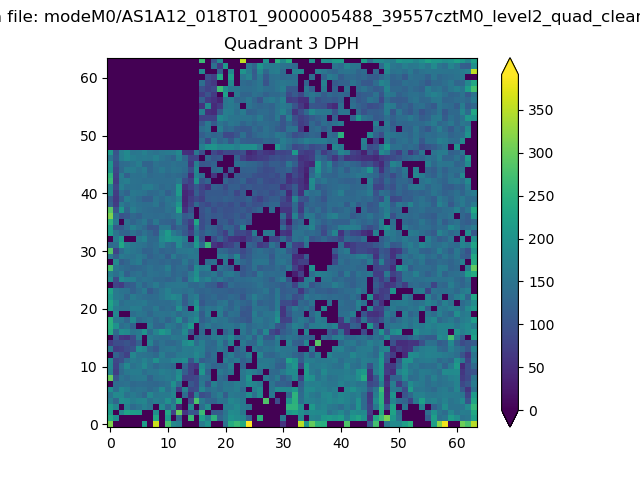 |
 |
Quadrant C |
| Plot type | Count rate plots | Images |
|---|---|---|
| Comparison with Poisson distribution Blue bars denote a histogram of data divided into 1 sec bins. Red curve is a Poisson curve with rate = median count rate of data. |
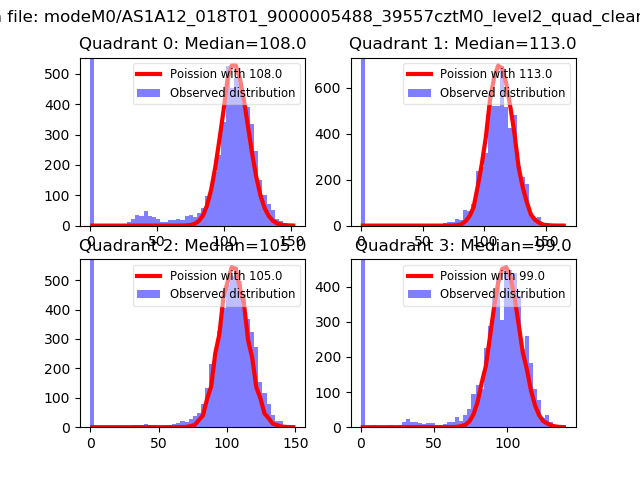 |
 |
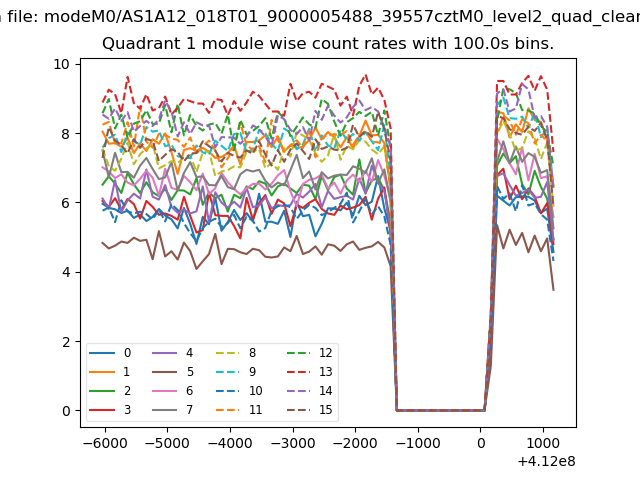
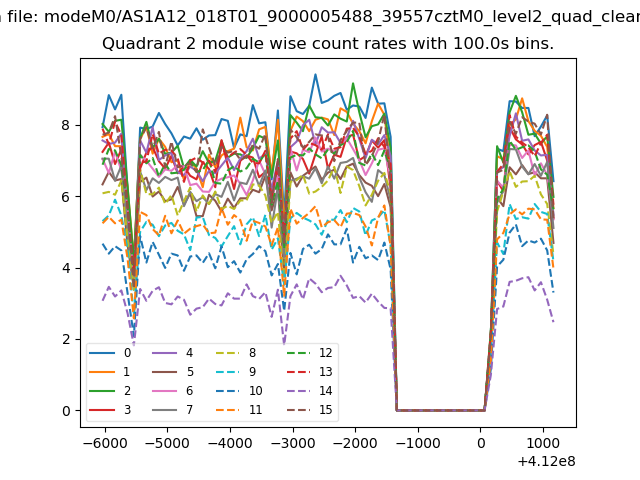
| Quadrant-wise count rates Data is divided into 100 sec bins |
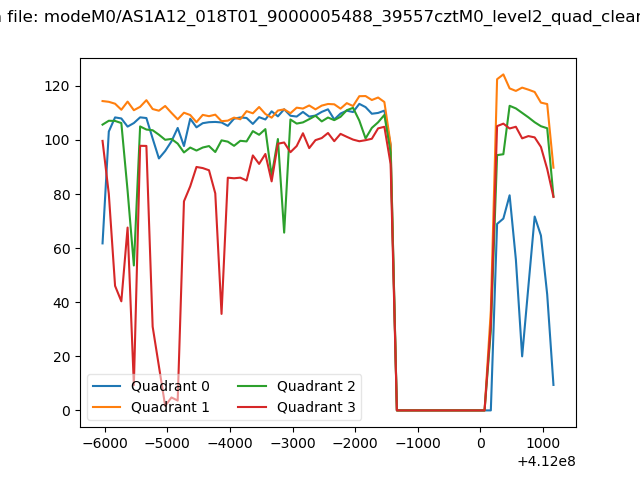 |
|
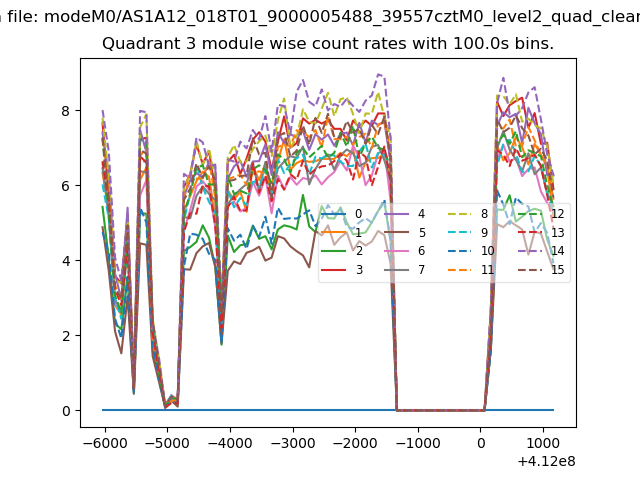
| Module-wise count rates for Quadrant A Data is divided into 100 sec bins |
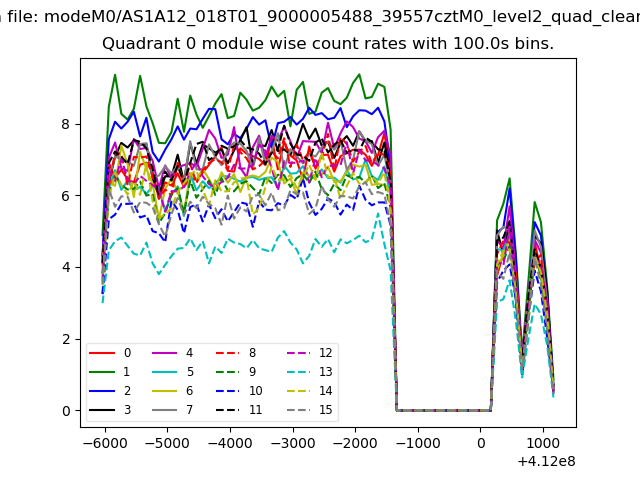 |
 |
| Module-wise count rates for Quadrant B Data is divided into 100 sec bins |
 |
 |
| Module-wise count rates for Quadrant C Data is divided into 100 sec bins |
 |
 |
| Module-wise count rates for Quadrant D Data is divided into 100 sec bins |
 |
 |
| Parameter | Plot |
|---|---|
| CZT HV Monitor | 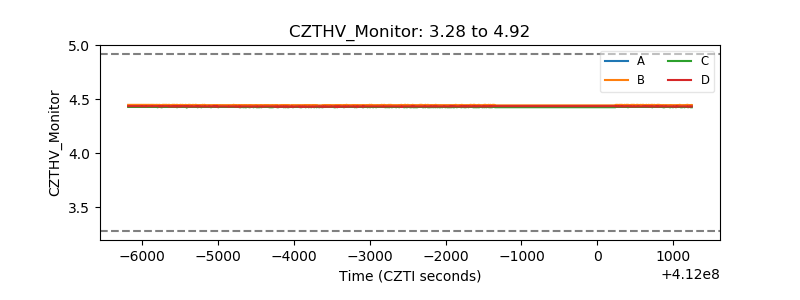 |
| D_VDD | 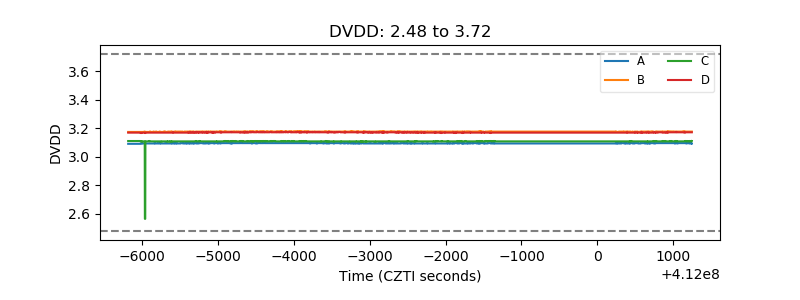 |
| Temperature 1 | 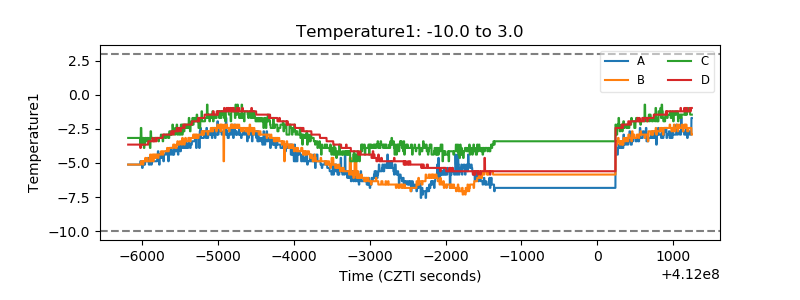 |
| Veto HV Monitor |  |
| Veto LLD | 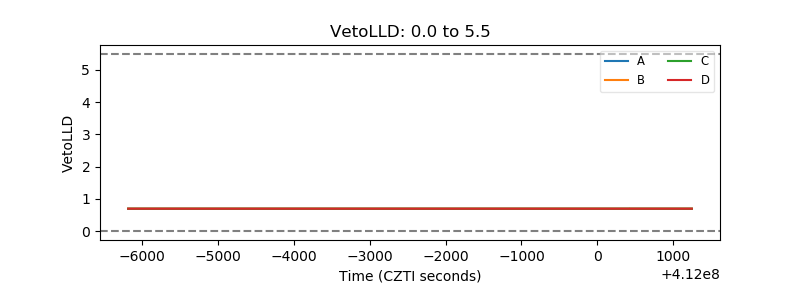 |
| Alpha Counter | 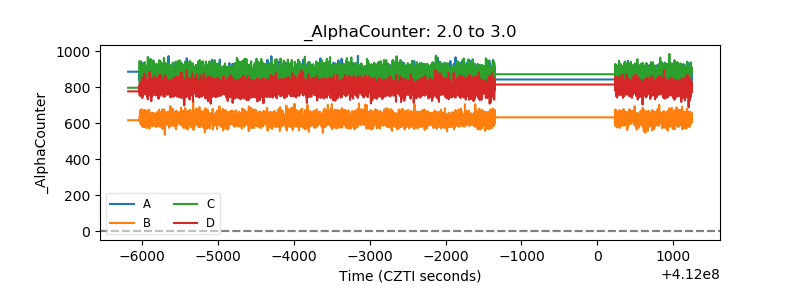 |
| _CPM_Rate | 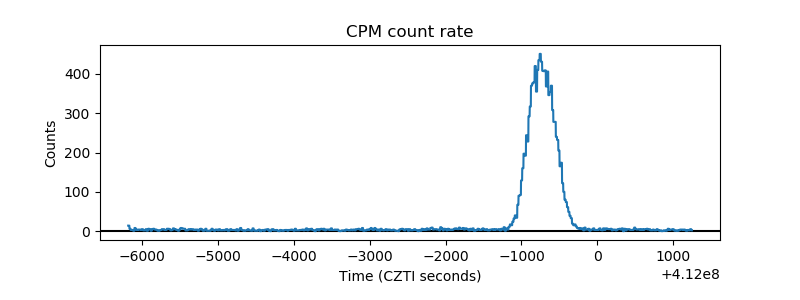 |
| CZT Counter | 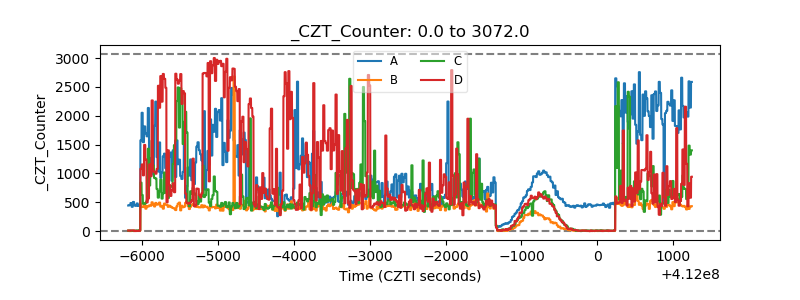 |
| +2.5 Volts monitor | 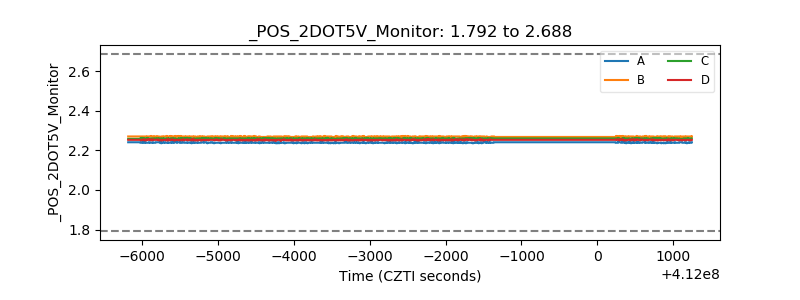 |
| +5 Volts monitor | 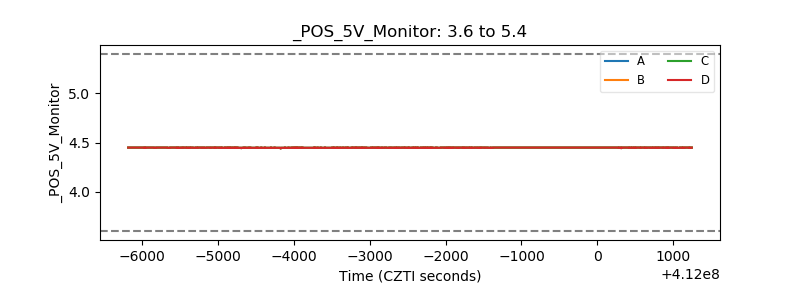 |
| _ROLL_ROT | 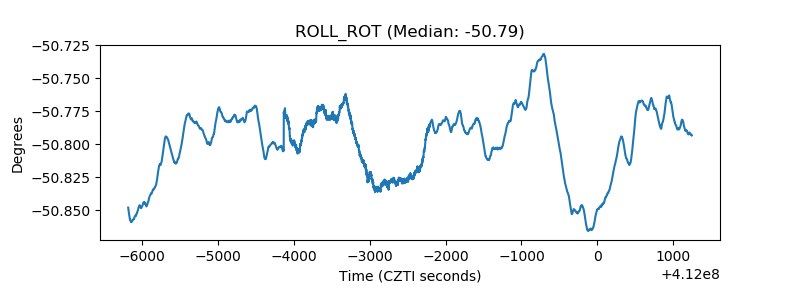 |
| _Roll_DEC | 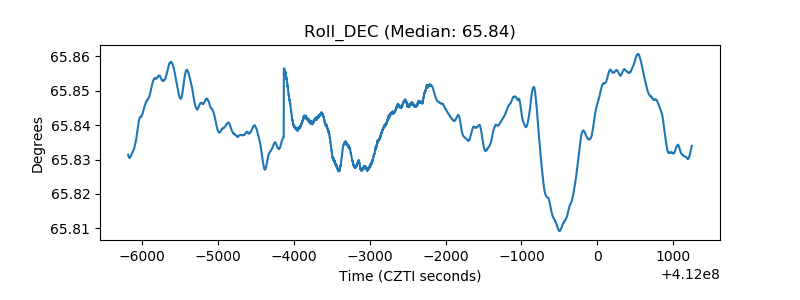 |
| _Roll_RA | 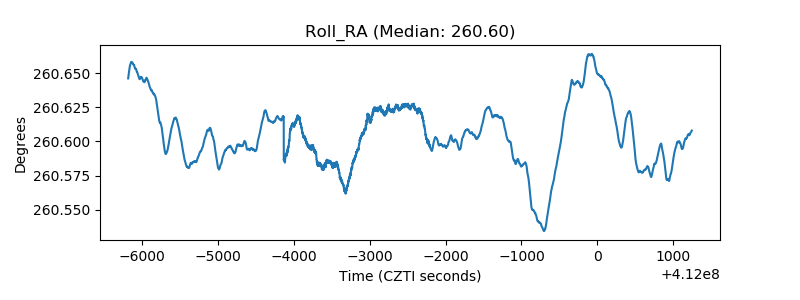 |
| Veto Counter | 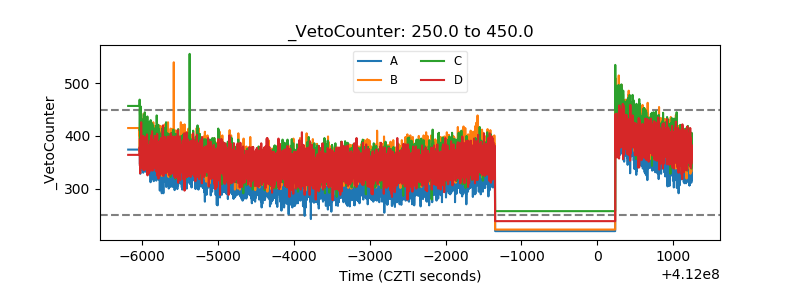 |