| Param | Original file | Final file |
|---|---|---|
| Filename | modeM0/AS1A12_018T01_9000005488_39558cztM0_level2.fits | modeM0/AS1A12_018T01_9000005488_39558cztM0_level2_quad_clean.evt |
| Size (bytes) | 568,978,560 | 85,662,720 |
| Size | 542.6 MB | 81.7 MB |
| Events in quadrant A | 9,417,520 | 437,458 |
| Events in quadrant B | 2,420,866 | 638,545 |
| Events in quadrant C | 4,394,321 | 588,998 |
| Events in quadrant D | 4,401,764 | 542,827 |
| Mode SS | |||
|---|---|---|---|
| Quadrant | BADHDUFLAG | Total packets | Discarded packets |
| A | 0 | 112 | 0 |
| B | 0 | 112 | 0 |
| C | 0 | 112 | 0 |
| D | 0 | 112 | 0 |
| Mode M0 | |||
|---|---|---|---|
| Quadrant | BADHDUFLAG | Total packets | Discarded packets |
| A | 0 | 31862 | 3 |
| B | 0 | 11123 | 2 |
| C | 0 | 16702 | 2 |
| D | 0 | 16738 | 2 |
| Mode M9 | |||
|---|---|---|---|
| Quadrant | BADHDUFLAG | Total packets | Discarded packets |
| A | 0 | 17 | 0 |
| B | 0 | 17 | 0 |
| C | 0 | 17 | 0 |
| D | 0 | 18 | 0 |
| Quadrant | Total seconds | Saturated seconds | Saturation percentage |
|---|---|---|---|
| A | 5515 | 2109 | 38.241160% |
| B | 5515 | 6 | 0.108794% |
| C | 5515 | 163 | 2.955576% |
| D | 5515 | 267 | 4.841342% |
Noise dominated data is calculated using 1-second bins in cleaned event files. If a bin has >2000 counts, and if more than 50% of those come from <1% of pixels, then it is considered to be noise-dominated and hence unusable.
| Quadrant | # 1 sec bins | Bins with >0 counts | Bins with >2000 counts | High rate bins dominated by noise | Noise dominated (total time) | Noise dominated (detector-on time) | Marked lightcurve |
|---|---|---|---|---|---|---|---|
| A | 7218 | 5516 | 1874 | 1874 | 25.96% | 33.97% | 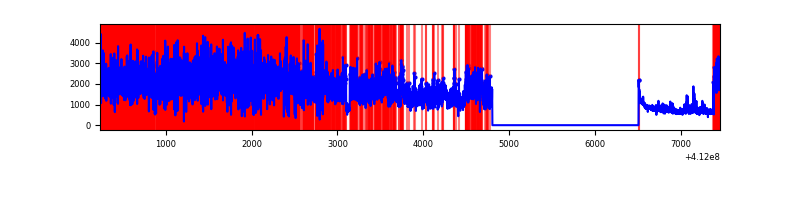 |
| B | 7218 | 5516 | 2 | 2 | 0.03% | 0.04% | 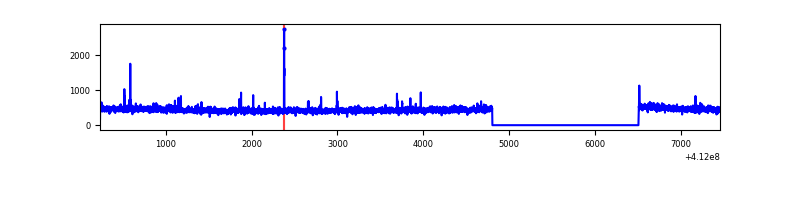 |
| C | 7218 | 5516 | 162 | 162 | 2.24% | 2.94% | 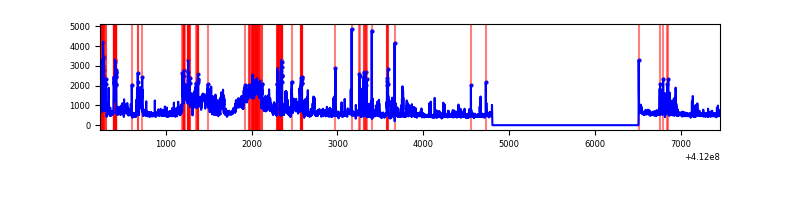 |
| D | 7218 | 5516 | 266 | 266 | 3.69% | 4.82% | 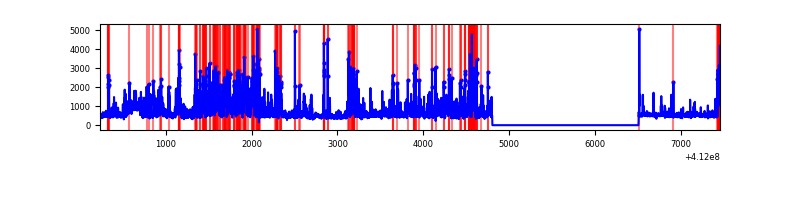 |
Top three noisy pixels from each quadrant. If the there are fewer than three noisy pixels in the level2.evt file, extra rows are filled as -1
| Pixel properties | Quadrant properties | ||||||
|---|---|---|---|---|---|---|---|
| Quadrant | DetID | PixID | Counts | Sigma | Mean | Median | Sigma |
| A | 15 | 222 | 6820071 | 61425.33 | 544 | 533 | 111.0 |
| A | 10 | 83 | 415517 | 3737.87 | 544 | 533 | 111.0 |
| A | 13 | 248 | 29558 | 261.44 | 544 | 533 | 111.0 |
| B | 5 | 255 | 22280 | 189.0 | 598 | 581 | 114.8 |
| B | 12 | 111 | 14358 | 120.0 | 598 | 581 | 114.8 |
| B | 0 | 230 | 13388 | 111.55 | 598 | 581 | 114.8 |
| C | 9 | 187 | 1367499 | 10003.22 | 583 | 587 | 136.6 |
| C | 15 | 208 | 483377 | 3533.11 | 583 | 587 | 136.6 |
| C | 15 | 214 | 230230 | 1680.55 | 583 | 587 | 136.6 |
| D | 12 | 227 | 1039119 | 7295.01 | 582 | 565 | 142.4 |
| D | 1 | 52 | 815191 | 5722.1 | 582 | 565 | 142.4 |
| D | 12 | 0 | 152825 | 1069.5 | 582 | 565 | 142.4 |
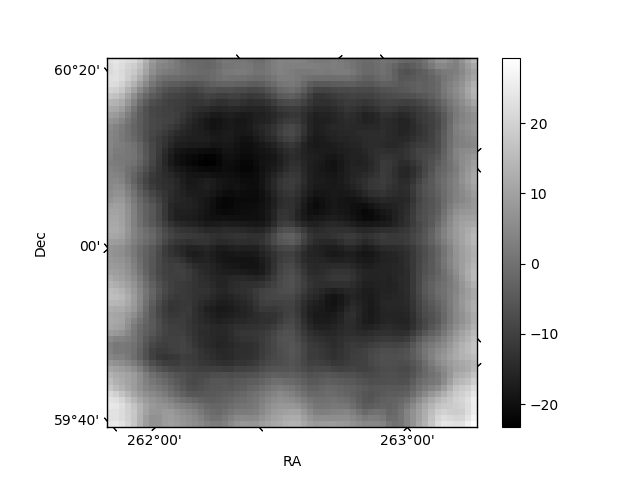
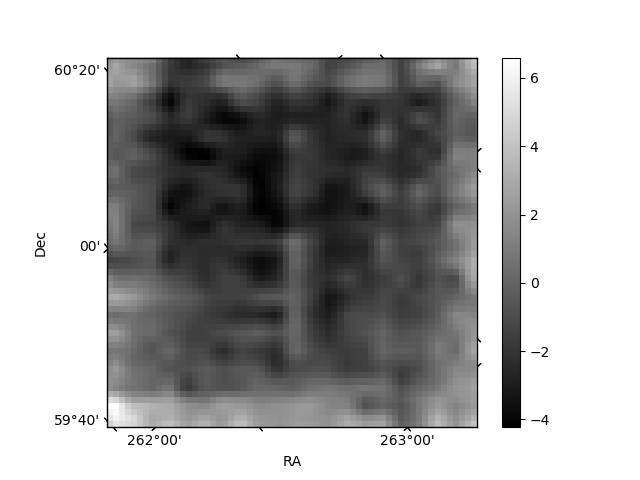
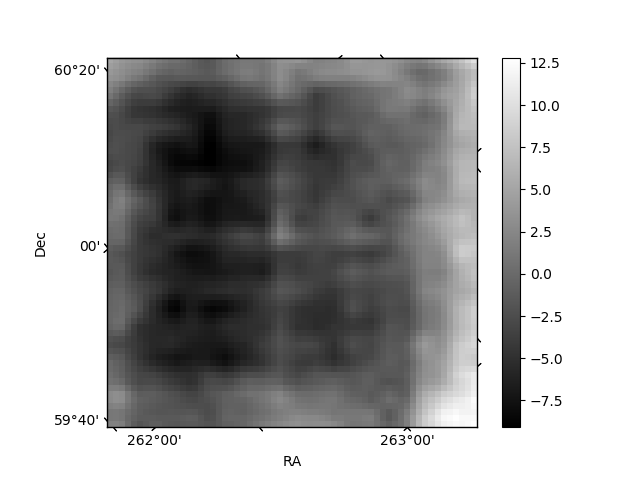
Histogram calculated using DETX and DETY for each event in the final _common_clean file
| Quadrant A | 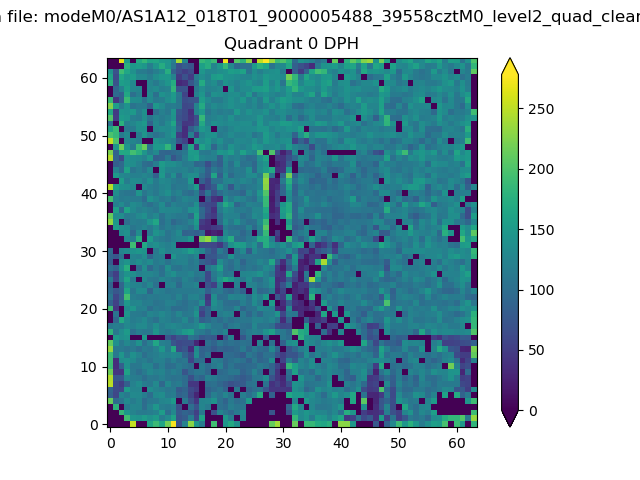 |
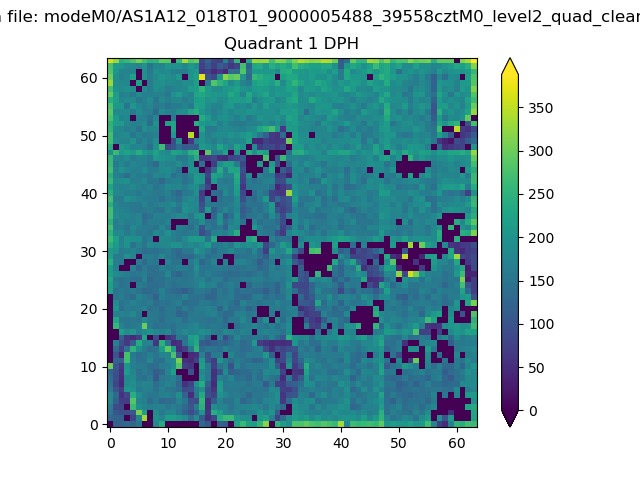 |
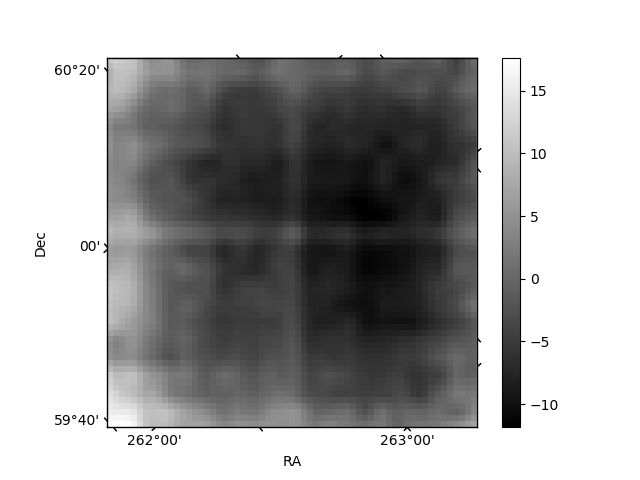
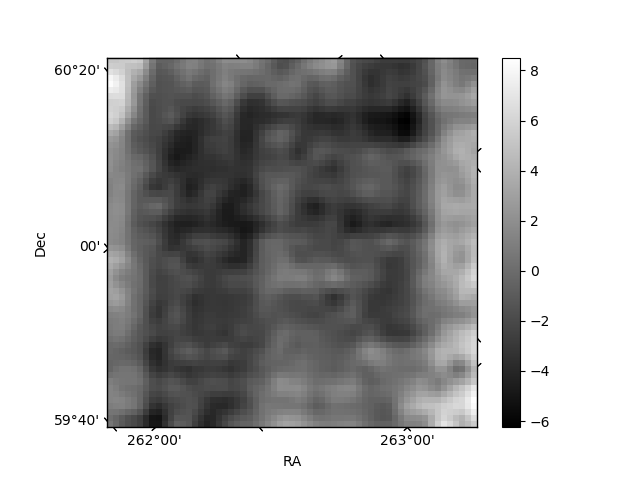
Quadrant B |
|---|---|---|---|
| Quadrant D | 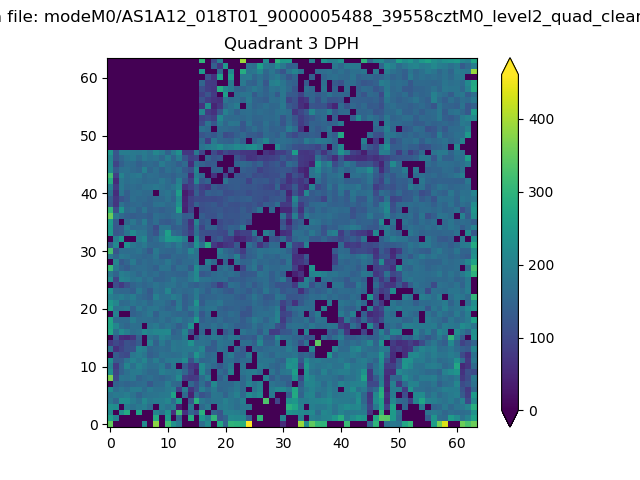 |
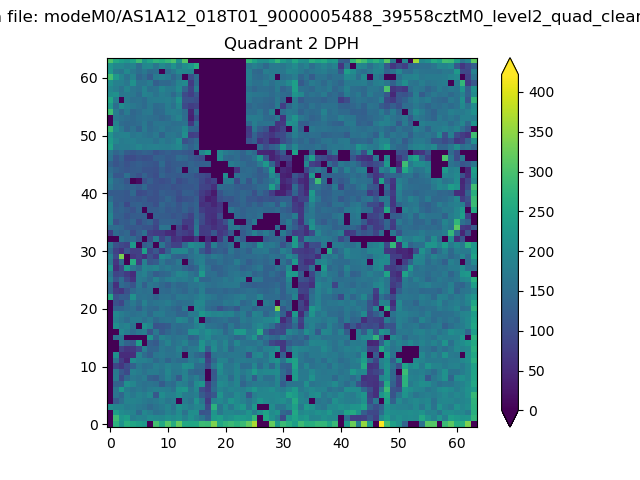 |
Quadrant C |
| Plot type | Count rate plots | Images |
|---|---|---|
| Comparison with Poisson distribution Blue bars denote a histogram of data divided into 1 sec bins. Red curve is a Poisson curve with rate = median count rate of data. |
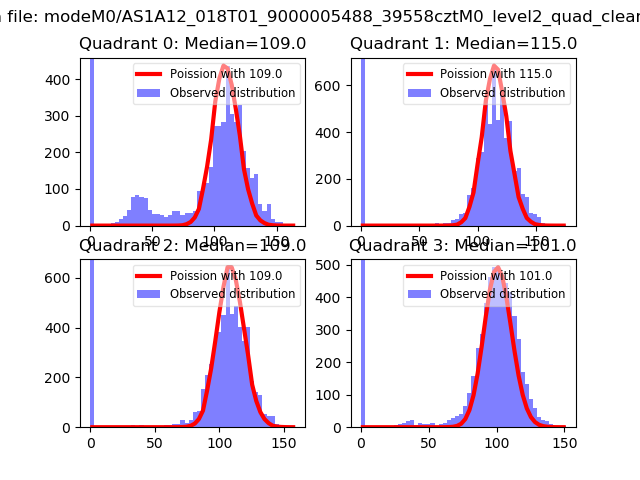 |
 |
| Quadrant-wise count rates Data is divided into 100 sec bins |
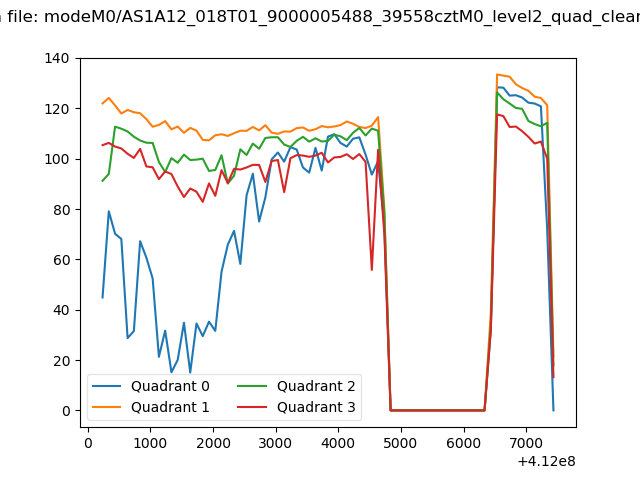 |
|
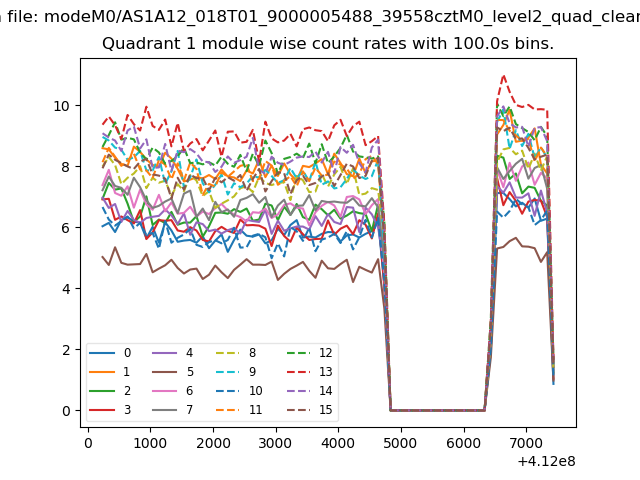
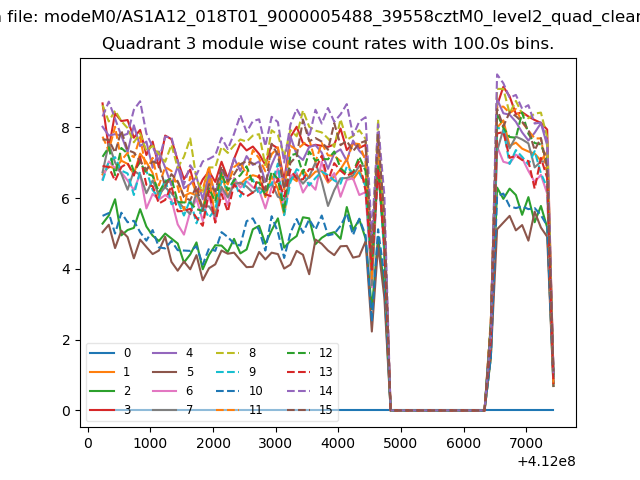
| Module-wise count rates for Quadrant A Data is divided into 100 sec bins |
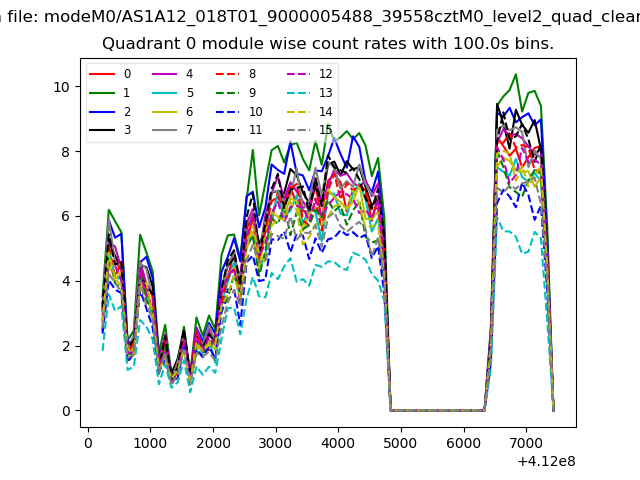 |
 |
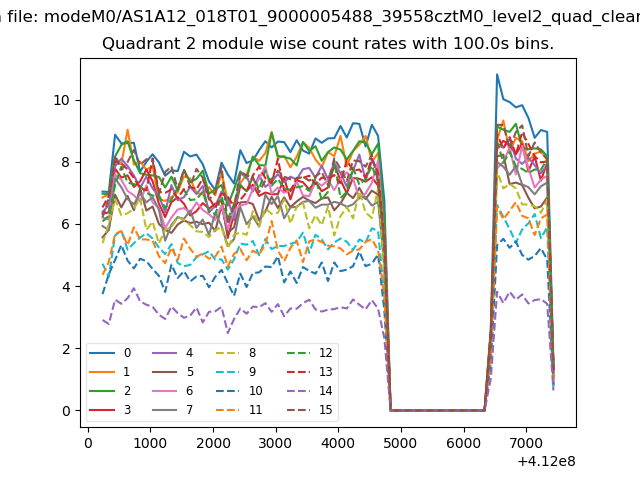
| Module-wise count rates for Quadrant B Data is divided into 100 sec bins |
 |
 |
| Module-wise count rates for Quadrant C Data is divided into 100 sec bins |
 |
 |
| Module-wise count rates for Quadrant D Data is divided into 100 sec bins |
 |
 |
| Parameter | Plot |
|---|---|
| CZT HV Monitor | 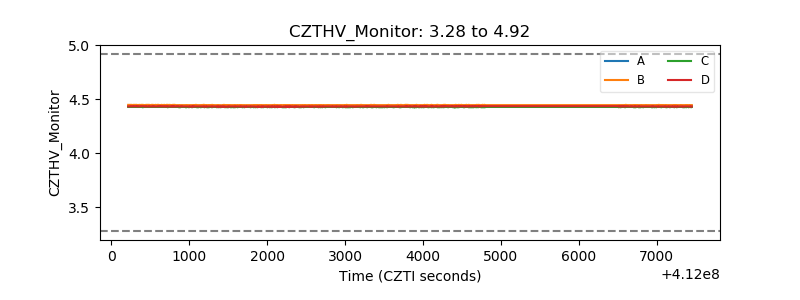 |
| D_VDD | 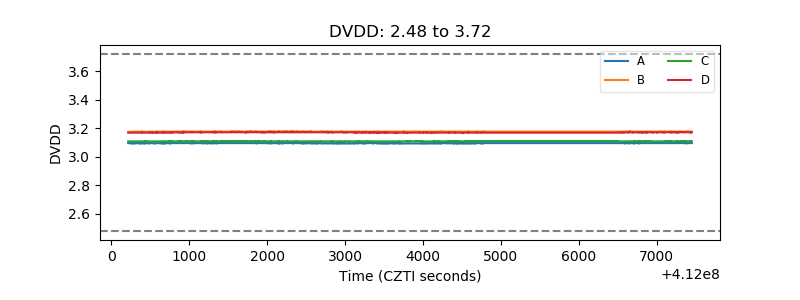 |
| Temperature 1 | 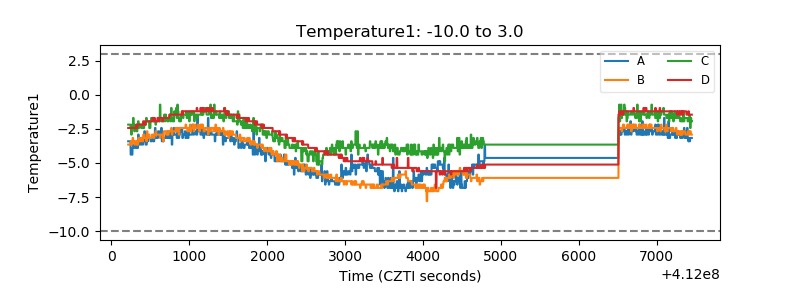 |
| Veto HV Monitor | 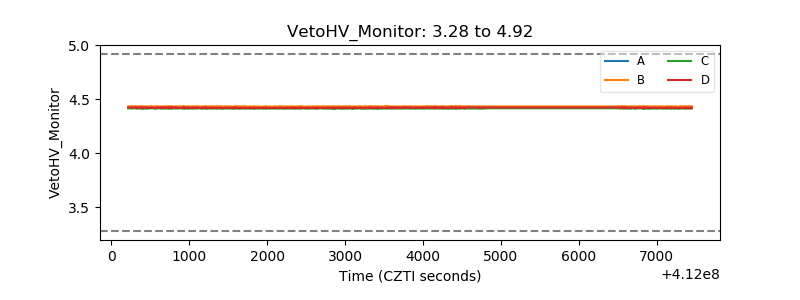 |
| Veto LLD | 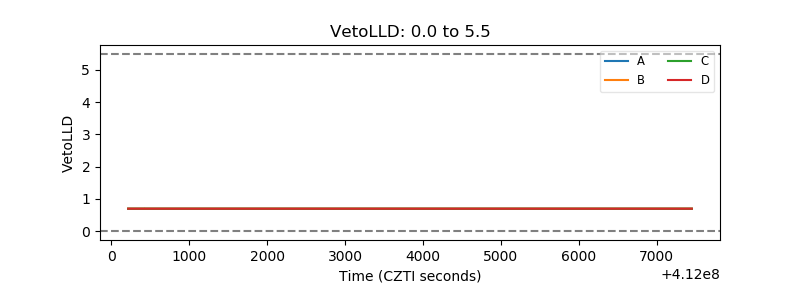 |
| Alpha Counter | 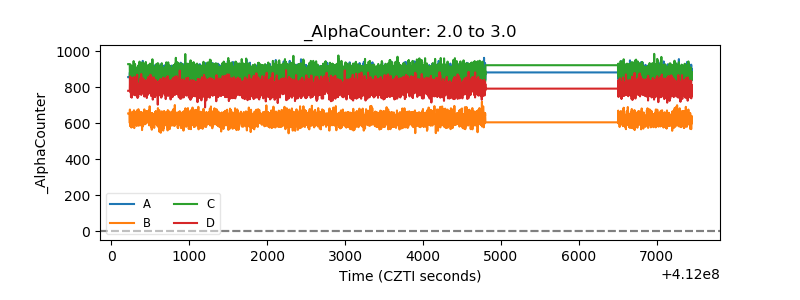 |
| _CPM_Rate |  |
| CZT Counter | 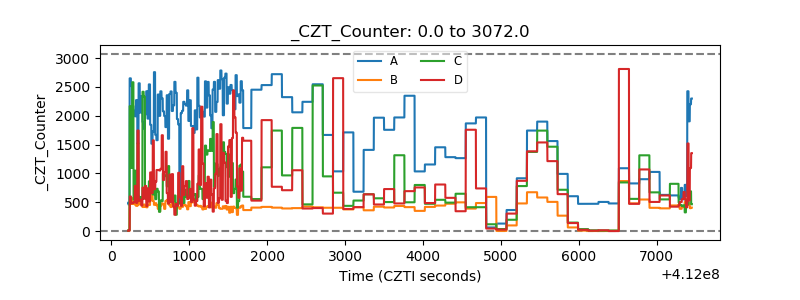 |
| +2.5 Volts monitor | 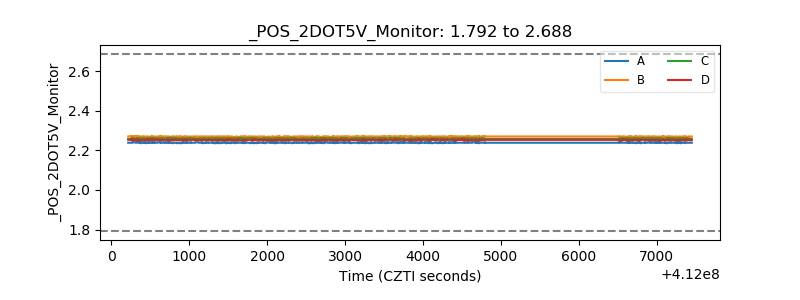 |
| +5 Volts monitor | 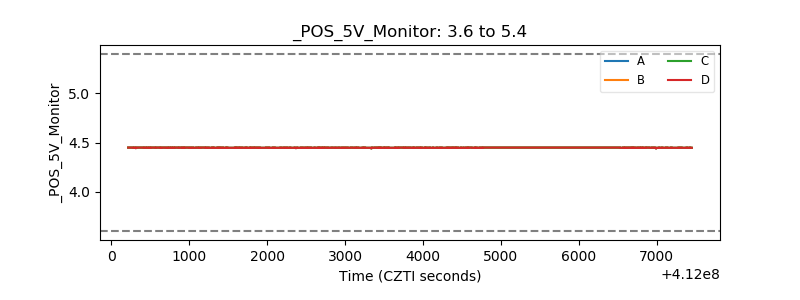 |
| _ROLL_ROT | 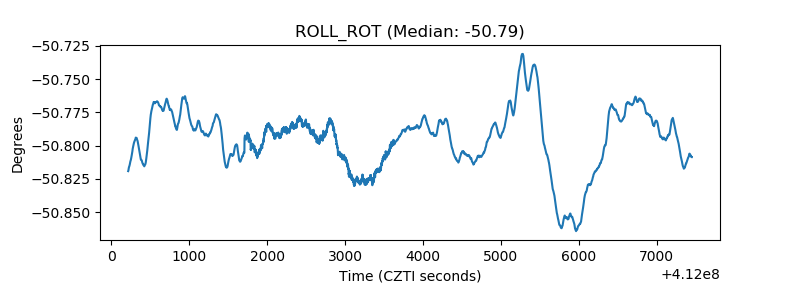 |
| _Roll_DEC | 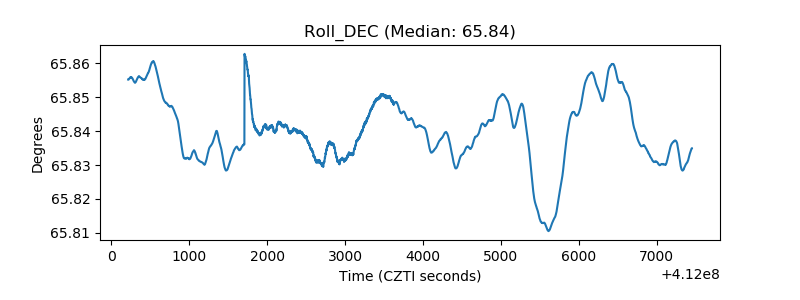 |
| _Roll_RA | 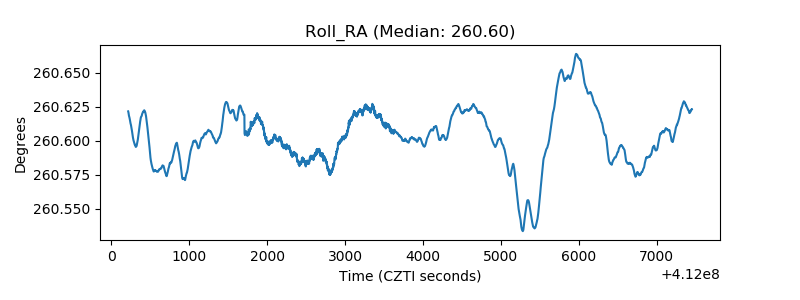 |
| Veto Counter | 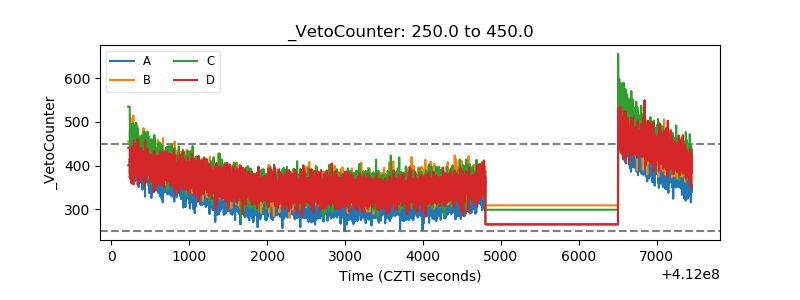 |