| Param | Original file | Final file |
|---|---|---|
| Filename | modeM0/AS1A12_018T01_9000005488_39560cztM0_level2.fits | modeM0/AS1A12_018T01_9000005488_39560cztM0_level2_quad_clean.evt |
| Size (bytes) | 574,960,320 | 87,353,280 |
| Size | 548.3 MB | 83.3 MB |
| Events in quadrant A | 9,111,553 | 464,684 |
| Events in quadrant B | 2,433,144 | 658,949 |
| Events in quadrant C | 3,995,198 | 606,430 |
| Events in quadrant D | 5,323,287 | 534,967 |
| Mode SS | |||
|---|---|---|---|
| Quadrant | BADHDUFLAG | Total packets | Discarded packets |
| A | 0 | 112 | 0 |
| B | 0 | 112 | 0 |
| C | 0 | 112 | 0 |
| D | 0 | 112 | 0 |
| Mode M0 | |||
|---|---|---|---|
| Quadrant | BADHDUFLAG | Total packets | Discarded packets |
| A | 0 | 30909 | 3 |
| B | 0 | 10963 | 2 |
| C | 0 | 15396 | 2 |
| D | 0 | 19481 | 2 |
| Mode M9 | |||
|---|---|---|---|
| Quadrant | BADHDUFLAG | Total packets | Discarded packets |
| A | 0 | 20 | 0 |
| B | 0 | 20 | 0 |
| C | 0 | 20 | 0 |
| D | 0 | 21 | 0 |
| Quadrant | Total seconds | Saturated seconds | Saturation percentage |
|---|---|---|---|
| A | 5421 | 1982 | 36.561520% |
| B | 5421 | 7 | 0.129127% |
| C | 5421 | 230 | 4.242760% |
| D | 5421 | 666 | 12.285556% |
Noise dominated data is calculated using 1-second bins in cleaned event files. If a bin has >2000 counts, and if more than 50% of those come from <1% of pixels, then it is considered to be noise-dominated and hence unusable.
| Quadrant | # 1 sec bins | Bins with >0 counts | Bins with >2000 counts | High rate bins dominated by noise | Noise dominated (total time) | Noise dominated (detector-on time) | Marked lightcurve |
|---|---|---|---|---|---|---|---|
| A | 7275 | 5422 | 1861 | 1861 | 25.58% | 34.32% | 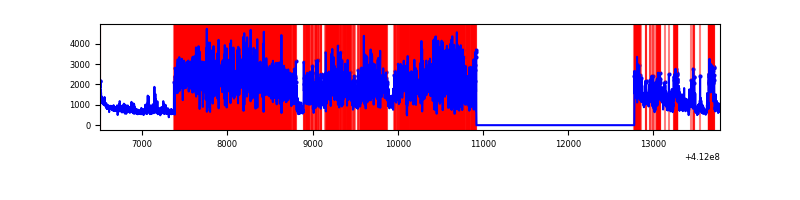 |
| B | 7275 | 5422 | 1 | 1 | 0.01% | 0.02% | 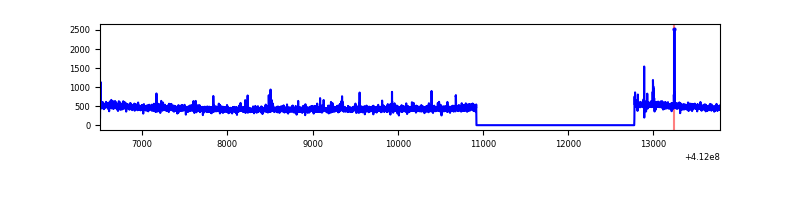 |
| C | 7275 | 5421 | 217 | 217 | 2.98% | 4.00% | 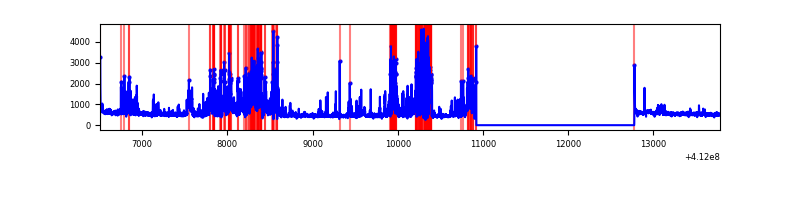 |
| D | 7275 | 5422 | 686 | 686 | 9.43% | 12.65% | 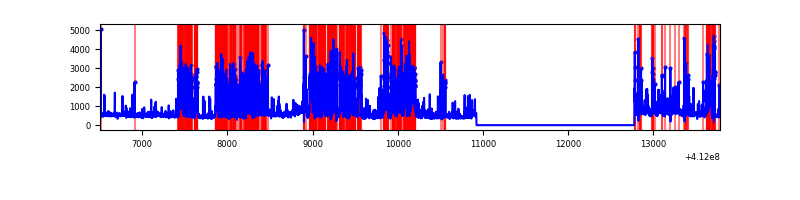 |
Top three noisy pixels from each quadrant. If the there are fewer than three noisy pixels in the level2.evt file, extra rows are filled as -1
| Pixel properties | Quadrant properties | ||||||
|---|---|---|---|---|---|---|---|
| Quadrant | DetID | PixID | Counts | Sigma | Mean | Median | Sigma |
| A | 15 | 222 | 6414501 | 57979.51 | 544 | 533 | 110.6 |
| A | 10 | 83 | 431600 | 3896.66 | 544 | 533 | 110.6 |
| A | 13 | 248 | 120925 | 1088.29 | 544 | 533 | 110.6 |
| B | 0 | 230 | 25050 | 213.39 | 604 | 588 | 114.6 |
| B | 5 | 255 | 14365 | 120.18 | 604 | 588 | 114.6 |
| B | 12 | 111 | 14204 | 118.78 | 604 | 588 | 114.6 |
| C | 15 | 208 | 976737 | 7139.19 | 590 | 594 | 136.7 |
| C | 9 | 187 | 421187 | 3076.08 | 590 | 594 | 136.7 |
| C | 15 | 214 | 225346 | 1643.76 | 590 | 594 | 136.7 |
| D | 1 | 52 | 1791491 | 12790.26 | 576 | 560 | 140.0 |
| D | 12 | 227 | 807248 | 5761.11 | 576 | 560 | 140.0 |
| D | 13 | 249 | 172107 | 1225.13 | 576 | 560 | 140.0 |
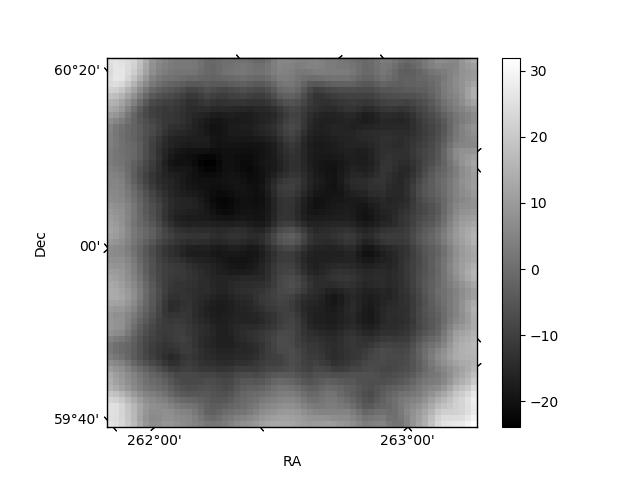
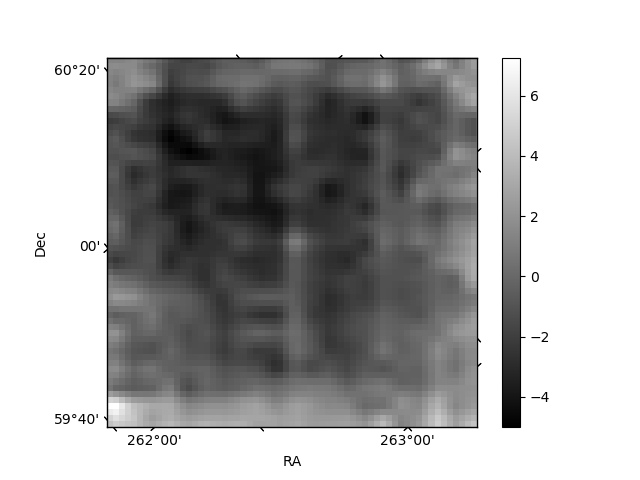
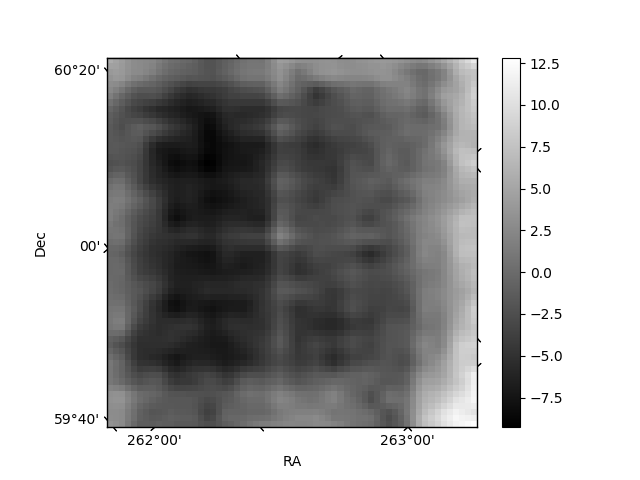
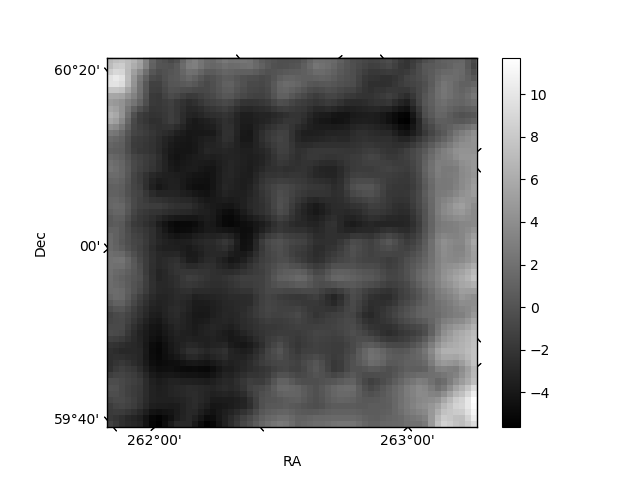
Histogram calculated using DETX and DETY for each event in the final _common_clean file
| Quadrant A | 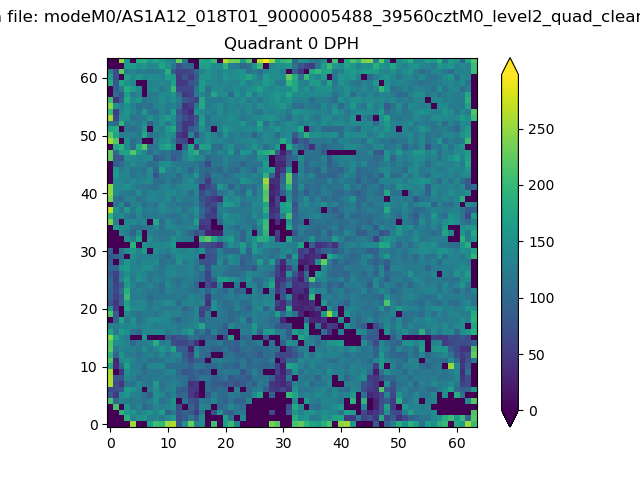 |
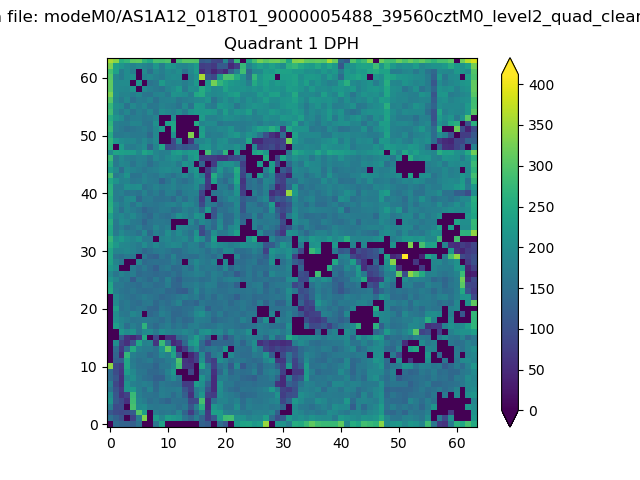 |
Quadrant B |
|---|---|---|---|
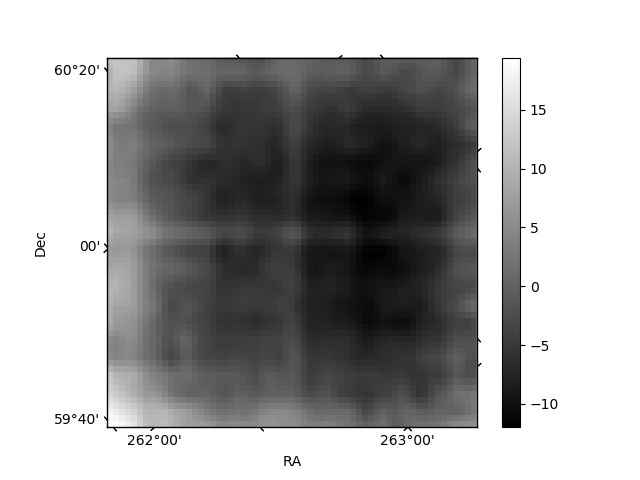
| Quadrant D | 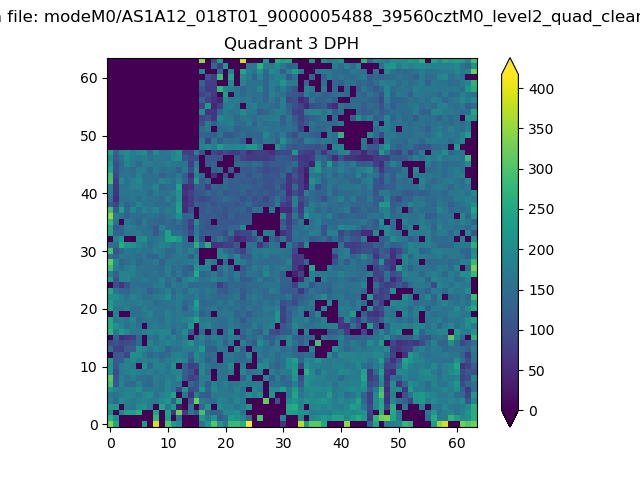 |
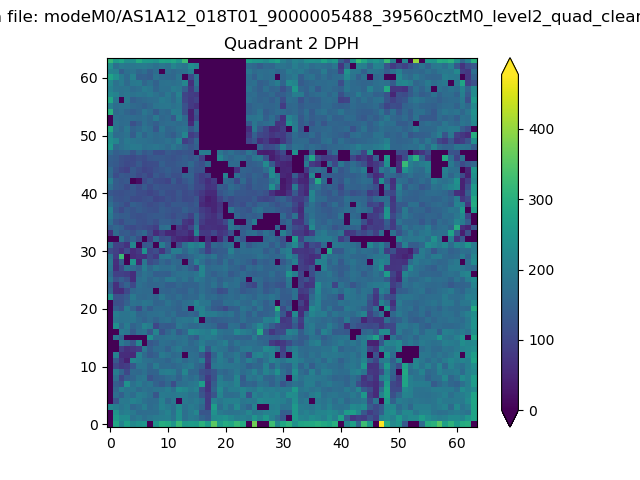 |
Quadrant C |
| Plot type | Count rate plots | Images |
|---|---|---|
| Comparison with Poisson distribution Blue bars denote a histogram of data divided into 1 sec bins. Red curve is a Poisson curve with rate = median count rate of data. |
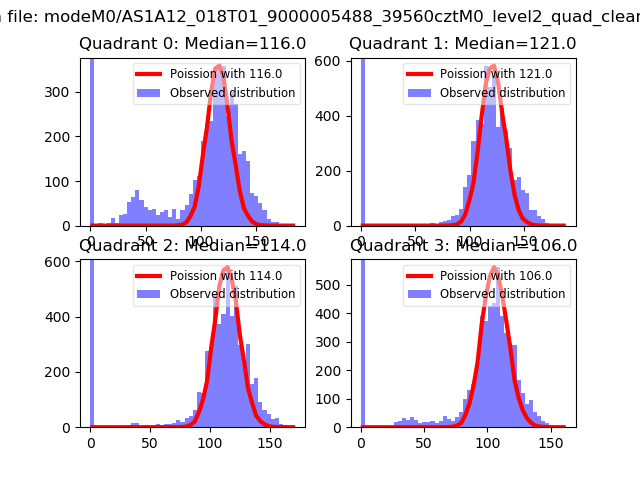 |
 |
| Quadrant-wise count rates Data is divided into 100 sec bins |
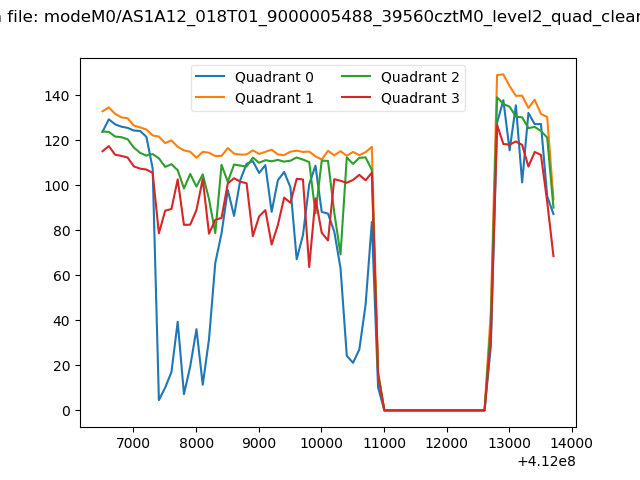 |
|
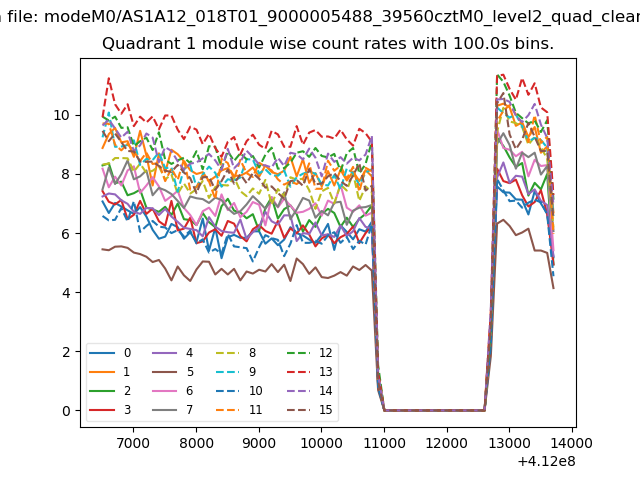
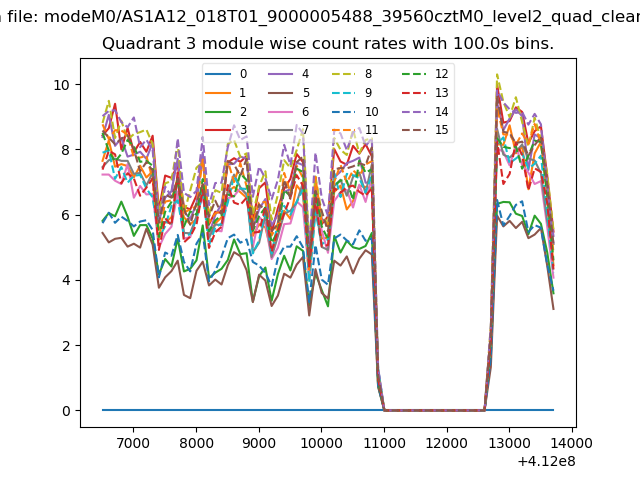
| Module-wise count rates for Quadrant A Data is divided into 100 sec bins |
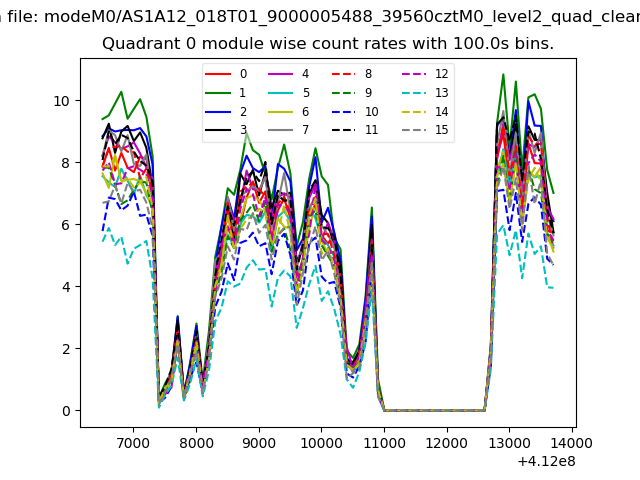 |
 |
| Module-wise count rates for Quadrant B Data is divided into 100 sec bins |
 |
 |
| Module-wise count rates for Quadrant C Data is divided into 100 sec bins |
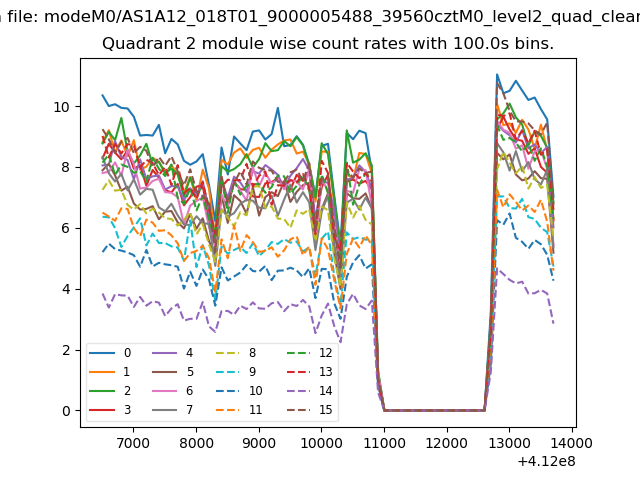 |
 |
| Module-wise count rates for Quadrant D Data is divided into 100 sec bins |
 |
 |
| Parameter | Plot |
|---|---|
| CZT HV Monitor | 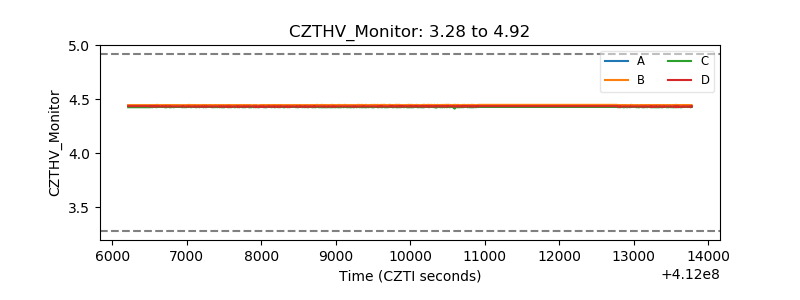 |
| D_VDD | 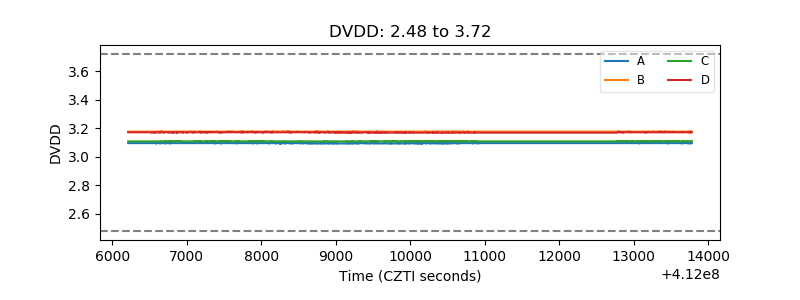 |
| Temperature 1 | 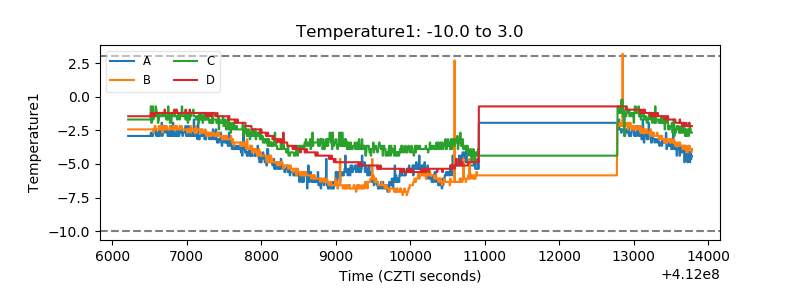 |
| Veto HV Monitor | 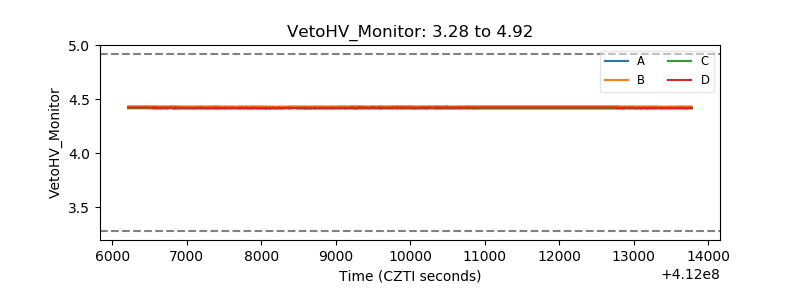 |
| Veto LLD | 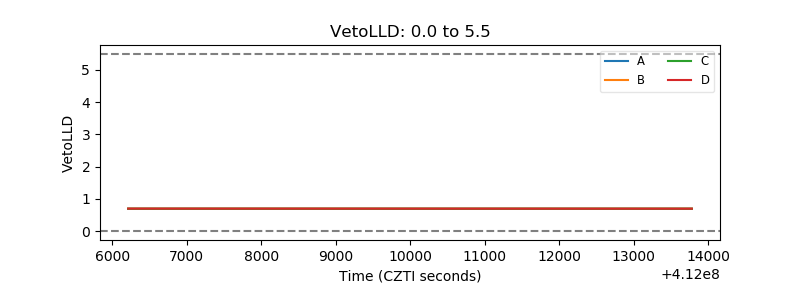 |
| Alpha Counter | 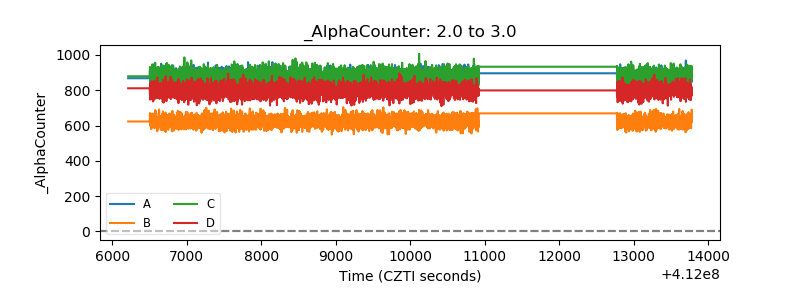 |
| _CPM_Rate | 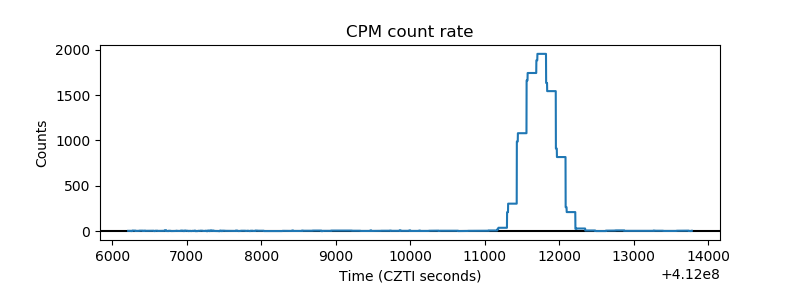 |
| CZT Counter | 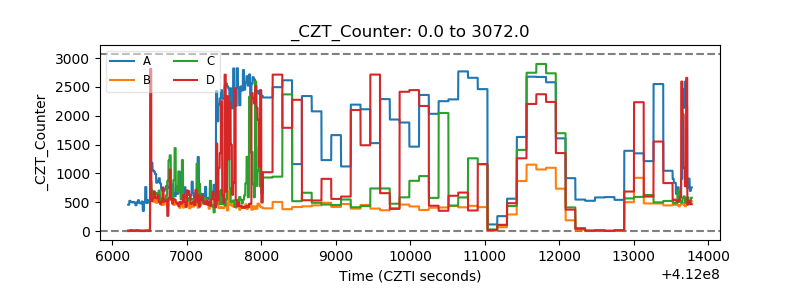 |
| +2.5 Volts monitor | 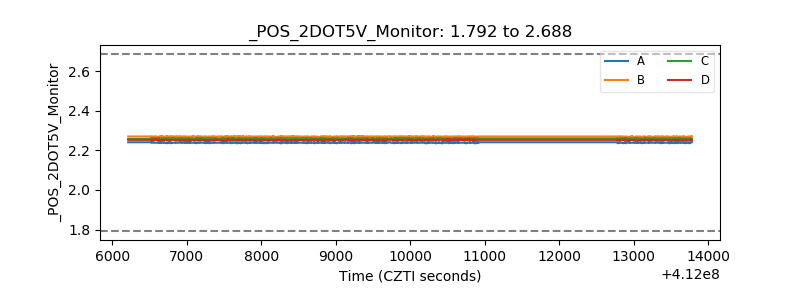 |
| +5 Volts monitor | 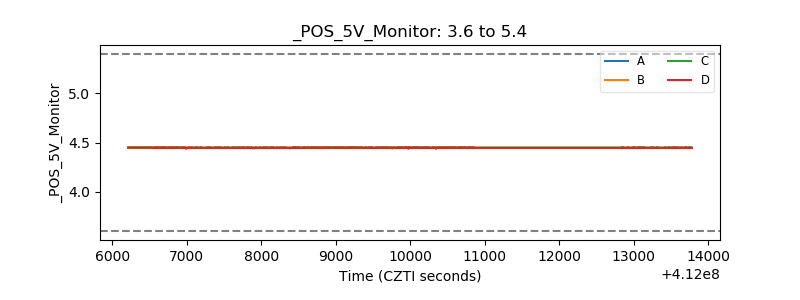 |
| _ROLL_ROT | 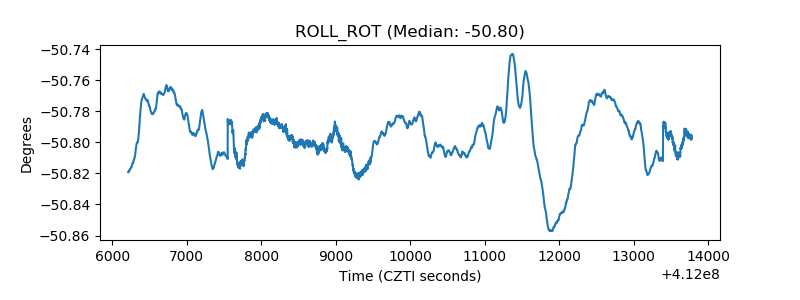 |
| _Roll_DEC | 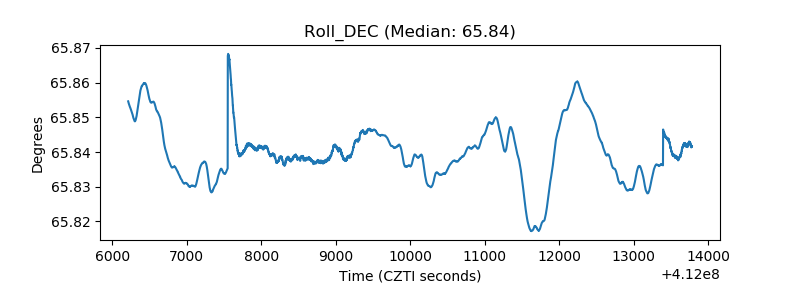 |
| _Roll_RA | 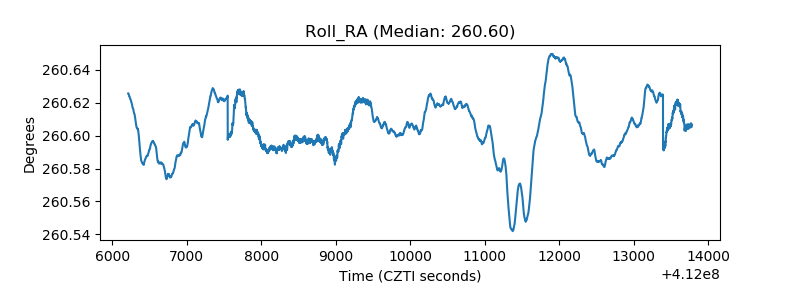 |
| Veto Counter | 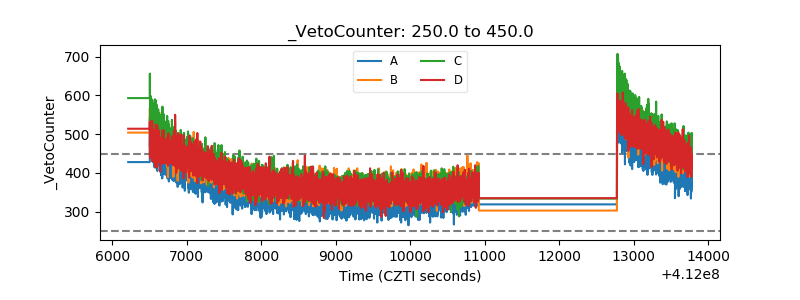 |