| Param | Original file | Final file |
|---|---|---|
| Filename | modeM0/AS1A12_018T01_9000005488_39561cztM0_level2.fits | modeM0/AS1A12_018T01_9000005488_39561cztM0_level2_quad_clean.evt |
| Size (bytes) | 442,860,480 | 92,989,440 |
| Size | 422.3 MB | 88.7 MB |
| Events in quadrant A | 5,196,666 | 623,276 |
| Events in quadrant B | 2,418,977 | 660,211 |
| Events in quadrant C | 3,445,782 | 624,138 |
| Events in quadrant D | 4,931,724 | 546,788 |
| Mode SS | |||
|---|---|---|---|
| Quadrant | BADHDUFLAG | Total packets | Discarded packets |
| A | 0 | 104 | 0 |
| B | 0 | 104 | 0 |
| C | 0 | 104 | 0 |
| D | 0 | 104 | 0 |
| Mode M0 | |||
|---|---|---|---|
| Quadrant | BADHDUFLAG | Total packets | Discarded packets |
| A | 0 | 19124 | 3 |
| B | 0 | 10655 | 2 |
| C | 0 | 13620 | 2 |
| D | 0 | 18235 | 2 |
| Mode M9 | |||
|---|---|---|---|
| Quadrant | BADHDUFLAG | Total packets | Discarded packets |
| A | 0 | 24 | 0 |
| B | 0 | 24 | 0 |
| C | 0 | 24 | 0 |
| D | 0 | 25 | 0 |
| Quadrant | Total seconds | Saturated seconds | Saturation percentage |
|---|---|---|---|
| A | 5160 | 296 | 5.736434% |
| B | 5160 | 17 | 0.329457% |
| C | 5160 | 111 | 2.151163% |
| D | 5160 | 480 | 9.302326% |
Noise dominated data is calculated using 1-second bins in cleaned event files. If a bin has >2000 counts, and if more than 50% of those come from <1% of pixels, then it is considered to be noise-dominated and hence unusable.
| Quadrant | # 1 sec bins | Bins with >0 counts | Bins with >2000 counts | High rate bins dominated by noise | Noise dominated (total time) | Noise dominated (detector-on time) | Marked lightcurve |
|---|---|---|---|---|---|---|---|
| A | 7132 | 5161 | 282 | 282 | 3.95% | 5.46% | 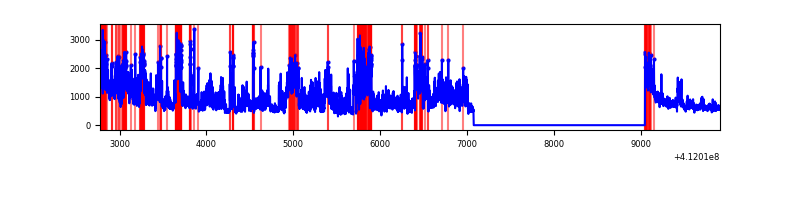 |
| B | 7132 | 5161 | 8 | 8 | 0.11% | 0.16% | 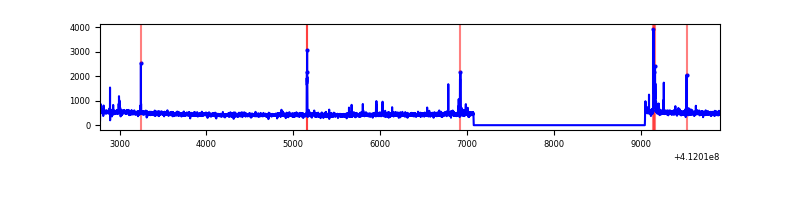 |
| C | 7132 | 5161 | 98 | 98 | 1.37% | 1.90% | 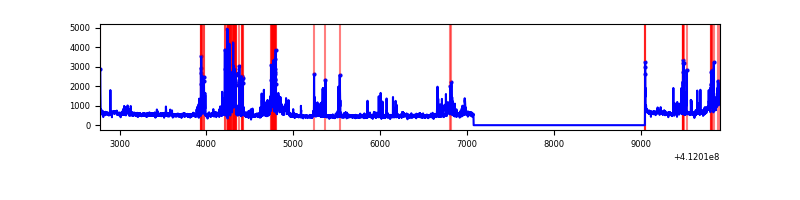 |
| D | 7132 | 5161 | 432 | 432 | 6.06% | 8.37% | 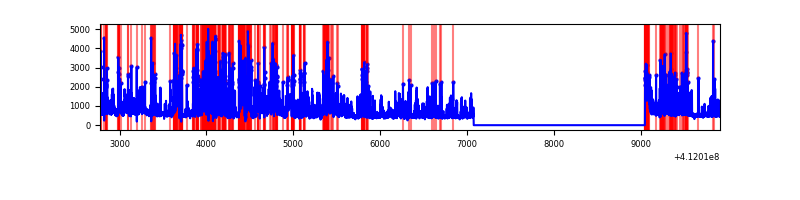 |
Top three noisy pixels from each quadrant. If the there are fewer than three noisy pixels in the level2.evt file, extra rows are filled as -1
| Pixel properties | Quadrant properties | ||||||
|---|---|---|---|---|---|---|---|
| Quadrant | DetID | PixID | Counts | Sigma | Mean | Median | Sigma |
| A | 15 | 222 | 2459538 | 20896.72 | 582 | 571 | 117.7 |
| A | 10 | 83 | 441428 | 3746.48 | 582 | 571 | 117.7 |
| A | 9 | 143 | 14774 | 120.7 | 582 | 571 | 117.7 |
| B | 5 | 255 | 45783 | 401.51 | 591 | 574 | 112.6 |
| B | 5 | 172 | 32542 | 283.91 | 591 | 574 | 112.6 |
| B | 0 | 230 | 15254 | 130.38 | 591 | 574 | 112.6 |
| C | 9 | 187 | 525624 | 3892.4 | 582 | 586 | 134.9 |
| C | 15 | 208 | 382548 | 2831.7 | 582 | 586 | 134.9 |
| C | 15 | 214 | 216152 | 1598.11 | 582 | 586 | 134.9 |
| D | 12 | 227 | 1726025 | 12589.65 | 564 | 550 | 137.1 |
| D | 1 | 52 | 507324 | 3697.59 | 564 | 550 | 137.1 |
| D | 12 | 0 | 161268 | 1172.65 | 564 | 550 | 137.1 |
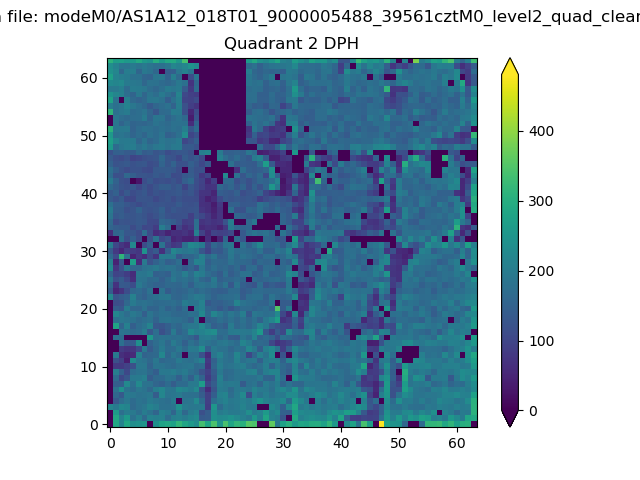
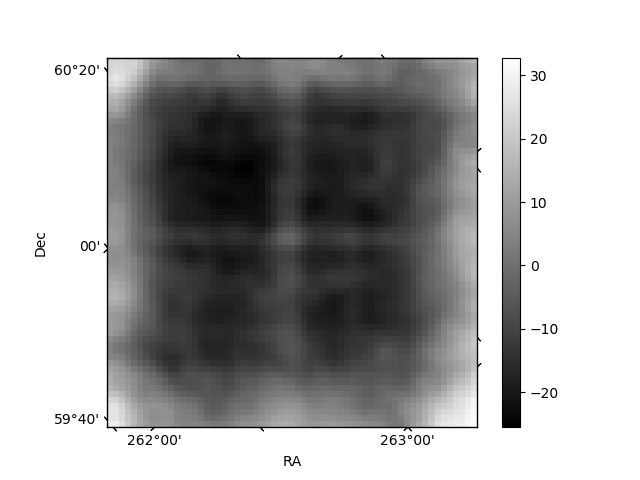
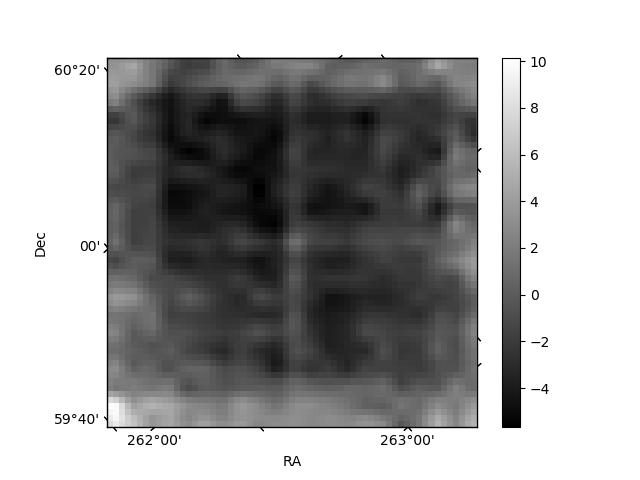
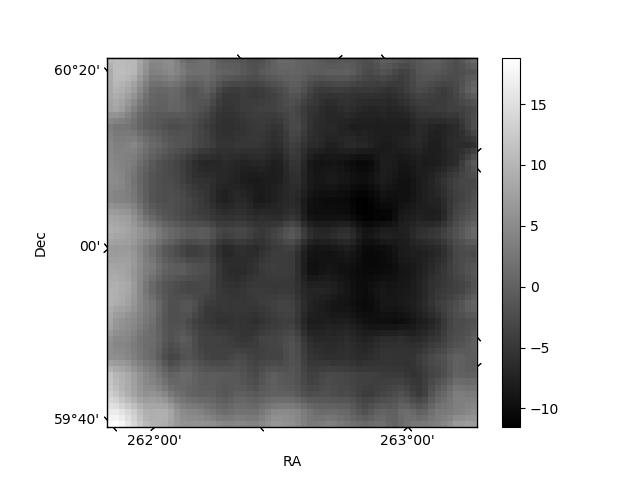
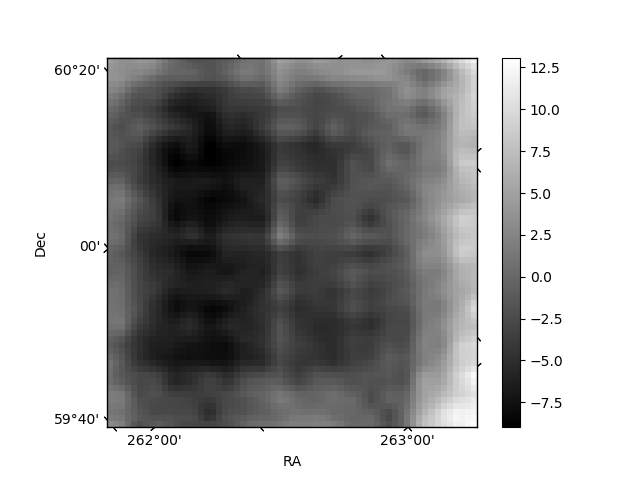
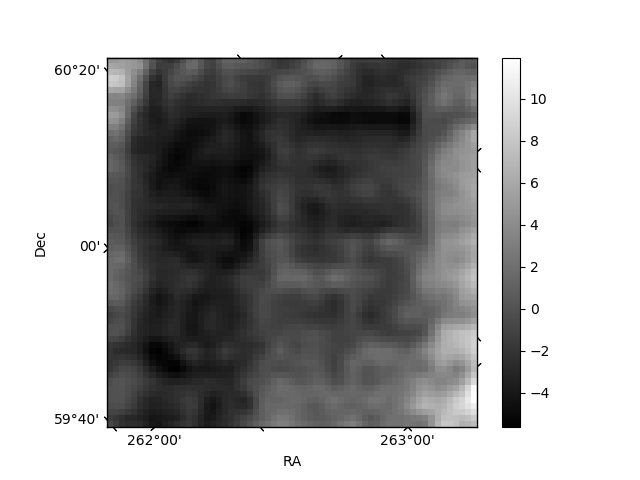
Histogram calculated using DETX and DETY for each event in the final _common_clean file
| Quadrant A | 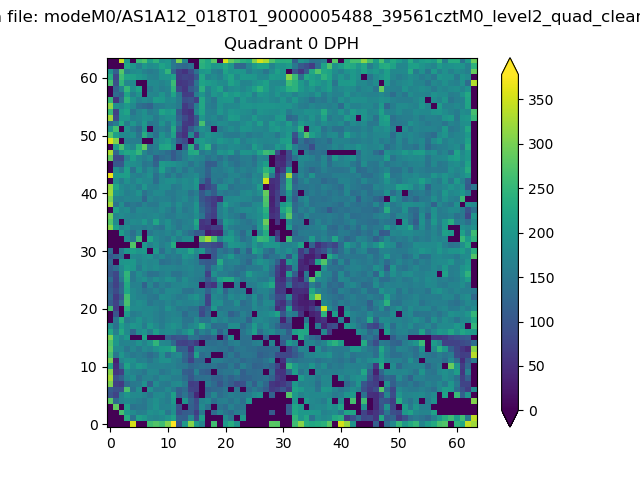 |
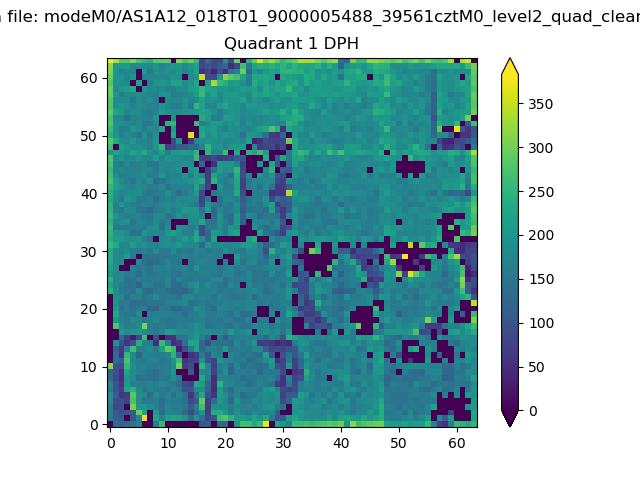 |
Quadrant B |
|---|---|---|---|
| Quadrant D | 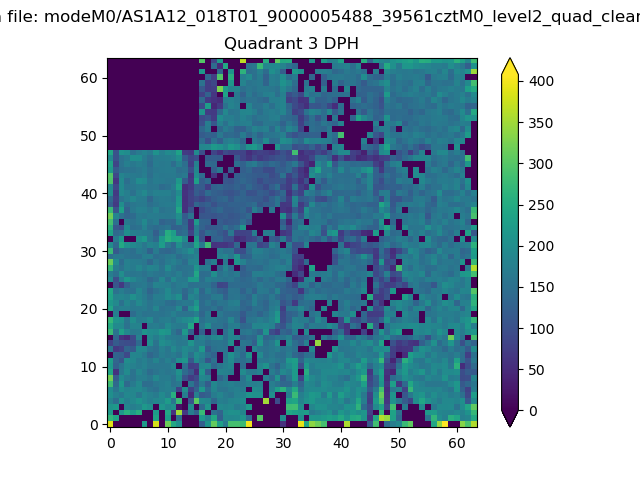 |
 |
Quadrant C |
| Plot type | Count rate plots | Images |
|---|---|---|
| Comparison with Poisson distribution Blue bars denote a histogram of data divided into 1 sec bins. Red curve is a Poisson curve with rate = median count rate of data. |
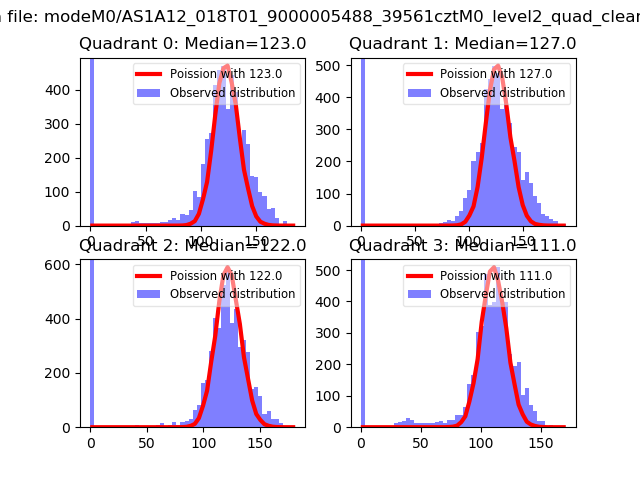 |
 |
| Quadrant-wise count rates Data is divided into 100 sec bins |
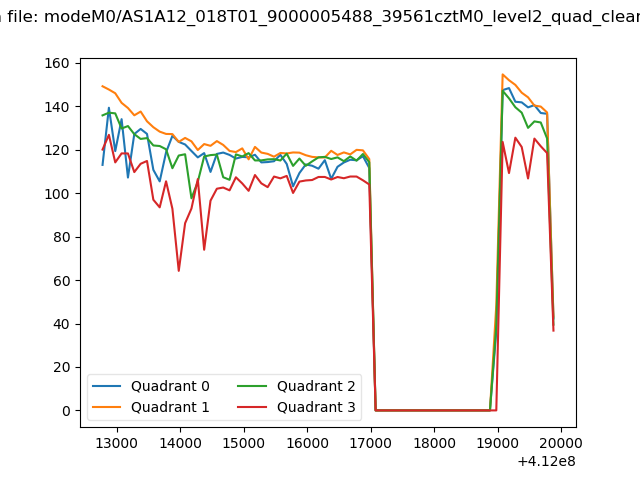 |
|
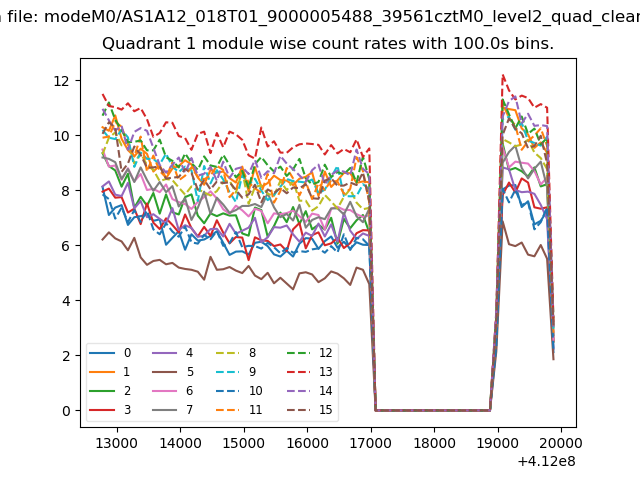
| Module-wise count rates for Quadrant A Data is divided into 100 sec bins |
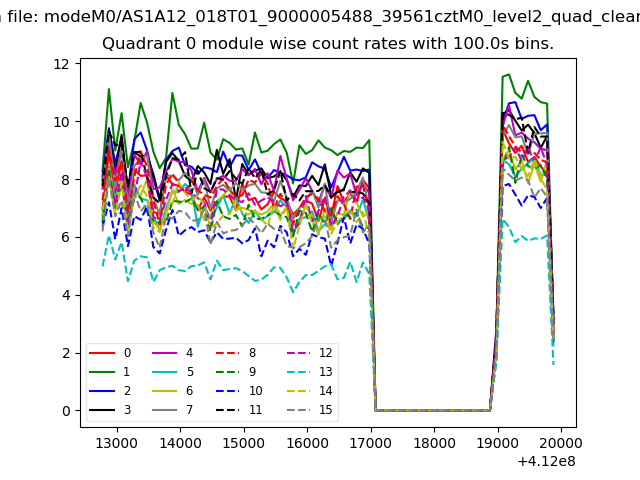 |
 |
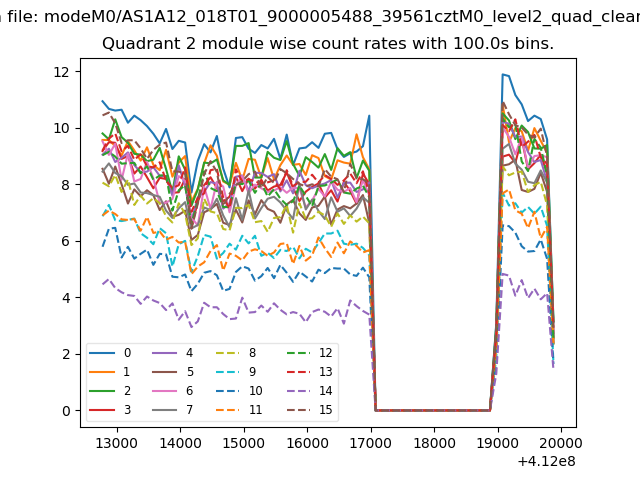
| Module-wise count rates for Quadrant B Data is divided into 100 sec bins |
 |
 |
| Module-wise count rates for Quadrant C Data is divided into 100 sec bins |
 |
 |
| Module-wise count rates for Quadrant D Data is divided into 100 sec bins |
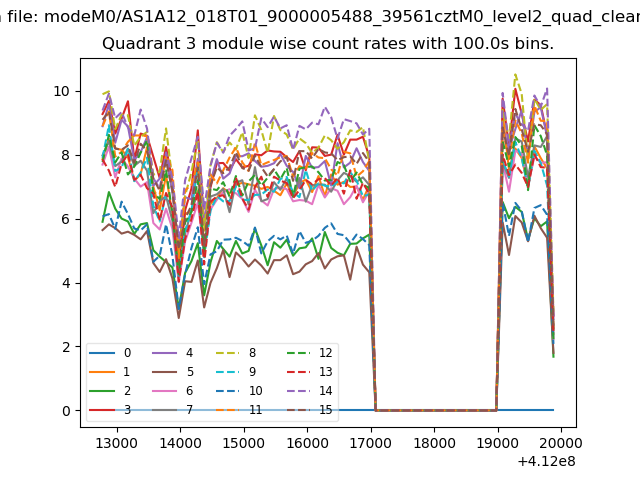 |
 |
| Parameter | Plot |
|---|---|
| CZT HV Monitor | 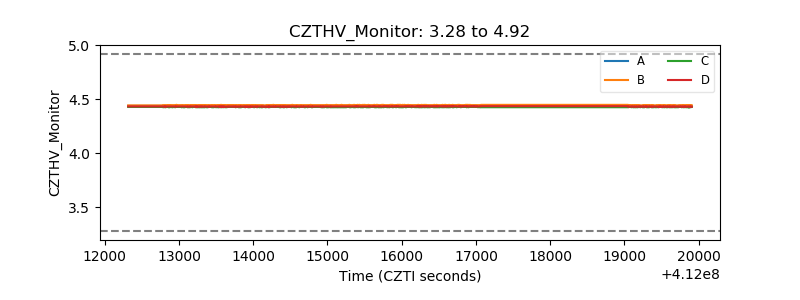 |
| D_VDD | 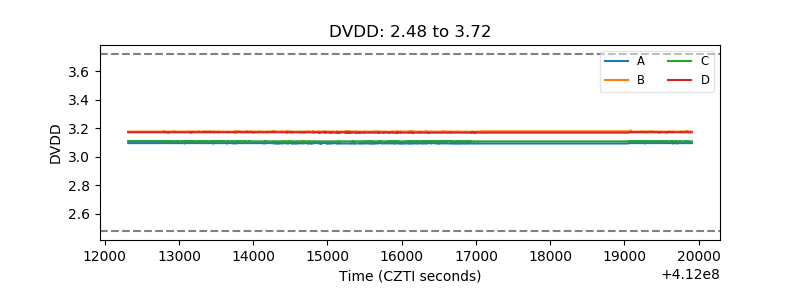 |
| Temperature 1 | 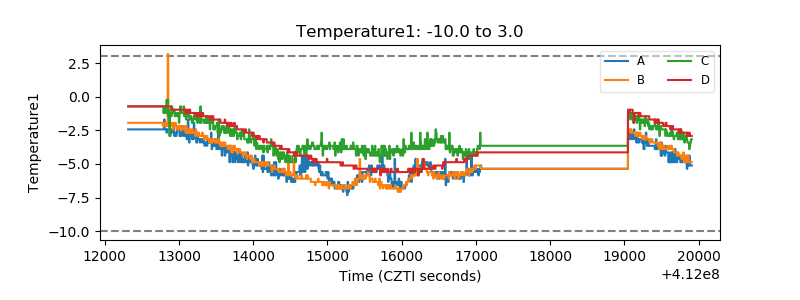 |
| Veto HV Monitor | 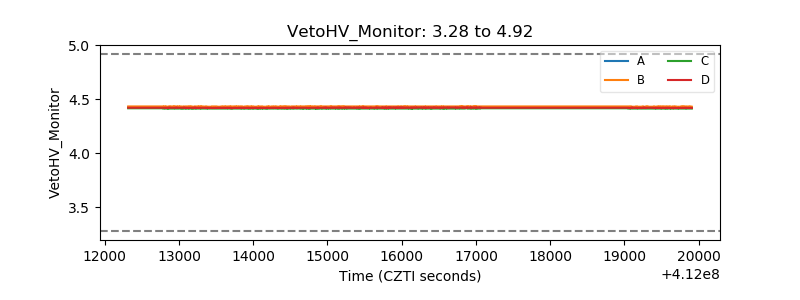 |
| Veto LLD | 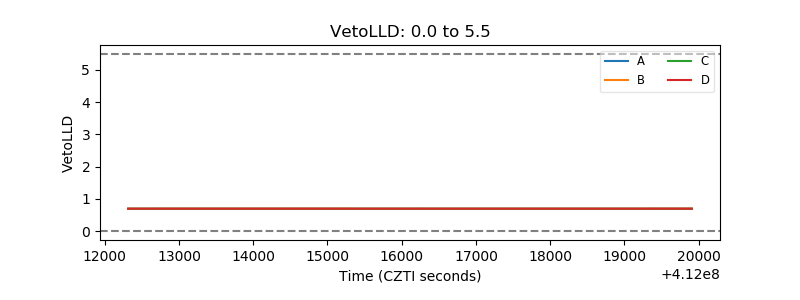 |
| Alpha Counter | 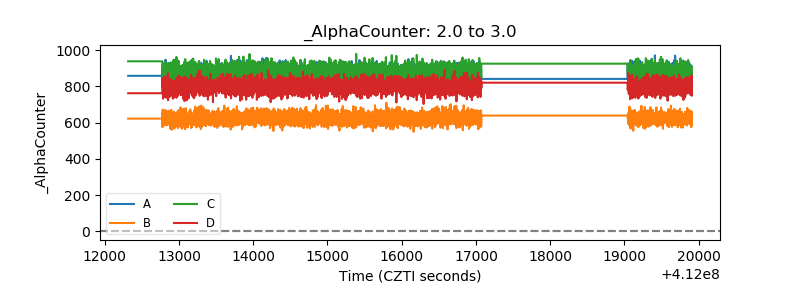 |
| _CPM_Rate | 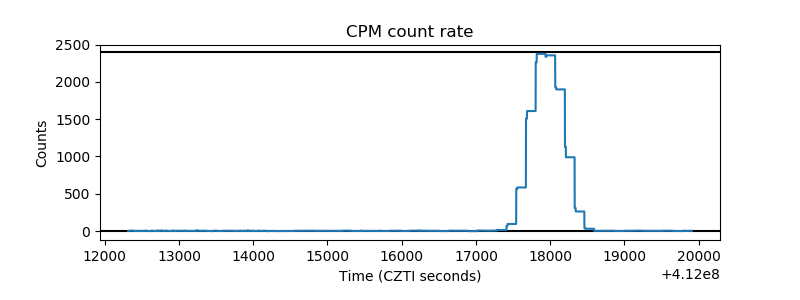 |
| CZT Counter | 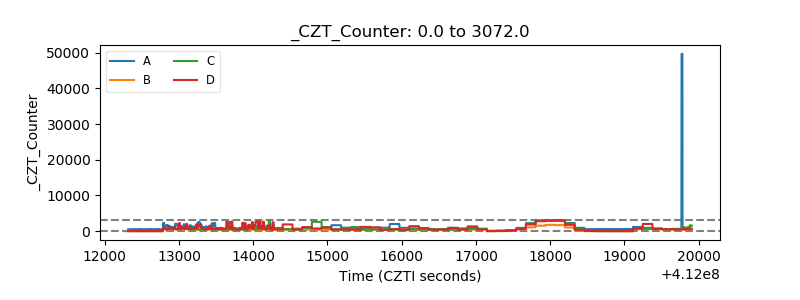 |
| +2.5 Volts monitor | 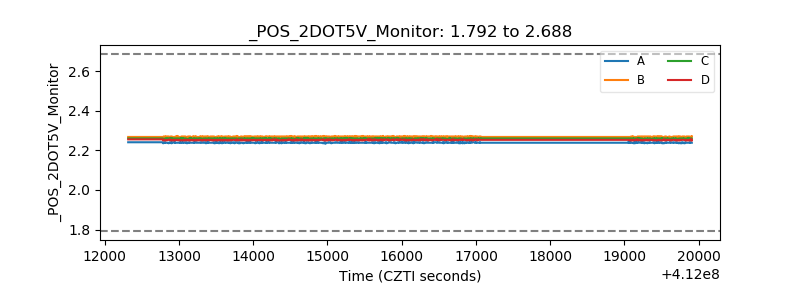 |
| +5 Volts monitor | 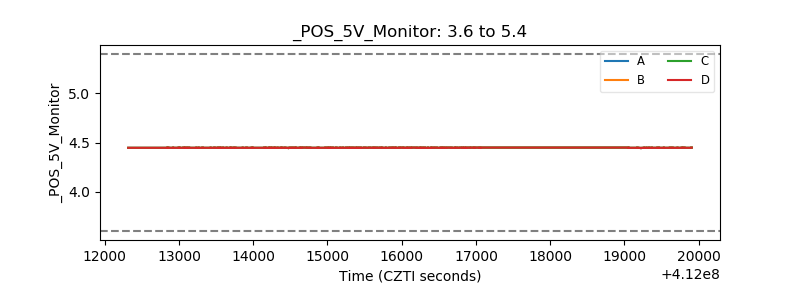 |
| _ROLL_ROT | 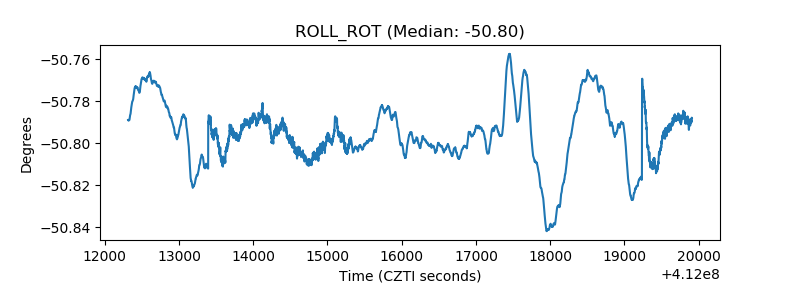 |
| _Roll_DEC | 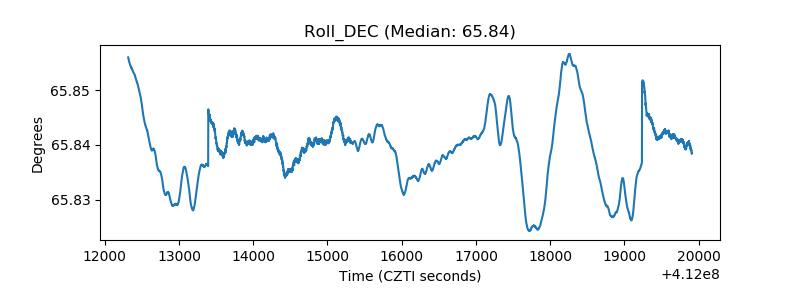 |
| _Roll_RA | 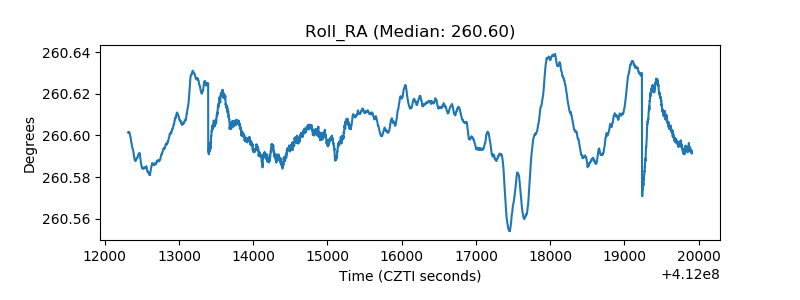 |
| Veto Counter | 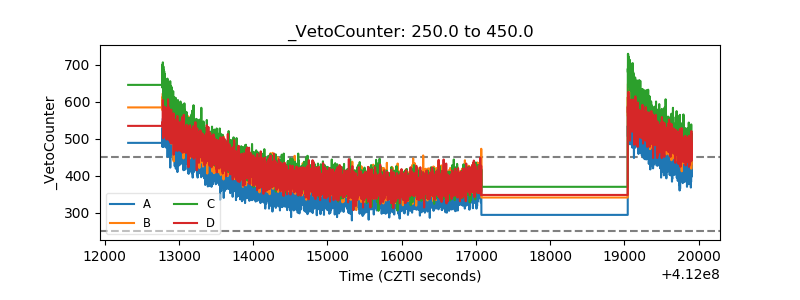 |