| Param | Original file | Final file |
|---|---|---|
| Filename | modeM0/AS1A12_018T01_9000005488_39563cztM0_level2.fits | modeM0/AS1A12_018T01_9000005488_39563cztM0_level2_quad_clean.evt |
| Size (bytes) | 424,272,960 | 86,754,240 |
| Size | 404.6 MB | 82.7 MB |
| Events in quadrant A | 4,928,436 | 582,002 |
| Events in quadrant B | 2,288,368 | 617,804 |
| Events in quadrant C | 4,562,199 | 556,411 |
| Events in quadrant D | 3,549,149 | 529,871 |
| Mode SS | |||
|---|---|---|---|
| Quadrant | BADHDUFLAG | Total packets | Discarded packets |
| A | 0 | 100 | 0 |
| B | 0 | 100 | 0 |
| C | 0 | 100 | 0 |
| D | 0 | 100 | 0 |
| Mode M0 | |||
|---|---|---|---|
| Quadrant | BADHDUFLAG | Total packets | Discarded packets |
| A | 0 | 18121 | 3 |
| B | 0 | 10104 | 2 |
| C | 0 | 16831 | 2 |
| D | 0 | 14012 | 2 |
| Mode M9 | |||
|---|---|---|---|
| Quadrant | BADHDUFLAG | Total packets | Discarded packets |
| A | 0 | 27 | 0 |
| B | 0 | 27 | 0 |
| C | 0 | 27 | 0 |
| D | 0 | 28 | 0 |
| Quadrant | Total seconds | Saturated seconds | Saturation percentage |
|---|---|---|---|
| A | 4856 | 255 | 5.251236% |
| B | 4856 | 43 | 0.885502% |
| C | 4856 | 510 | 10.502471% |
| D | 4856 | 272 | 5.601318% |
Noise dominated data is calculated using 1-second bins in cleaned event files. If a bin has >2000 counts, and if more than 50% of those come from <1% of pixels, then it is considered to be noise-dominated and hence unusable.
| Quadrant | # 1 sec bins | Bins with >0 counts | Bins with >2000 counts | High rate bins dominated by noise | Noise dominated (total time) | Noise dominated (detector-on time) | Marked lightcurve |
|---|---|---|---|---|---|---|---|
| A | 6979 | 4857 | 210 | 210 | 3.01% | 4.32% | 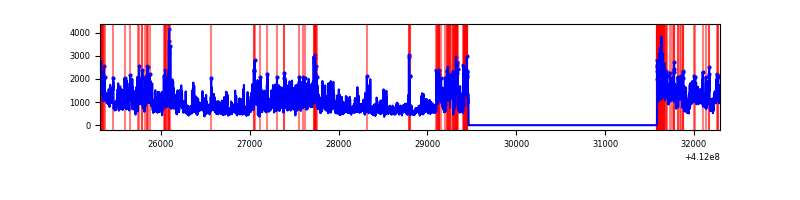 |
| B | 6979 | 4857 | 29 | 29 | 0.42% | 0.60% | 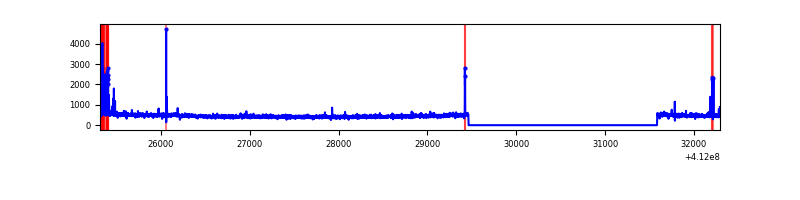 |
| C | 6979 | 4857 | 475 | 475 | 6.81% | 9.78% | 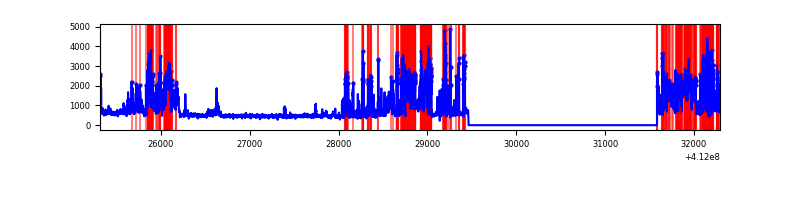 |
| D | 6979 | 4857 | 227 | 227 | 3.25% | 4.67% | 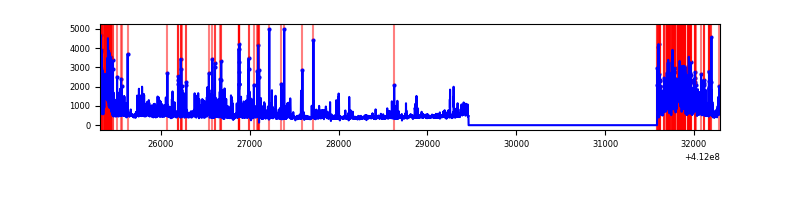 |
Top three noisy pixels from each quadrant. If the there are fewer than three noisy pixels in the level2.evt file, extra rows are filled as -1
| Pixel properties | Quadrant properties | ||||||
|---|---|---|---|---|---|---|---|
| Quadrant | DetID | PixID | Counts | Sigma | Mean | Median | Sigma |
| A | 15 | 222 | 2343602 | 21806.85 | 536 | 527 | 107.4 |
| A | 10 | 83 | 400816 | 3725.46 | 536 | 527 | 107.4 |
| A | 13 | 248 | 76326 | 705.46 | 536 | 527 | 107.4 |
| B | 5 | 172 | 112117 | 1083.97 | 545 | 531 | 102.9 |
| B | 5 | 255 | 12711 | 118.31 | 545 | 531 | 102.9 |
| B | 12 | 111 | 12513 | 116.39 | 545 | 531 | 102.9 |
| C | 9 | 187 | 1730549 | 14216.41 | 526 | 530 | 121.7 |
| C | 15 | 208 | 557250 | 4574.84 | 526 | 530 | 121.7 |
| C | 15 | 214 | 199027 | 1631.15 | 526 | 530 | 121.7 |
| D | 12 | 227 | 1072715 | 8379.54 | 527 | 513 | 128.0 |
| D | 7 | 38 | 108430 | 843.4 | 527 | 513 | 128.0 |
| D | 1 | 52 | 107489 | 836.05 | 527 | 513 | 128.0 |
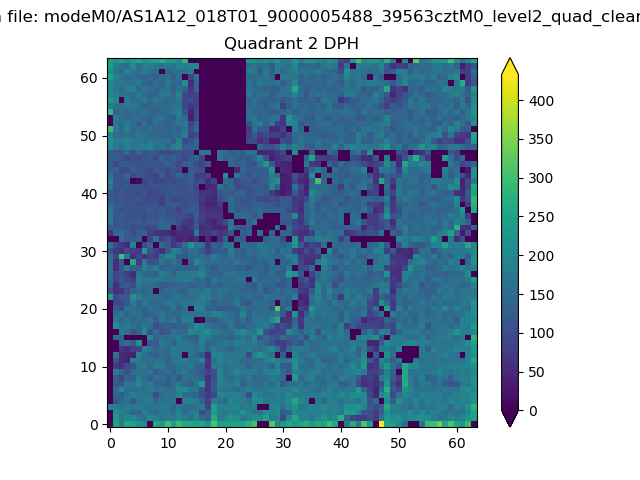
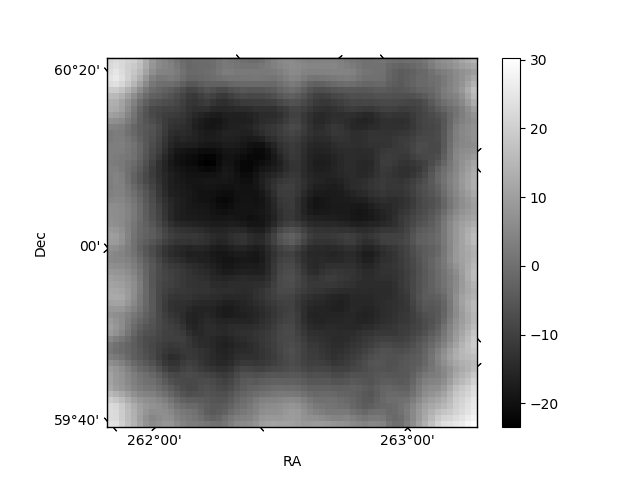
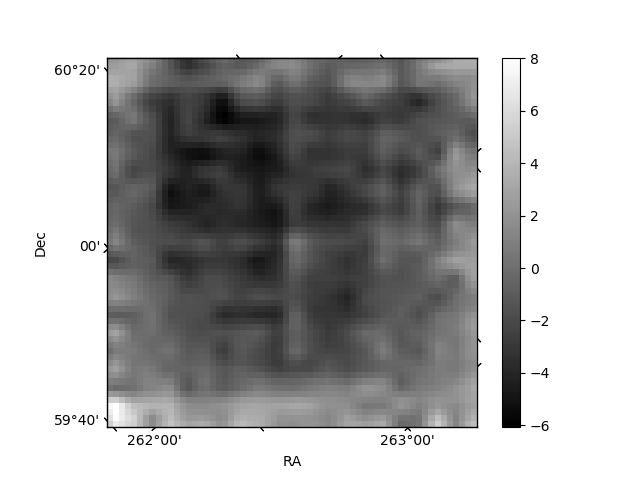
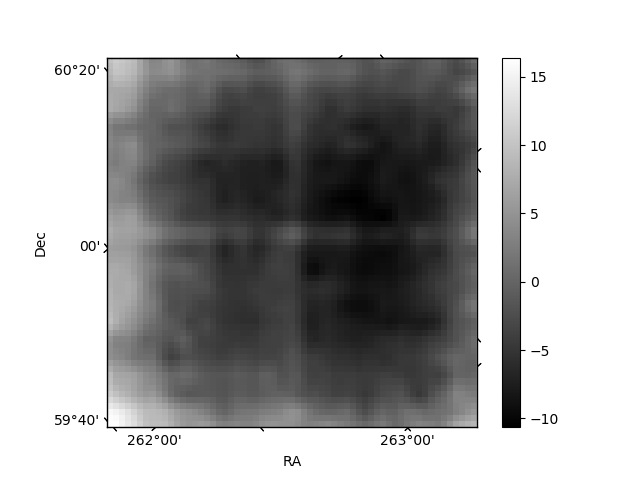
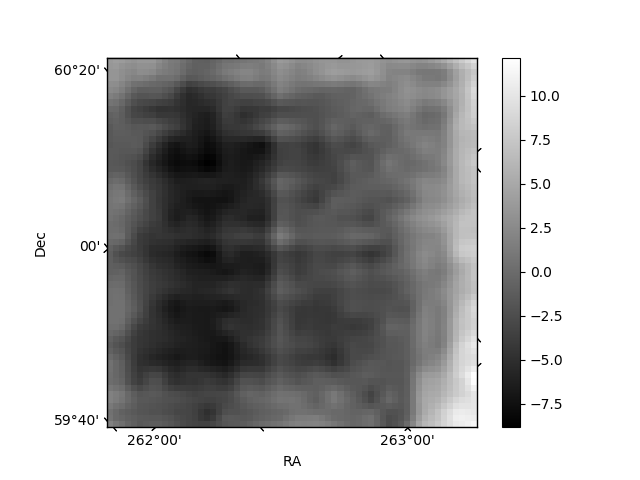
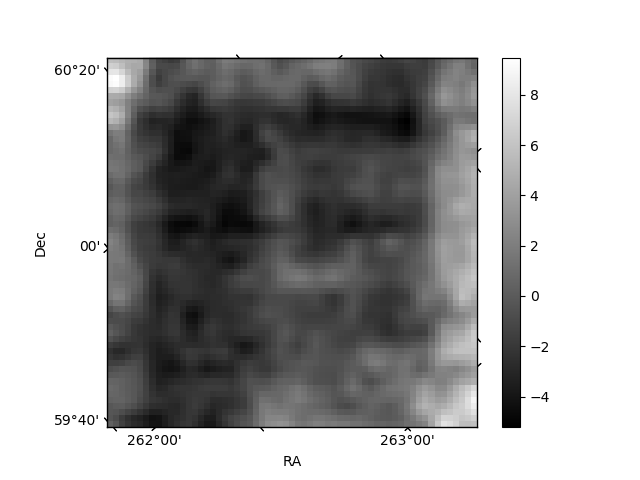
Histogram calculated using DETX and DETY for each event in the final _common_clean file
| Quadrant A | 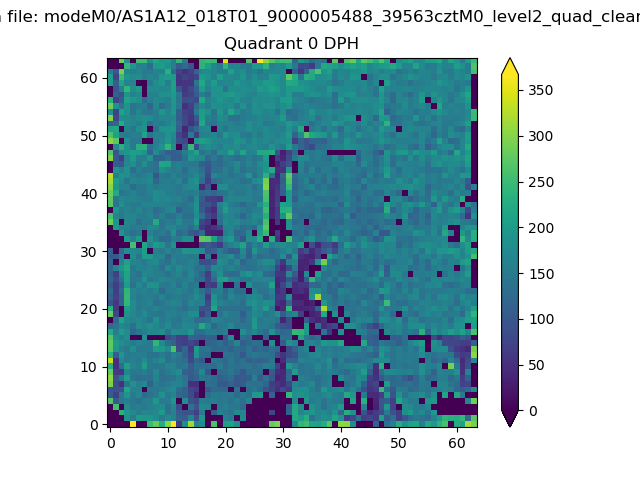 |
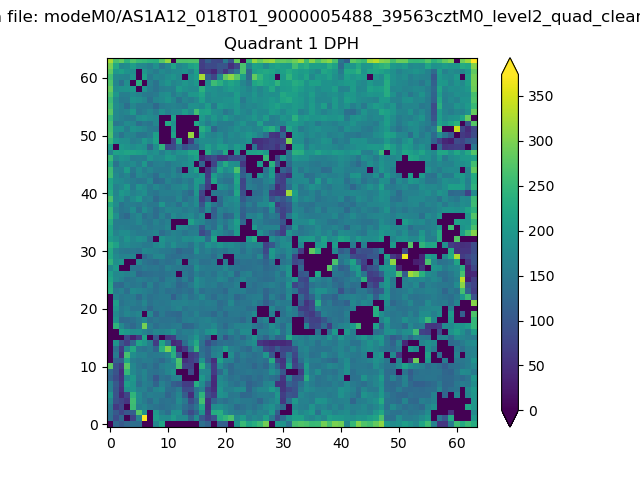 |
Quadrant B |
|---|---|---|---|
| Quadrant D | 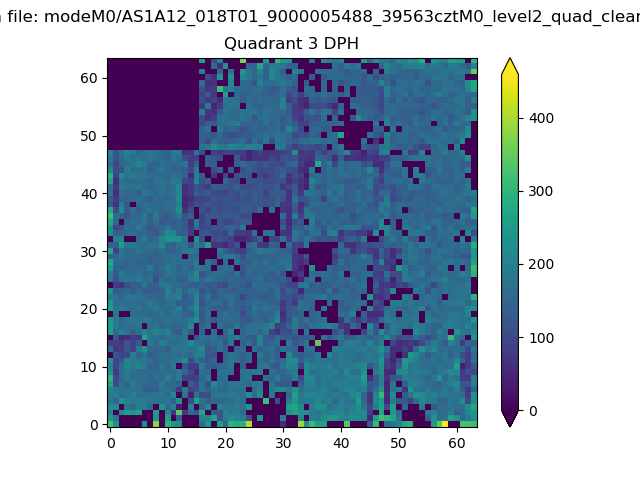 |
 |
Quadrant C |
| Plot type | Count rate plots | Images |
|---|---|---|
| Comparison with Poisson distribution Blue bars denote a histogram of data divided into 1 sec bins. Red curve is a Poisson curve with rate = median count rate of data. |
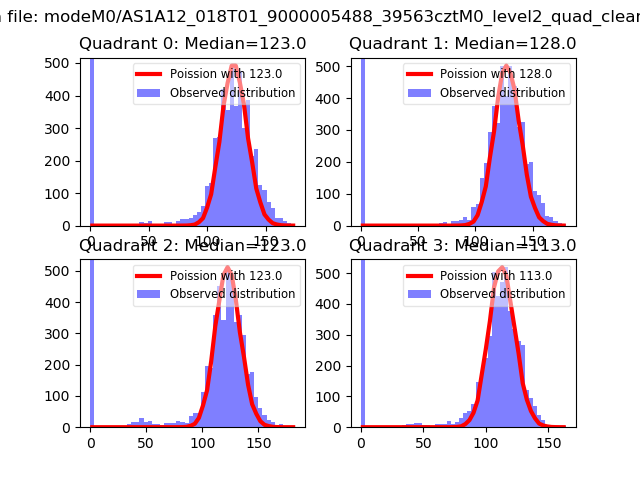 |
 |
| Quadrant-wise count rates Data is divided into 100 sec bins |
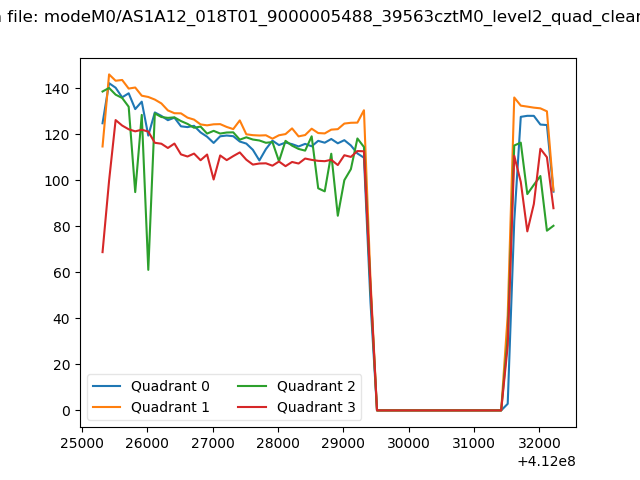 |
|
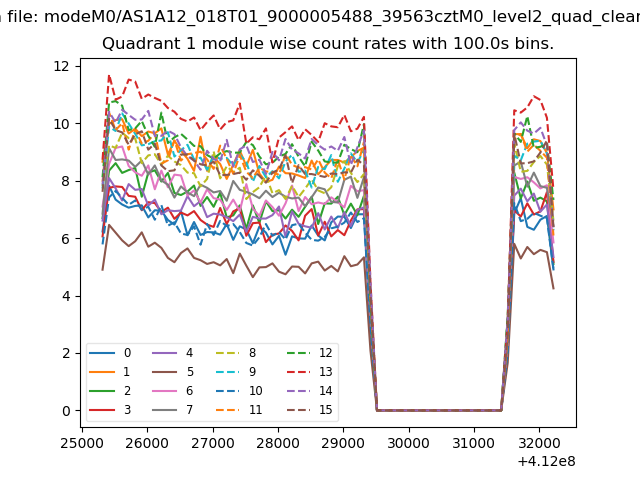
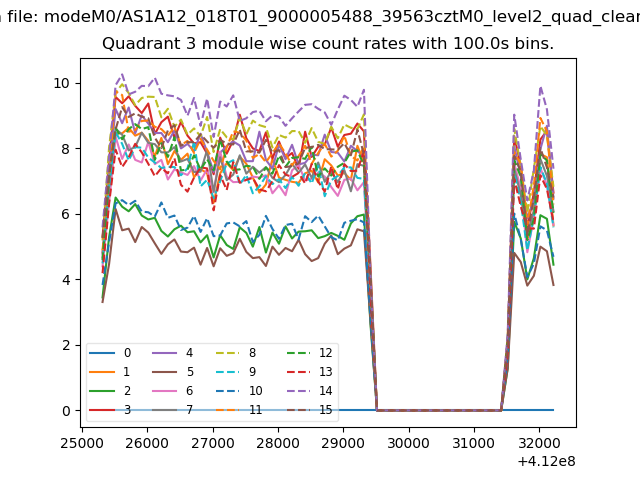
| Module-wise count rates for Quadrant A Data is divided into 100 sec bins |
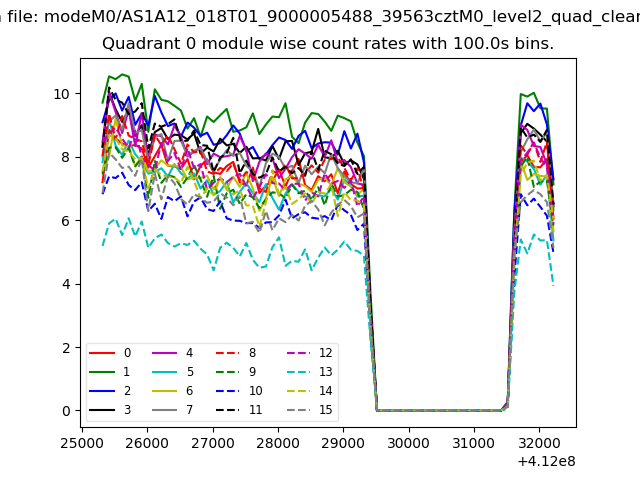 |
 |
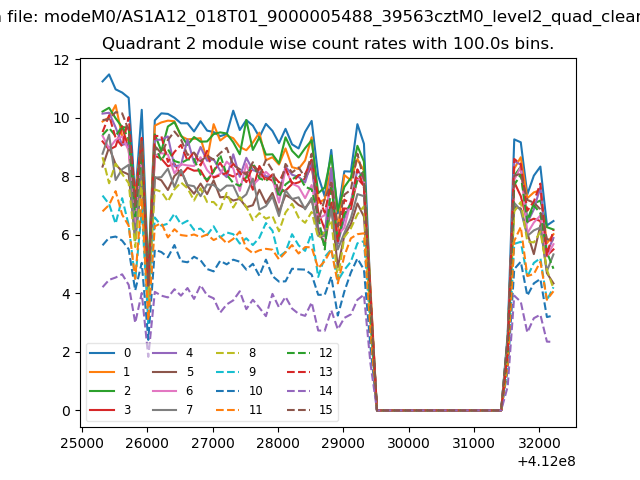
| Module-wise count rates for Quadrant B Data is divided into 100 sec bins |
 |
 |
| Module-wise count rates for Quadrant C Data is divided into 100 sec bins |
 |
 |
| Module-wise count rates for Quadrant D Data is divided into 100 sec bins |
 |
 |
| Parameter | Plot |
|---|---|
| CZT HV Monitor | 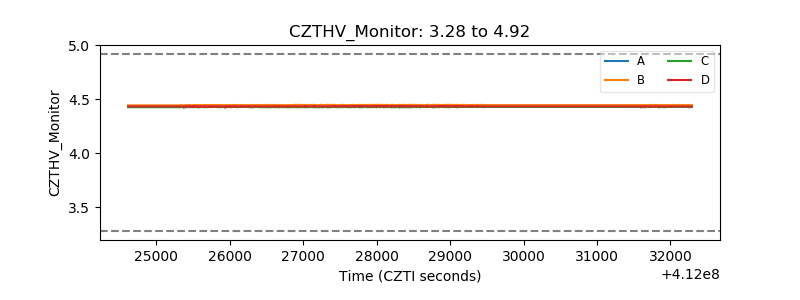 |
| D_VDD | 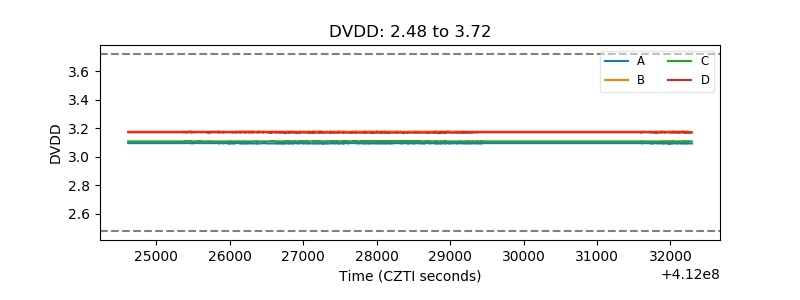 |
| Temperature 1 | 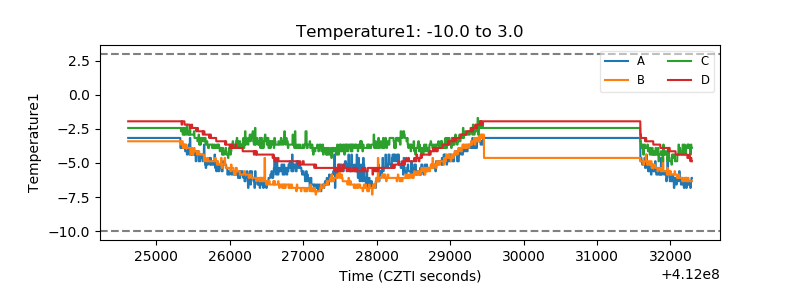 |
| Veto HV Monitor | 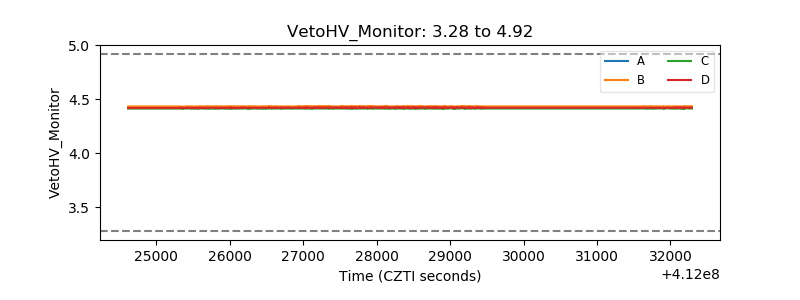 |
| Veto LLD | 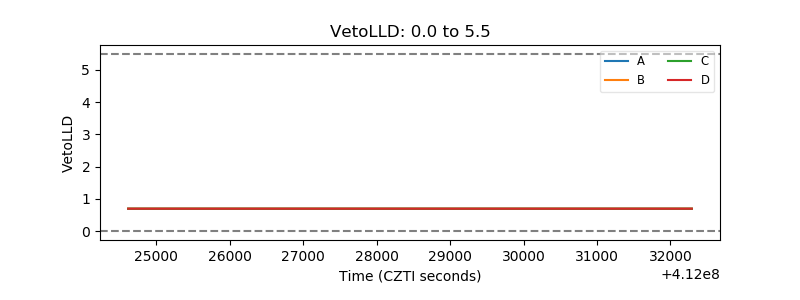 |
| Alpha Counter | 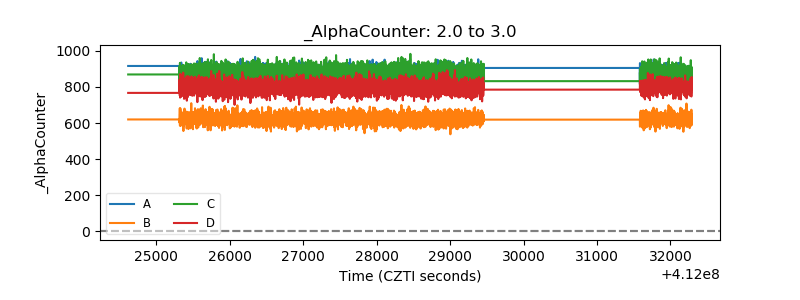 |
| _CPM_Rate | 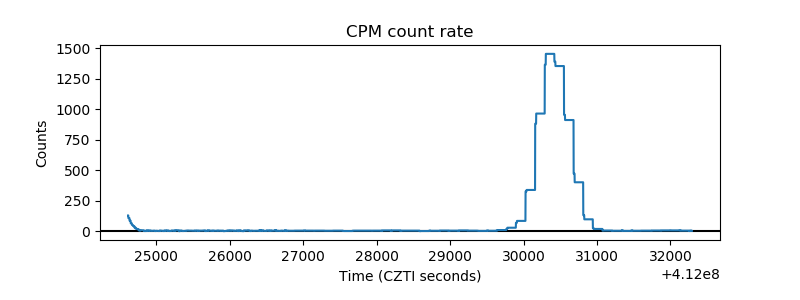 |
| CZT Counter | 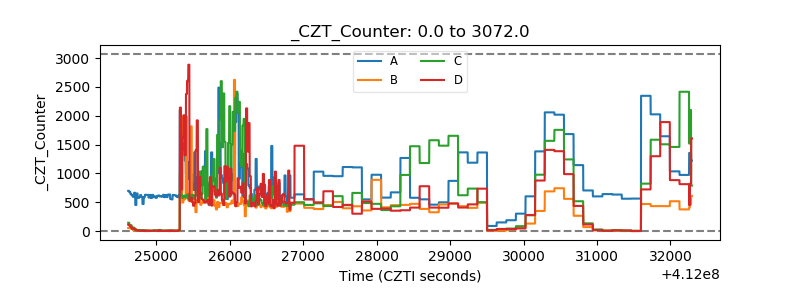 |
| +2.5 Volts monitor | 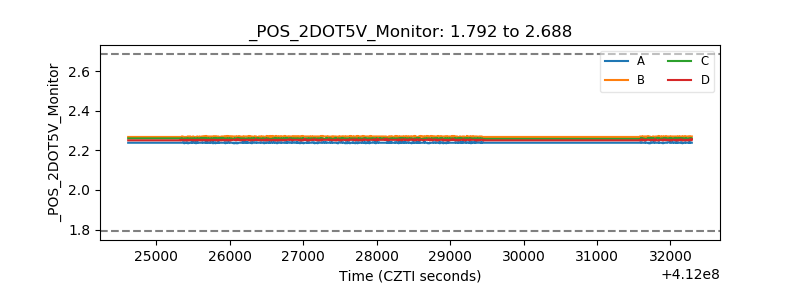 |
| +5 Volts monitor | 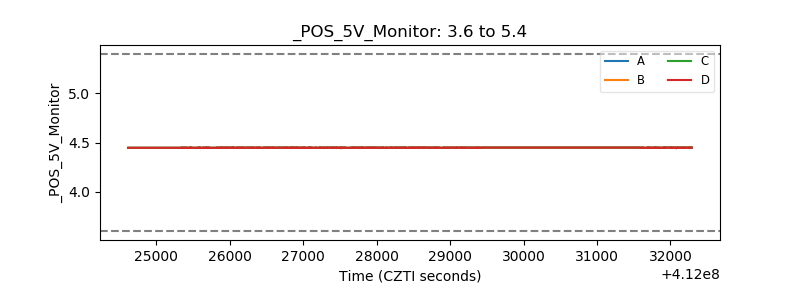 |
| _ROLL_ROT | 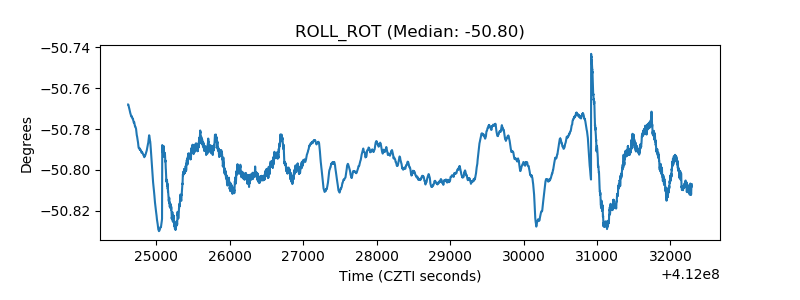 |
| _Roll_DEC | 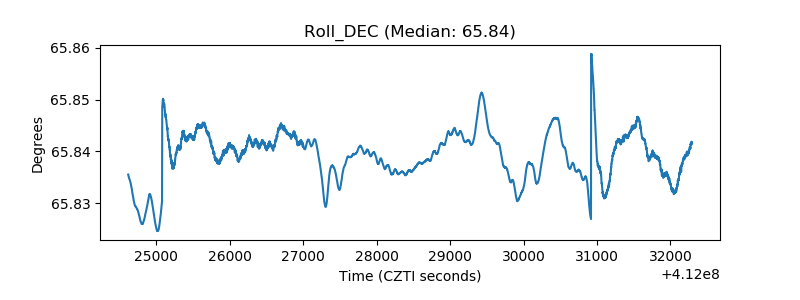 |
| _Roll_RA | 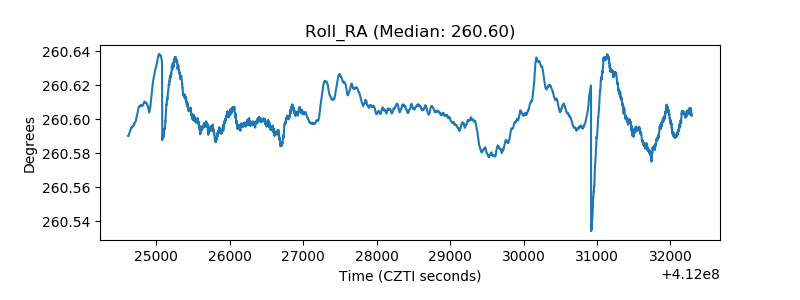 |
| Veto Counter | 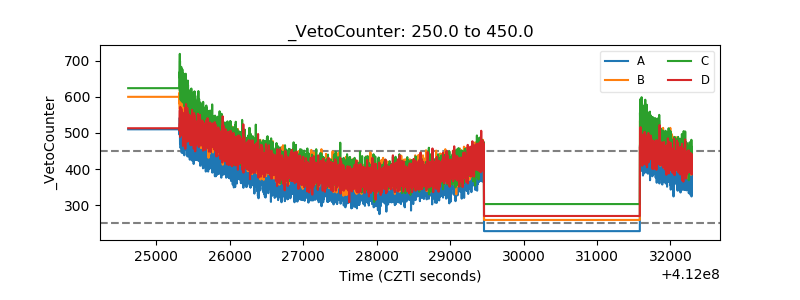 |