| Param | Original file | Final file |
|---|---|---|
| Filename | modeM0/AS1A12_018T01_9000005488_39564cztM0_level2.fits | modeM0/AS1A12_018T01_9000005488_39564cztM0_level2_quad_clean.evt |
| Size (bytes) | 425,128,320 | 84,456,000 |
| Size | 405.4 MB | 80.5 MB |
| Events in quadrant A | 4,219,694 | 570,335 |
| Events in quadrant B | 2,189,897 | 600,278 |
| Events in quadrant C | 4,602,391 | 532,894 |
| Events in quadrant D | 4,340,776 | 506,434 |
| Mode SS | |||
|---|---|---|---|
| Quadrant | BADHDUFLAG | Total packets | Discarded packets |
| A | 0 | 102 | 0 |
| B | 0 | 102 | 0 |
| C | 0 | 102 | 0 |
| D | 0 | 102 | 0 |
| Mode M0 | |||
|---|---|---|---|
| Quadrant | BADHDUFLAG | Total packets | Discarded packets |
| A | 0 | 16064 | 3 |
| B | 0 | 10070 | 2 |
| C | 0 | 17022 | 2 |
| D | 0 | 16417 | 2 |
| Mode M9 | |||
|---|---|---|---|
| Quadrant | BADHDUFLAG | Total packets | Discarded packets |
| A | 0 | 32 | 0 |
| B | 0 | 32 | 0 |
| C | 0 | 32 | 0 |
| D | 0 | 33 | 0 |
| Quadrant | Total seconds | Saturated seconds | Saturation percentage |
|---|---|---|---|
| A | 4949 | 119 | 2.404526% |
| B | 4949 | 19 | 0.383916% |
| C | 4949 | 491 | 9.921196% |
| D | 4949 | 338 | 6.829663% |
Noise dominated data is calculated using 1-second bins in cleaned event files. If a bin has >2000 counts, and if more than 50% of those come from <1% of pixels, then it is considered to be noise-dominated and hence unusable.
| Quadrant | # 1 sec bins | Bins with >0 counts | Bins with >2000 counts | High rate bins dominated by noise | Noise dominated (total time) | Noise dominated (detector-on time) | Marked lightcurve |
|---|---|---|---|---|---|---|---|
| A | 7071 | 4950 | 102 | 102 | 1.44% | 2.06% | 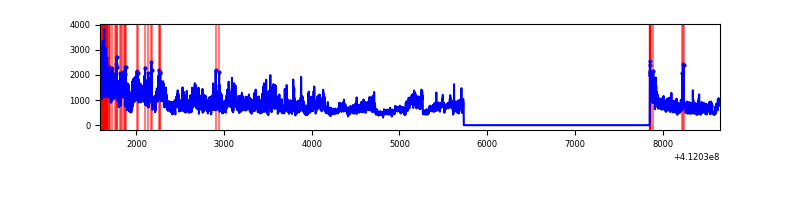 |
| B | 7071 | 4950 | 6 | 6 | 0.08% | 0.12% | 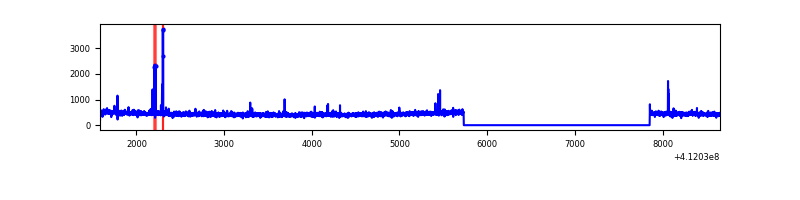 |
| C | 7071 | 4950 | 455 | 455 | 6.43% | 9.19% | 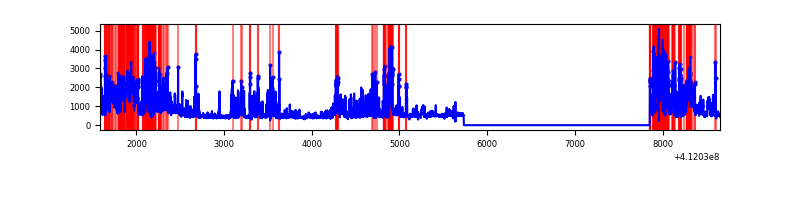 |
| D | 7071 | 4950 | 304 | 304 | 4.30% | 6.14% | 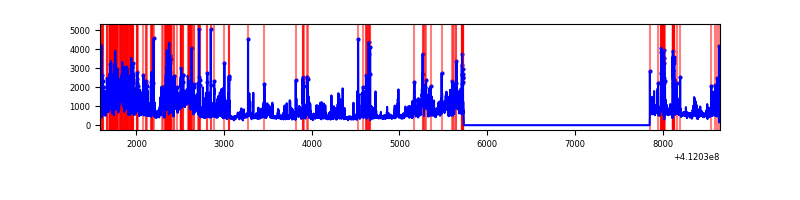 |
Top three noisy pixels from each quadrant. If the there are fewer than three noisy pixels in the level2.evt file, extra rows are filled as -1
| Pixel properties | Quadrant properties | ||||||
|---|---|---|---|---|---|---|---|
| Quadrant | DetID | PixID | Counts | Sigma | Mean | Median | Sigma |
| A | 15 | 222 | 1677560 | 15509.26 | 529 | 518 | 108.1 |
| A | 10 | 83 | 396192 | 3659.19 | 529 | 518 | 108.1 |
| A | 13 | 248 | 46757 | 427.62 | 529 | 518 | 108.1 |
| B | 5 | 172 | 50499 | 485.66 | 536 | 522 | 102.9 |
| B | 5 | 255 | 20194 | 191.17 | 536 | 522 | 102.9 |
| B | 12 | 111 | 12613 | 117.5 | 536 | 522 | 102.9 |
| C | 9 | 187 | 1540862 | 13067.47 | 507 | 511 | 117.9 |
| C | 15 | 208 | 856763 | 7263.96 | 507 | 511 | 117.9 |
| C | 15 | 214 | 201756 | 1707.25 | 507 | 511 | 117.9 |
| D | 12 | 227 | 1082698 | 8615.2 | 511 | 498 | 125.6 |
| D | 1 | 52 | 411305 | 3270.36 | 511 | 498 | 125.6 |
| D | 7 | 38 | 388065 | 3085.35 | 511 | 498 | 125.6 |
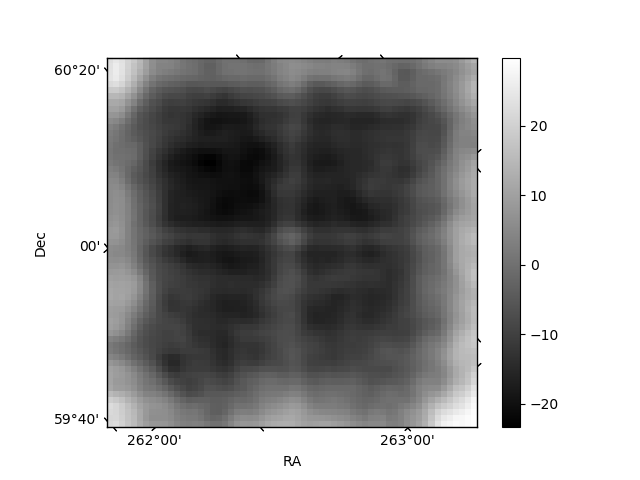
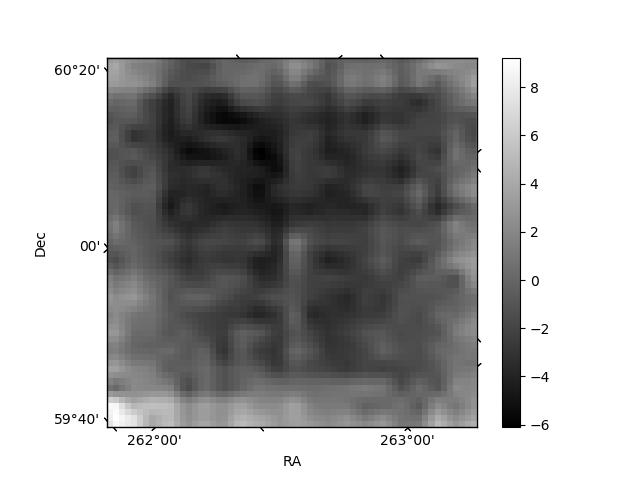
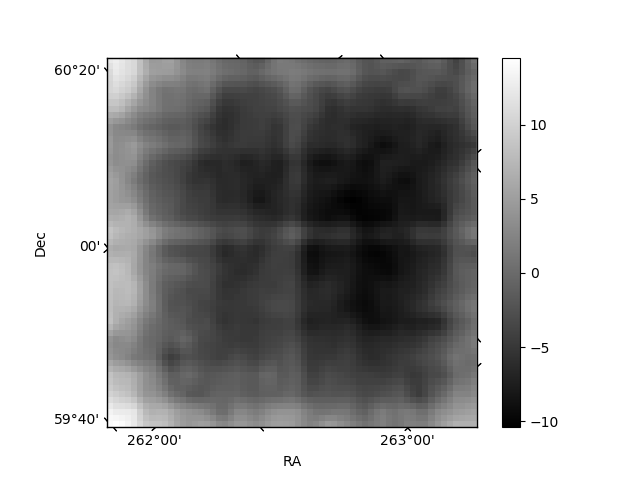
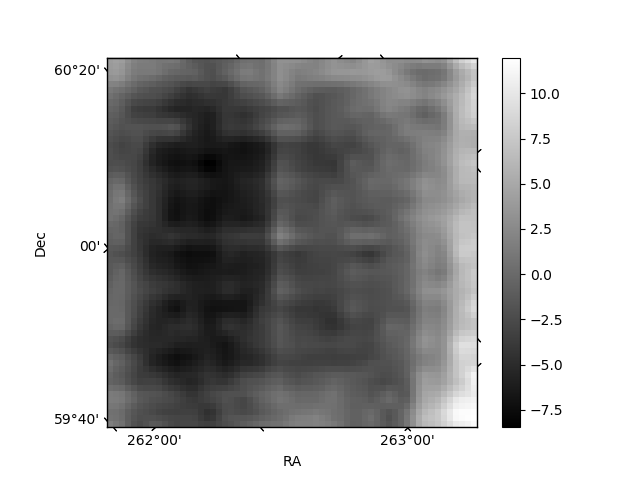
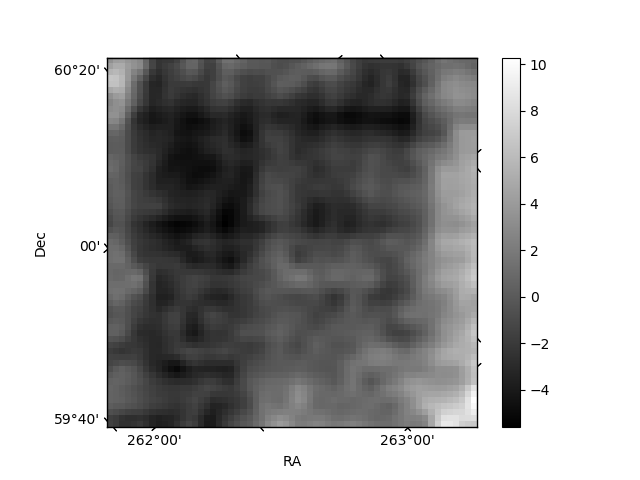
Histogram calculated using DETX and DETY for each event in the final _common_clean file
| Quadrant A | 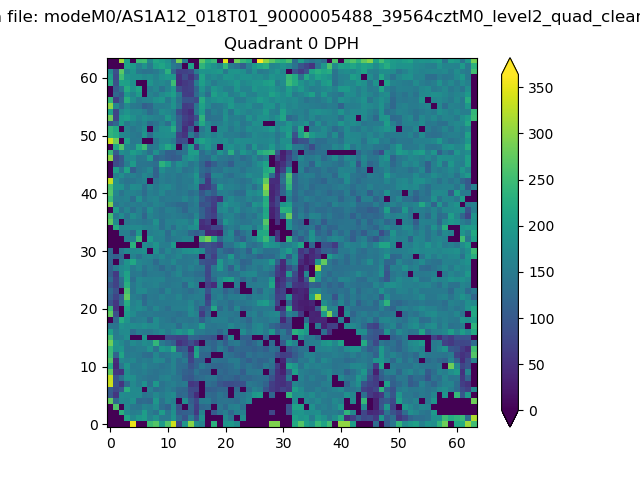 |
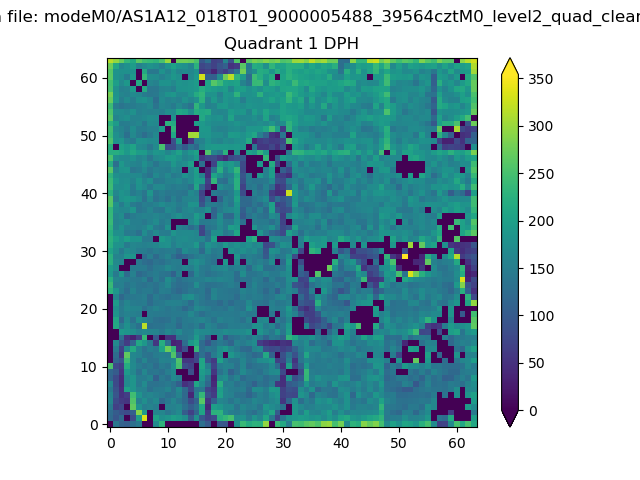 |
Quadrant B |
|---|---|---|---|
| Quadrant D | 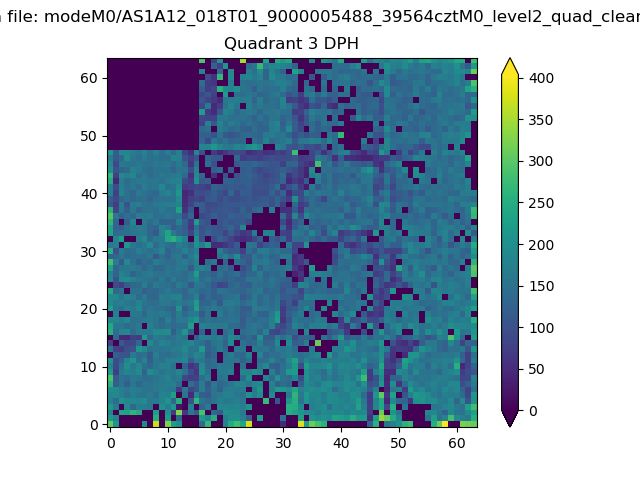 |
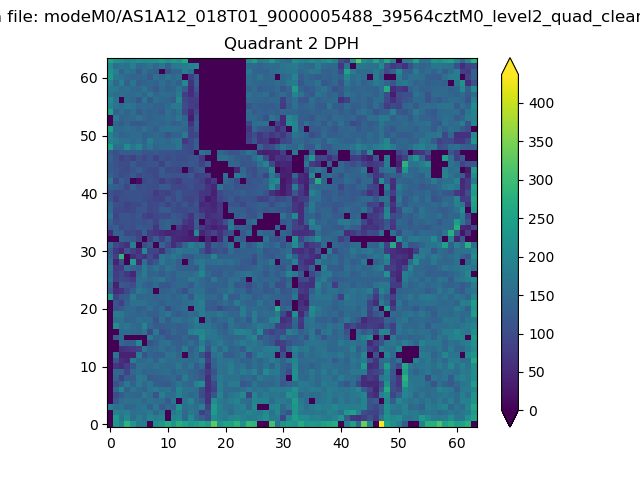 |
Quadrant C |
| Plot type | Count rate plots | Images |
|---|---|---|
| Comparison with Poisson distribution Blue bars denote a histogram of data divided into 1 sec bins. Red curve is a Poisson curve with rate = median count rate of data. |
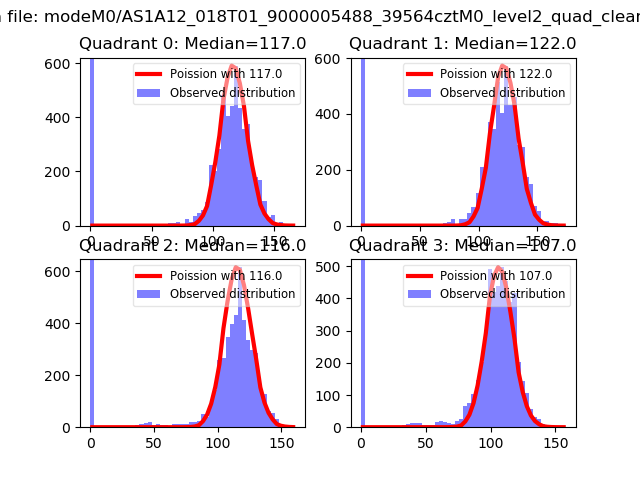 |
 |
| Quadrant-wise count rates Data is divided into 100 sec bins |
 |
|
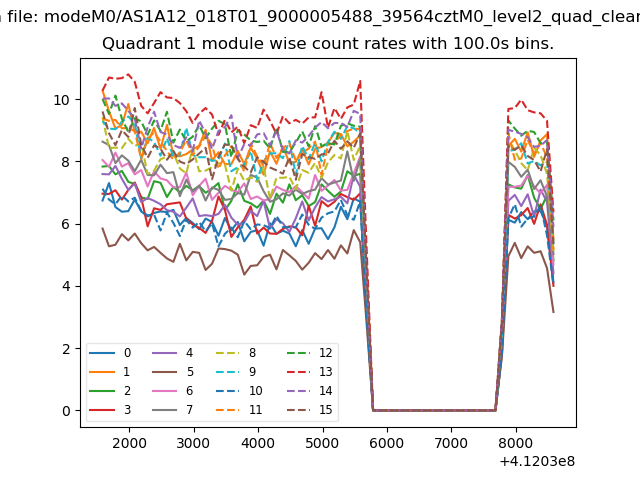
| Module-wise count rates for Quadrant A Data is divided into 100 sec bins |
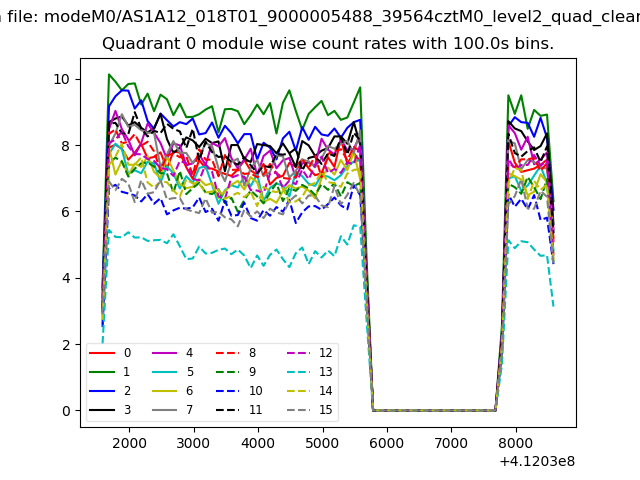 |
 |
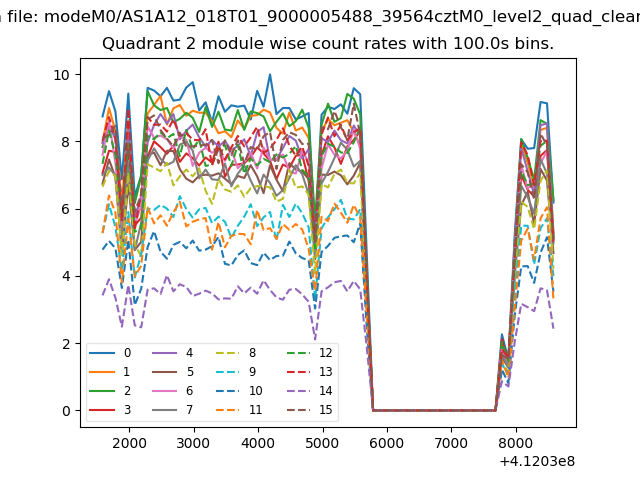
| Module-wise count rates for Quadrant B Data is divided into 100 sec bins |
 |
 |
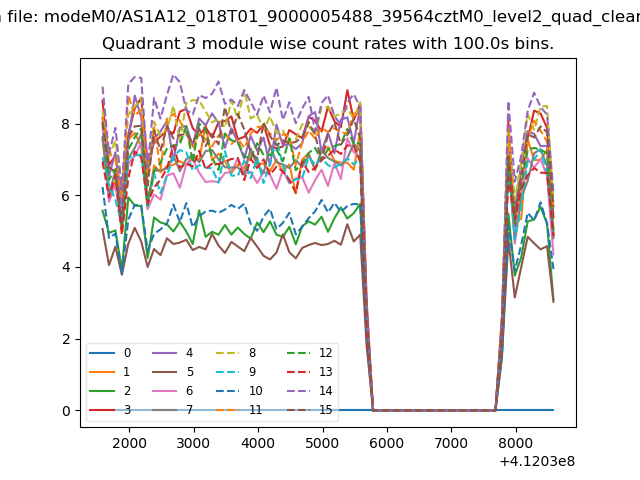
| Module-wise count rates for Quadrant C Data is divided into 100 sec bins |
 |
 |
| Module-wise count rates for Quadrant D Data is divided into 100 sec bins |
 |
 |
| Parameter | Plot |
|---|---|
| CZT HV Monitor | 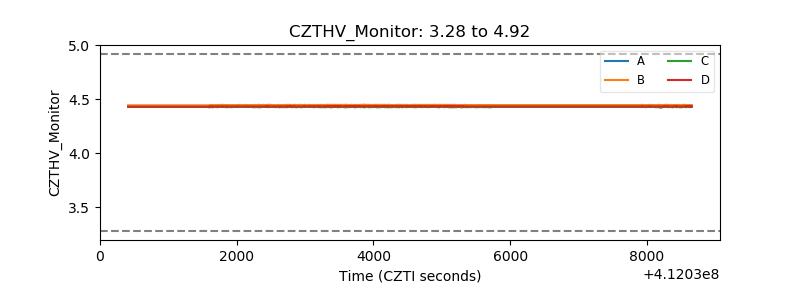 |
| D_VDD | 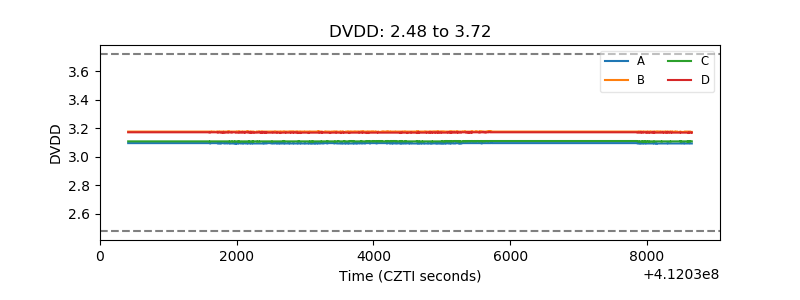 |
| Temperature 1 | 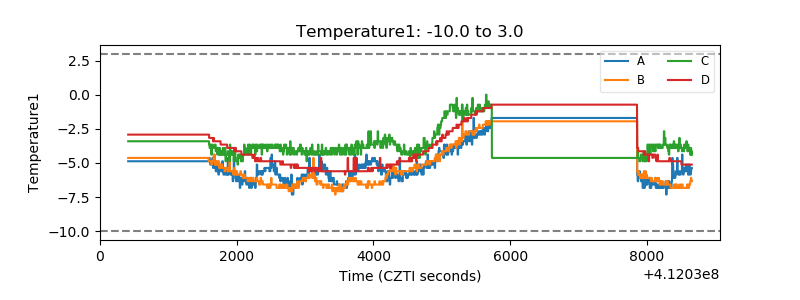 |
| Veto HV Monitor | 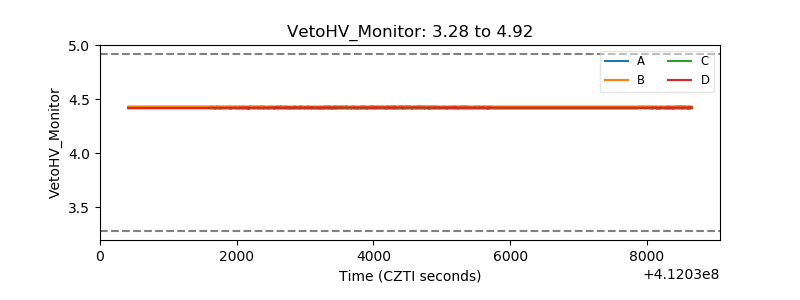 |
| Veto LLD | 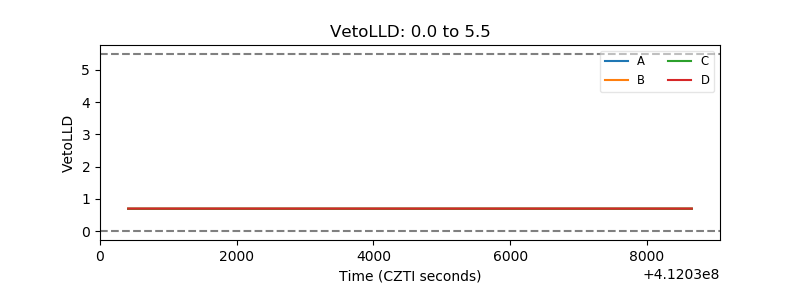 |
| Alpha Counter | 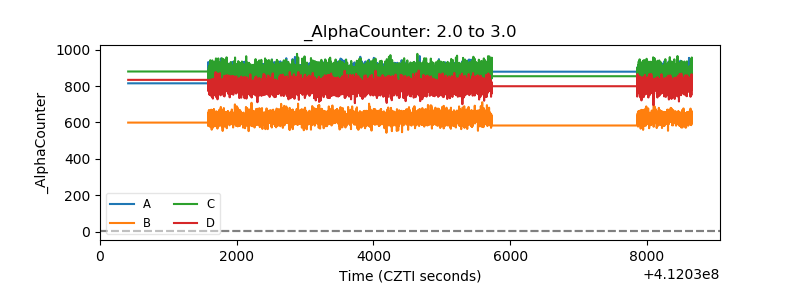 |
| _CPM_Rate | 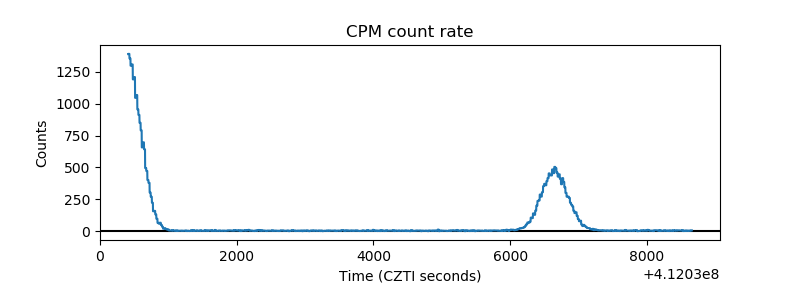 |
| CZT Counter | 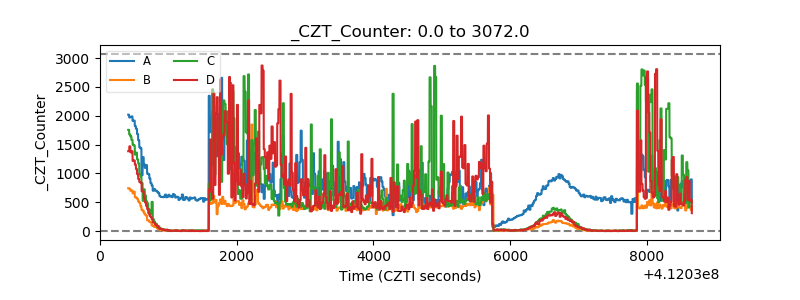 |
| +2.5 Volts monitor | 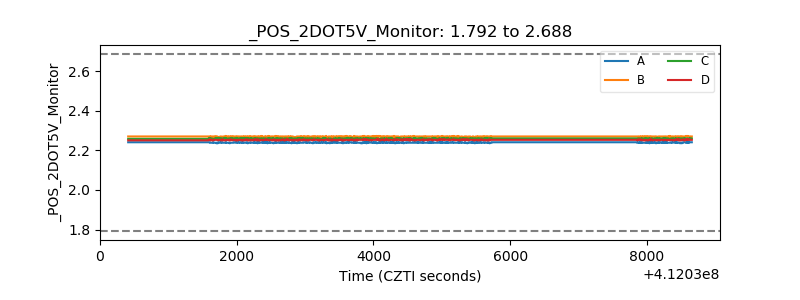 |
| +5 Volts monitor | 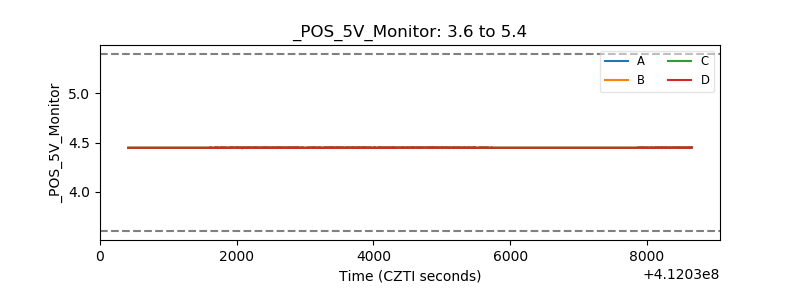 |
| _ROLL_ROT | 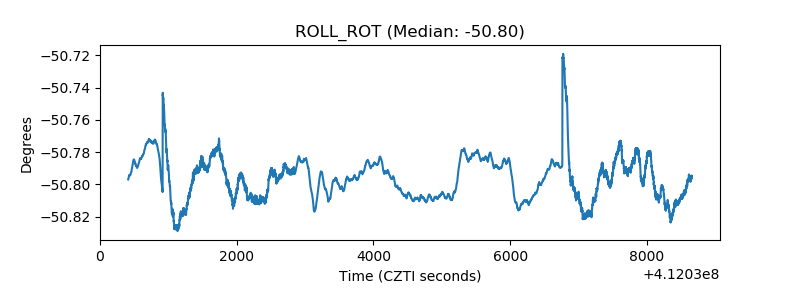 |
| _Roll_DEC | 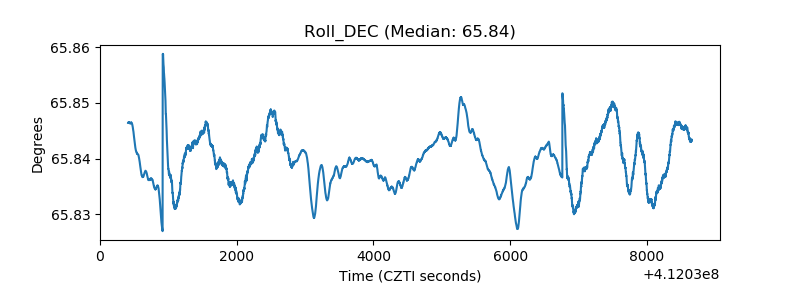 |
| _Roll_RA | 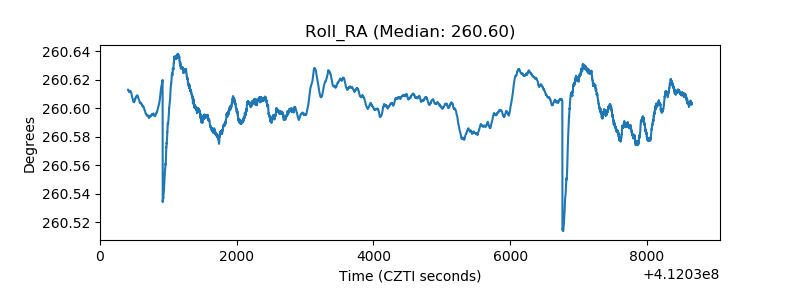 |
| Veto Counter | 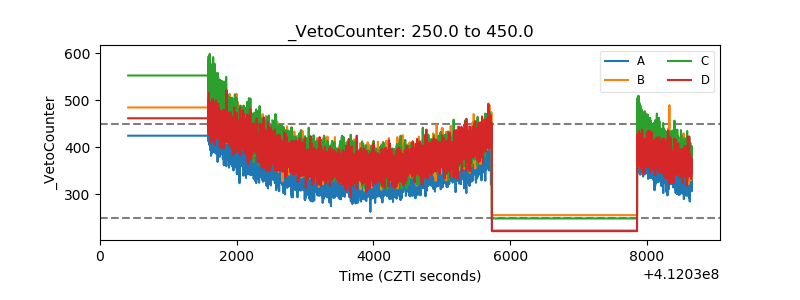 |