| Param | Original file | Final file |
|---|---|---|
| Filename | modeM0/AS1A12_018T01_9000005488_39565cztM0_level2.fits | modeM0/AS1A12_018T01_9000005488_39565cztM0_level2_quad_clean.evt |
| Size (bytes) | 468,025,920 | 85,731,840 |
| Size | 446.3 MB | 81.8 MB |
| Events in quadrant A | 3,550,964 | 595,482 |
| Events in quadrant B | 2,282,546 | 616,794 |
| Events in quadrant C | 6,253,594 | 512,464 |
| Events in quadrant D | 4,821,435 | 495,786 |
| Mode SS | |||
|---|---|---|---|
| Quadrant | BADHDUFLAG | Total packets | Discarded packets |
| A | 0 | 110 | 0 |
| B | 0 | 110 | 0 |
| C | 0 | 110 | 0 |
| D | 0 | 110 | 0 |
| Mode M0 | |||
|---|---|---|---|
| Quadrant | BADHDUFLAG | Total packets | Discarded packets |
| A | 0 | 14300 | 3 |
| B | 0 | 10906 | 2 |
| C | 0 | 22198 | 2 |
| D | 0 | 18128 | 2 |
| Mode M9 | |||
|---|---|---|---|
| Quadrant | BADHDUFLAG | Total packets | Discarded packets |
| A | 0 | 36 | 0 |
| B | 0 | 36 | 0 |
| C | 0 | 36 | 0 |
| D | 0 | 37 | 0 |
| Quadrant | Total seconds | Saturated seconds | Saturation percentage |
|---|---|---|---|
| A | 5361 | 44 | 0.820742% |
| B | 5361 | 19 | 0.354411% |
| C | 5361 | 908 | 16.937139% |
| D | 5361 | 603 | 11.247902% |
Noise dominated data is calculated using 1-second bins in cleaned event files. If a bin has >2000 counts, and if more than 50% of those come from <1% of pixels, then it is considered to be noise-dominated and hence unusable.
| Quadrant | # 1 sec bins | Bins with >0 counts | Bins with >2000 counts | High rate bins dominated by noise | Noise dominated (total time) | Noise dominated (detector-on time) | Marked lightcurve |
|---|---|---|---|---|---|---|---|
| A | 7334 | 5362 | 38 | 38 | 0.52% | 0.71% | 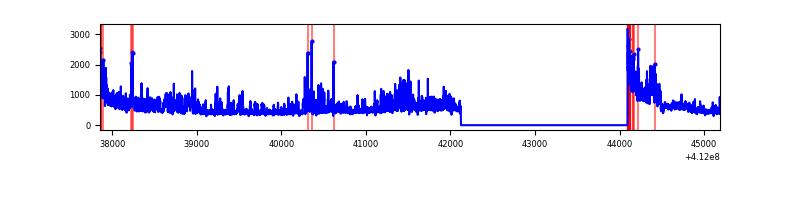 |
| B | 7334 | 5362 | 7 | 7 | 0.10% | 0.13% | 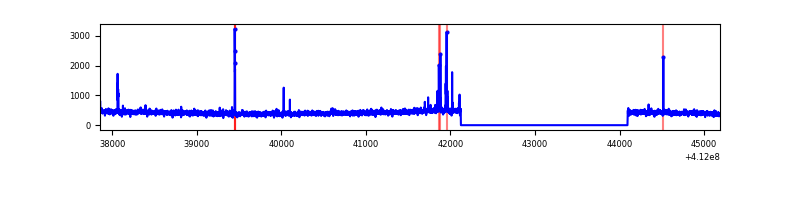 |
| C | 7334 | 5362 | 906 | 906 | 12.35% | 16.90% | 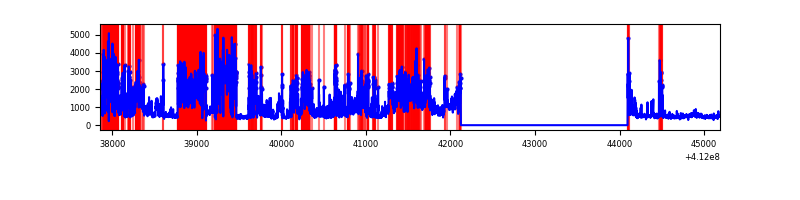 |
| D | 7334 | 5362 | 566 | 566 | 7.72% | 10.56% | 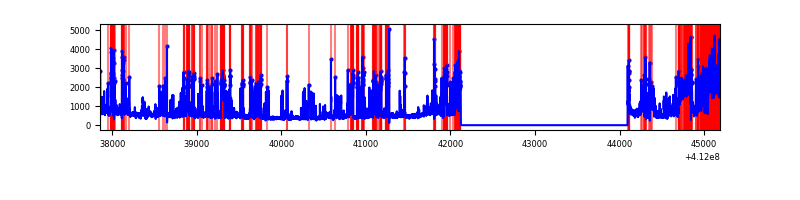 |
Top three noisy pixels from each quadrant. If the there are fewer than three noisy pixels in the level2.evt file, extra rows are filled as -1
| Pixel properties | Quadrant properties | ||||||
|---|---|---|---|---|---|---|---|
| Quadrant | DetID | PixID | Counts | Sigma | Mean | Median | Sigma |
| A | 15 | 222 | 832928 | 7383.11 | 558 | 548 | 112.7 |
| A | 10 | 83 | 424966 | 3764.54 | 558 | 548 | 112.7 |
| A | 13 | 248 | 82180 | 724.07 | 558 | 548 | 112.7 |
| B | 5 | 255 | 67255 | 615.9 | 560 | 545 | 108.3 |
| B | 12 | 111 | 13529 | 119.88 | 560 | 545 | 108.3 |
| B | 11 | 111 | 12191 | 107.52 | 560 | 545 | 108.3 |
| C | 15 | 208 | 2073943 | 17512.99 | 512 | 515 | 118.4 |
| C | 9 | 187 | 1943720 | 16413.08 | 512 | 515 | 118.4 |
| C | 15 | 214 | 210234 | 1771.37 | 512 | 515 | 118.4 |
| D | 12 | 227 | 1467811 | 11488.47 | 518 | 503 | 127.7 |
| D | 7 | 38 | 661261 | 5173.49 | 518 | 503 | 127.7 |
| D | 12 | 0 | 148947 | 1162.26 | 518 | 503 | 127.7 |
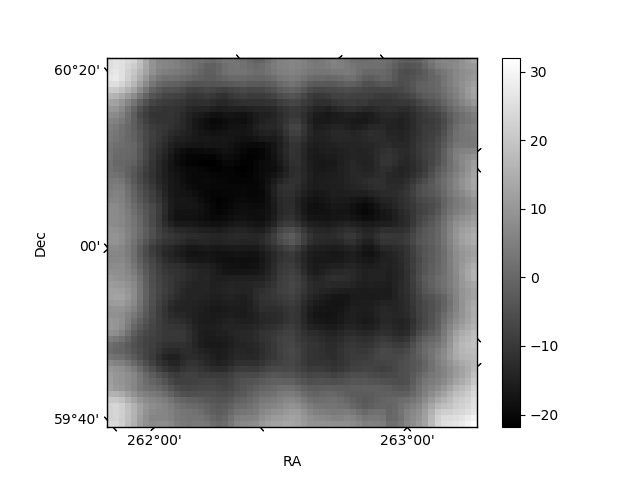
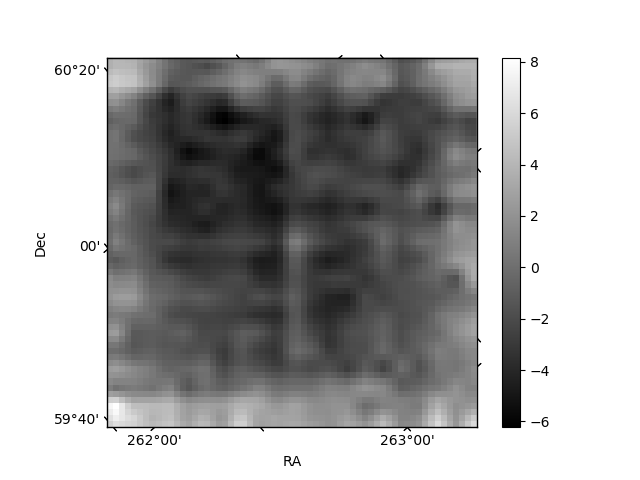
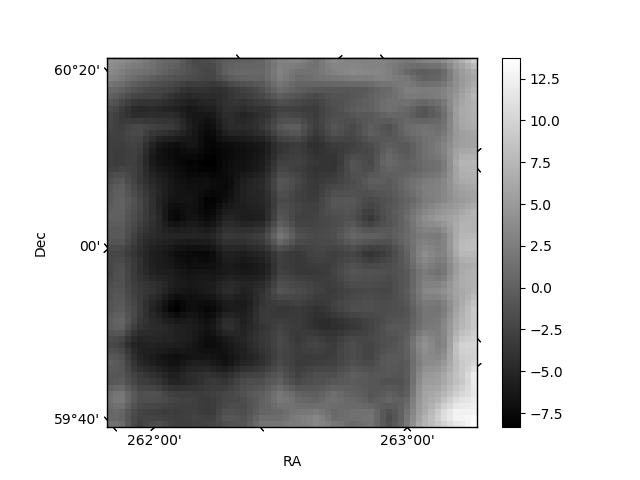
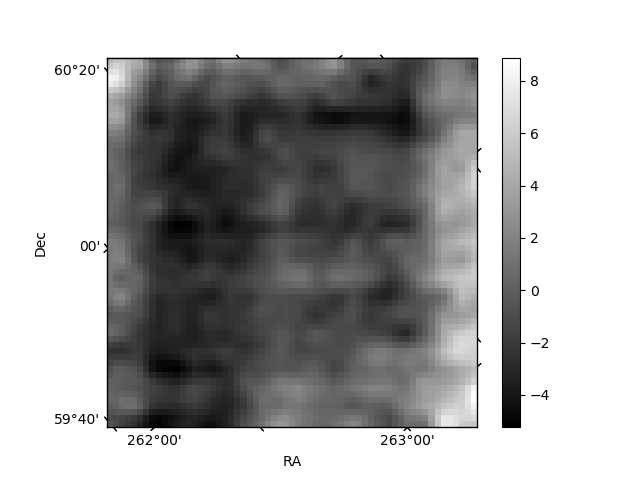
Histogram calculated using DETX and DETY for each event in the final _common_clean file
| Quadrant A | 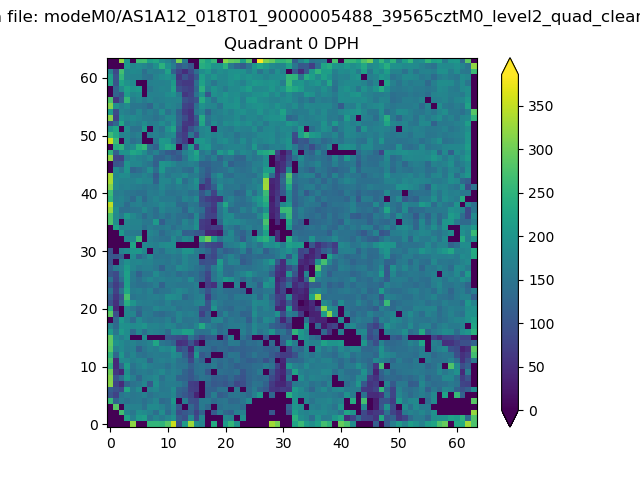 |
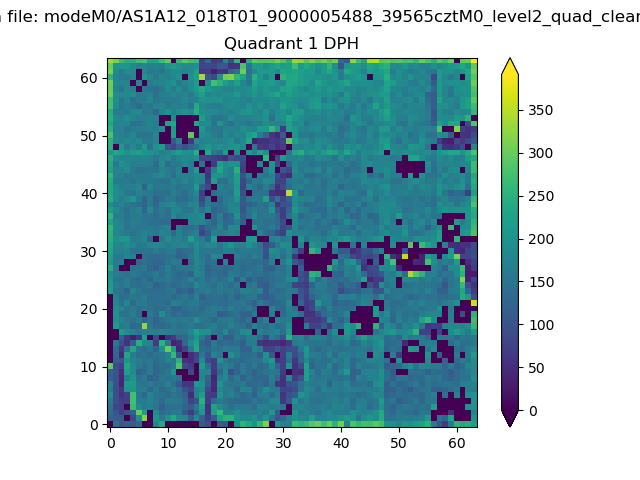 |
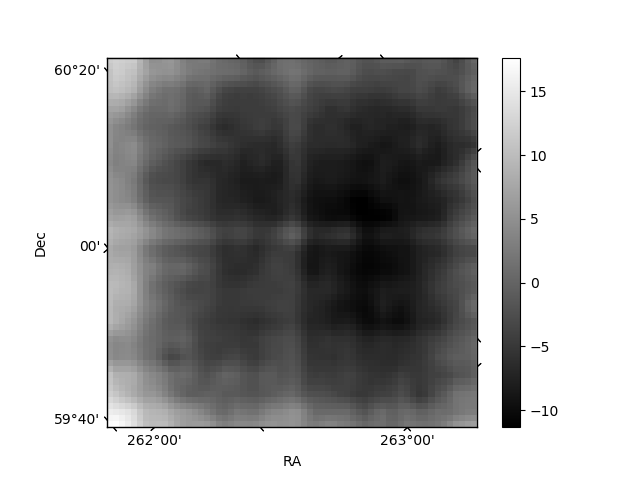
Quadrant B |
|---|---|---|---|
| Quadrant D | 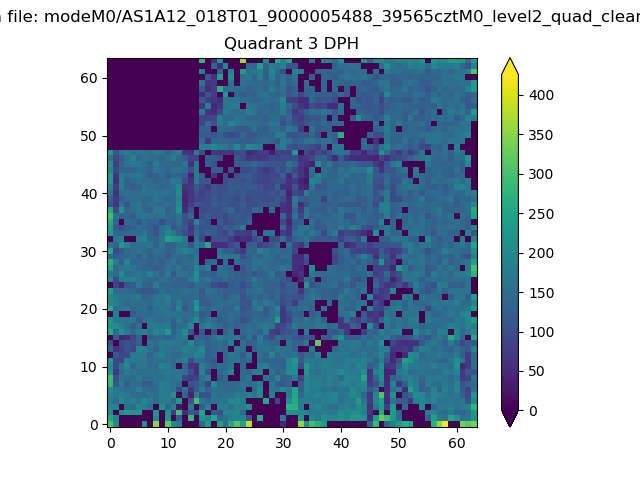 |
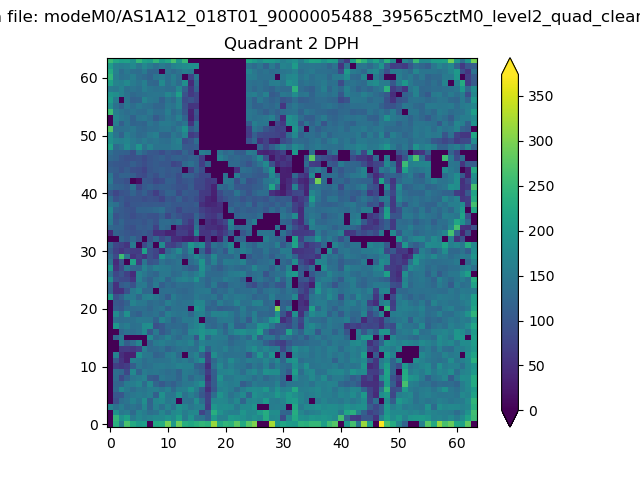 |
Quadrant C |
| Plot type | Count rate plots | Images |
|---|---|---|
| Comparison with Poisson distribution Blue bars denote a histogram of data divided into 1 sec bins. Red curve is a Poisson curve with rate = median count rate of data. |
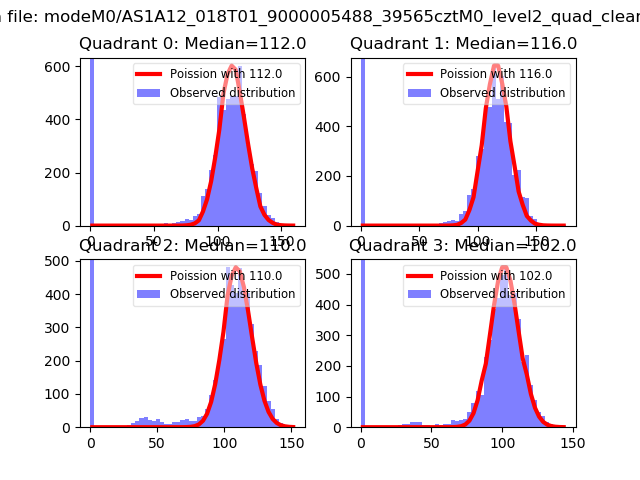 |
 |
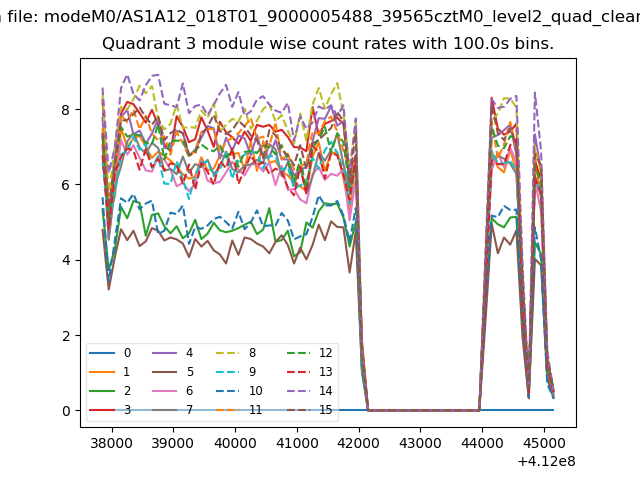
| Quadrant-wise count rates Data is divided into 100 sec bins |
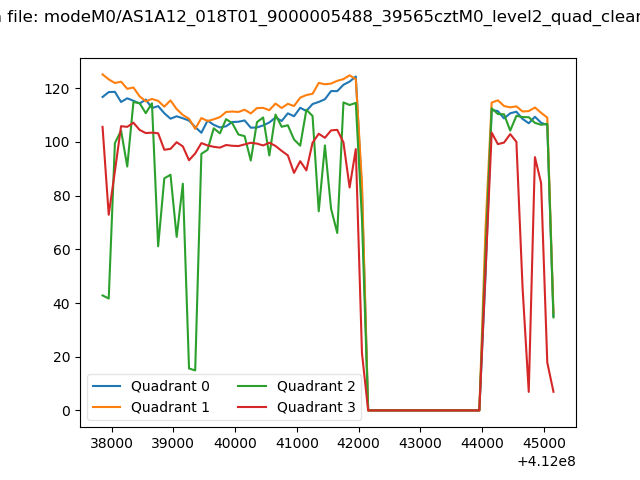 |
|
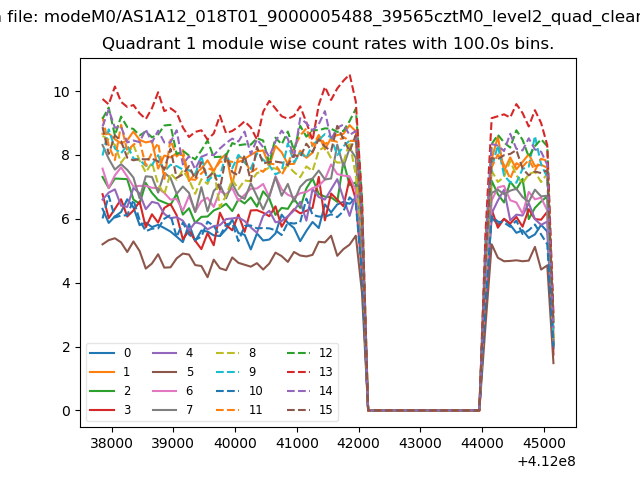
| Module-wise count rates for Quadrant A Data is divided into 100 sec bins |
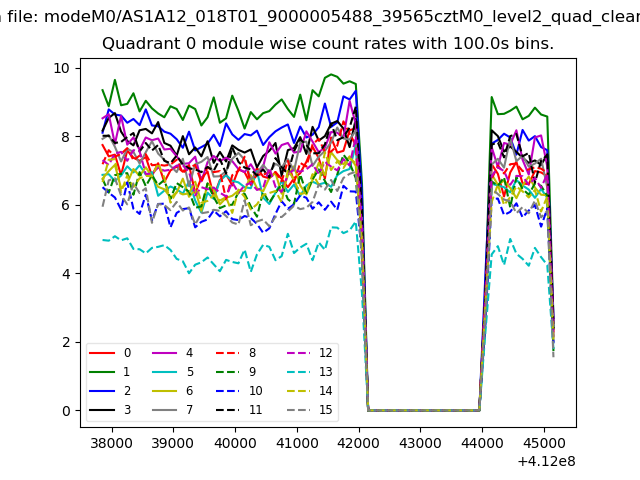 |
 |
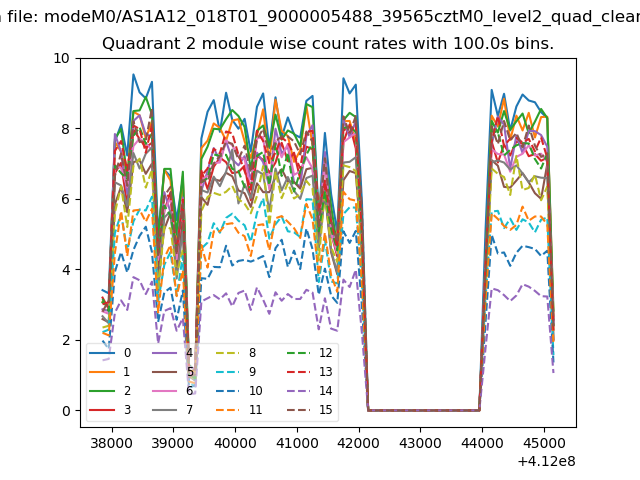
| Module-wise count rates for Quadrant B Data is divided into 100 sec bins |
 |
 |
| Module-wise count rates for Quadrant C Data is divided into 100 sec bins |
 |
 |
| Module-wise count rates for Quadrant D Data is divided into 100 sec bins |
 |
 |
| Parameter | Plot |
|---|---|
| CZT HV Monitor | 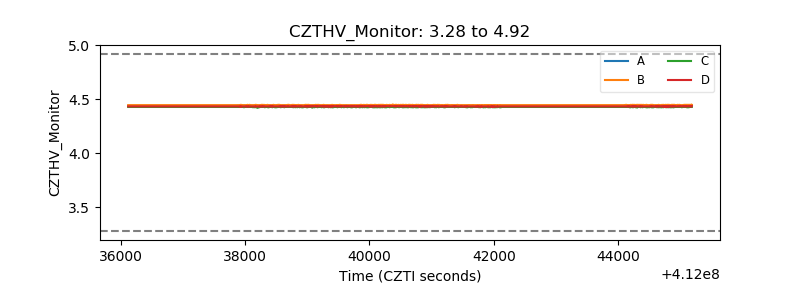 |
| D_VDD | 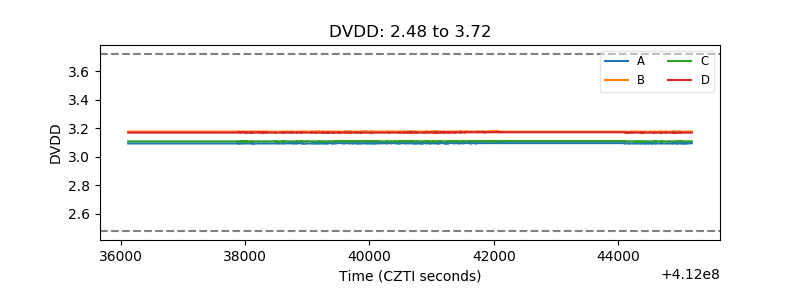 |
| Temperature 1 | 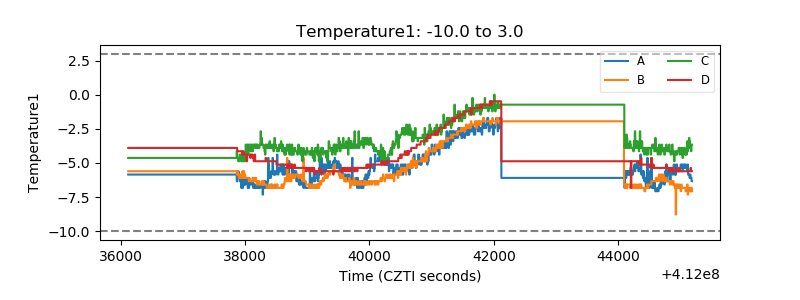 |
| Veto HV Monitor | 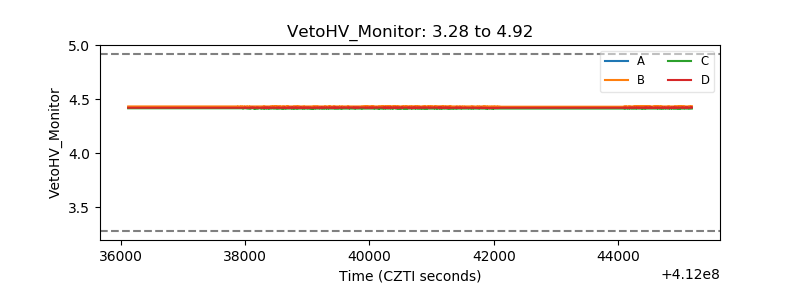 |
| Veto LLD | 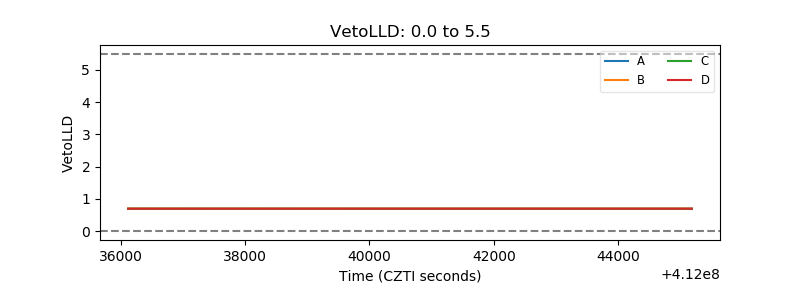 |
| Alpha Counter | 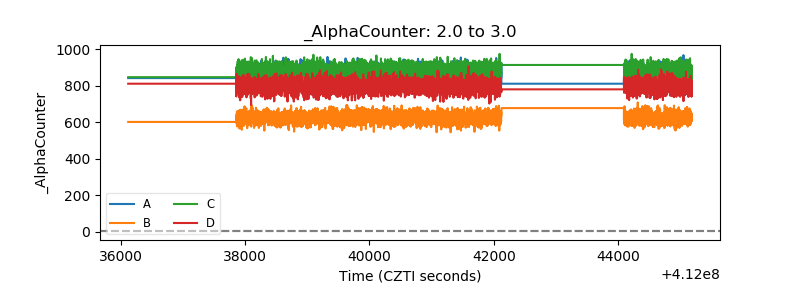 |
| _CPM_Rate | 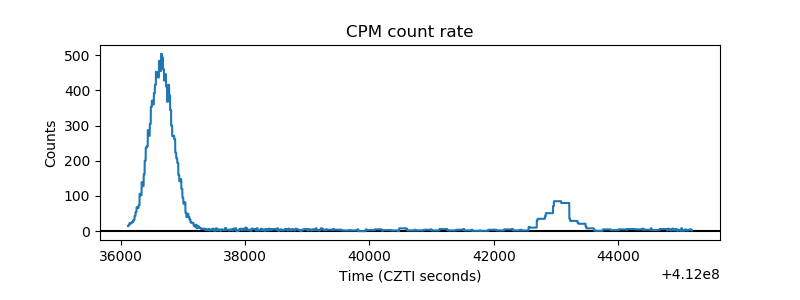 |
| CZT Counter | 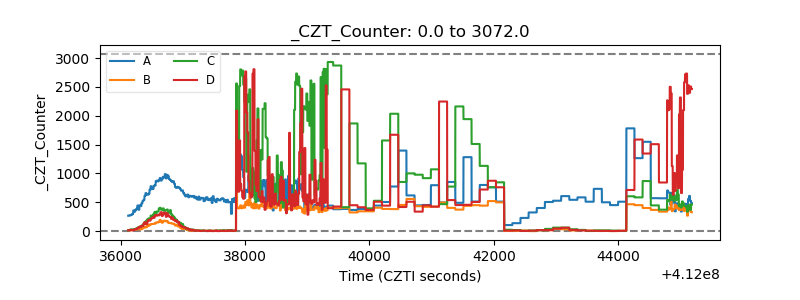 |
| +2.5 Volts monitor | 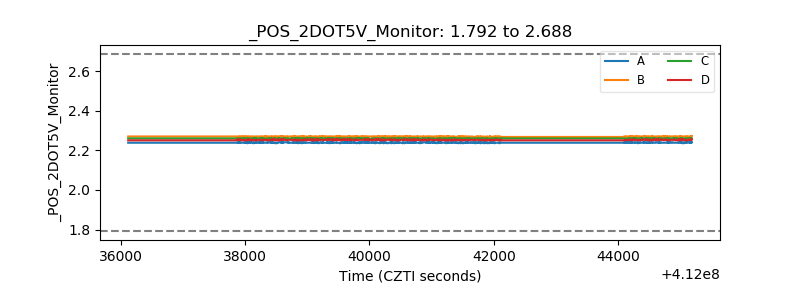 |
| +5 Volts monitor | 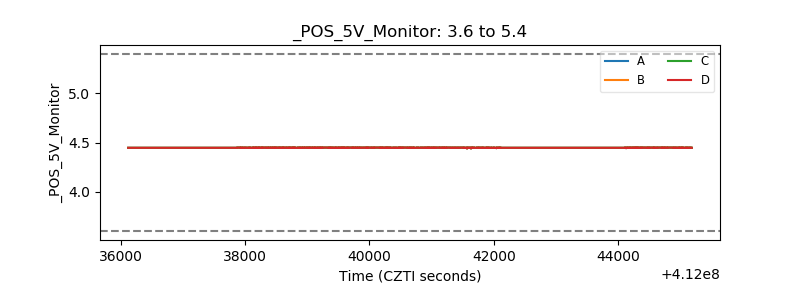 |
| _ROLL_ROT | 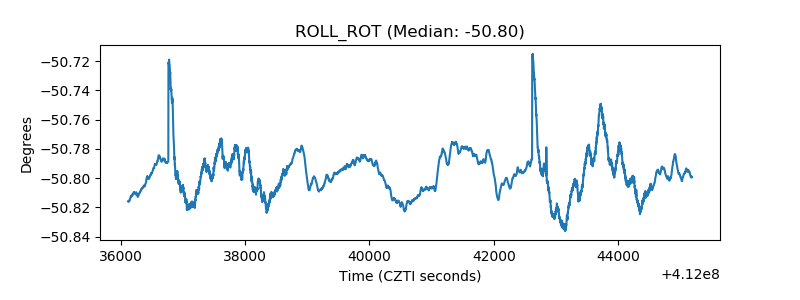 |
| _Roll_DEC | 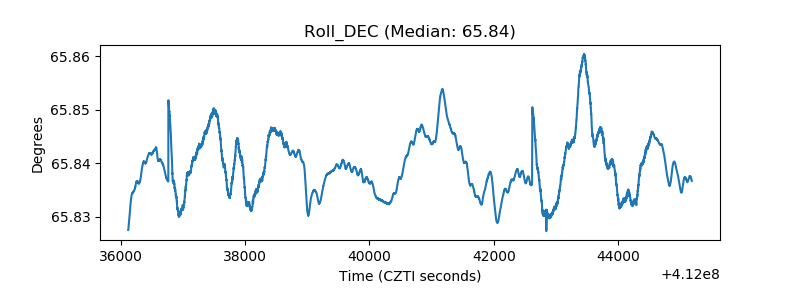 |
| _Roll_RA | 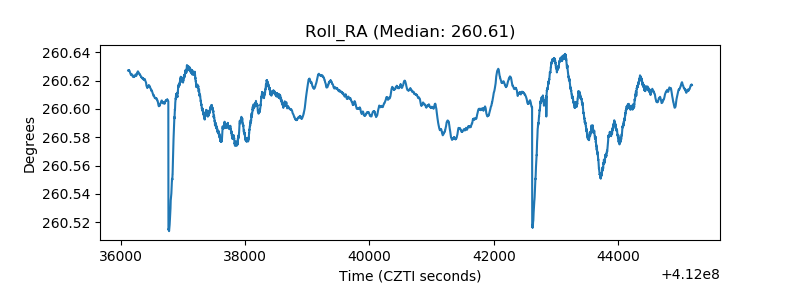 |
| Veto Counter | 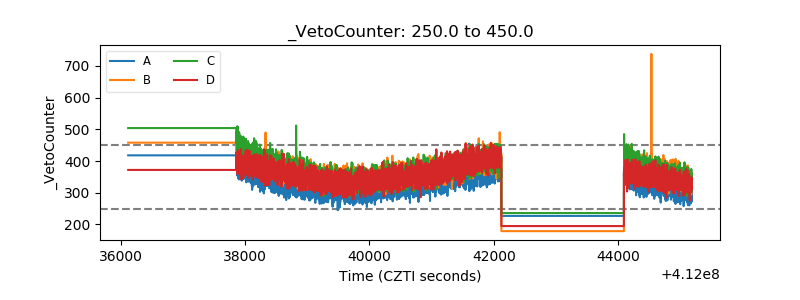 |